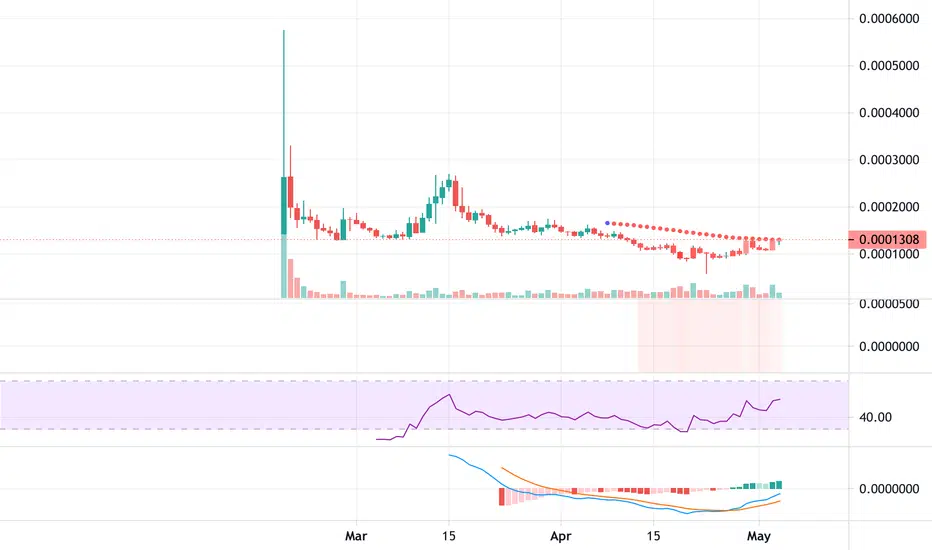
Frax Share Qualitative Market SignalsHere we have two main signals to consider:
1) The bottom going flat. This one I just mentioned in the STORJBTC trade-idea. When the bottom goes flat vs lower lows as in the downtrend, it signals upcoming change.
2) Steep decline. A very strong/steep decline tend to leads to a very strong/steep rise.
There is another one but this isn't such a strong signal on its own:
3) Prolonged bearish action can lead to massive bullish growth. When the market over-extends in one direction, it tends to compensate by moving with strength, when it does, in the opposite direction. This means that the bullish-wave can develop with maximum growth momentum; this is only a potential.
There is more...
4) Marketwide action. The most important signal might be the rest of the market. What one does; the rest follows.
Just as the other altcoins are starting to wake-up, on the bitcoin side, we can expect those pairs that are active and ready, to do the same. Of course, not all of them will move but there is a certain group that will surely do.
The fact that the other pairs are waking up, printing bottoms and breaking out, is positive signal that related pairs can and will do the same.
This is the next level of technical analysis. Using the qualitative aspects of the market to spot the correct chart setup and extract the right numbers to trade.
Thank you for reading.
All the information here shared is intended for learning and entertainment purposes only. Your support is appreciated.
See you on the next one.
First meditation, then work.
Namaste.
FXSBTC trade ideas


✳️ Frax Share Can Grow Over 100% vs Bitcoin, Short-Term (Fast) The truth is that Frax Share has already been growing vs Bitcoin (FXSBTC) but it's been only a few days...
Technical analysis?
We have two main signals to look at and then the rest:
1) Notice the ultra long lower wick on the 9-Nov session. This candle works as a very strong reversal signal. It is supported by high volume.
2) Yesterday EMA50 is conquered as resistance with even higher volume compared to 9-Nov. Both these signals precede higher prices.
👉 FXSBTC can easily grow beyond 50% in the coming days (first target) with 109% (second target) being easy as well... The potential is much bigger but that is something for another day.
Once you pick the bottom, the reversal, buy and hold, the market can take care of the rest.
Once we are in the green, all we need do is to let it rest, while it grows.
Namaste.

FXS/BTC - Frax Share: SuperTrend Resistance_Breakout_Confirmatio◳◱ We have successfully identified two favorable trading patterns, namely the Super Trend and the Resistance Breakout, on the CRYPTOCAP:FXS / CRYPTOCAP:BTC chart. Both of these indicators are signaling a bullish trend, with the Super Trend indicating a sustained uptrend and the Resistance Breakout confirming this sentiment by surpassing a key resistance level. Given the alignment and convergence of these powerful signals, it is highly advisable to consider entering a long position with ambitious profit targets. Our meticulous analysis reveals that key resistance levels are present at 0.00020233 | 0.00021426 | 0.00023829, accompanied by significant support zones at 0.0001783 | 0.0001662 | 0.00014217. However, it is essential to exercise prudence and consider other crucial factors, such as overall market conditions and additional technical indicators, before finalizing any trade decision.
◰◲ General info :
▣ Name: Frax Share
▣ Rank: 91
▣ Exchanges: Binance, Kucoin, Hitbtc
▣ Category/Sector: Financial - Stablecoins
▣ Overview: Frax attempts to be the first fractional-algorithmic stablecoin protocol to implement design principles of both collateralized and algorithmic stablecoins. The Frax protocol is a two token system - the stablecoin FRAX, and Frax Shares (FXS), which are used to stablise the system, accrue seigniorage revenue and fees, as well as provide governance rights. The degree to which FRAX is collateralized is determined by market forces, with the collateral ratio determining the proportion of FRAX outstanding to be backed by collateral, with the remainder in FXS.
◰◲ Technical Metrics :
▣ Mrkt Price: 0.00019968 ₿
▣ 24HVol: 0.644 ₿
▣ 24H Chng: 3.504%
▣ 7-Days Chng: 2.92%
▣ 1-Month Chng: -6.84%
▣ 3-Months Chng: -36.01%
◲◰ Pivot Points - Levels :
◥ Resistance: 0.00020233 | 0.00021426 | 0.00023829
◢ Support: 0.0001783 | 0.0001662 | 0.00014217
◱◳ Indicators recommendation :
▣ Oscillators: NEUTRAL
▣ Moving Averages: STRONG_BUY
◰◲ Technical Indicators Summary : BUY
◲◰ Sharpe Ratios :
▣ Last 30D: -1.45
▣ Last 90D: -1.77
▣ Last 1-Y: 0.65
▣ Last 3-Y: 0.70
◲◰ Volatility :
▣ Last 30D: 0.91
▣ Last 90D: 0.83
▣ Last 1-Y: 0.97
▣ Last 3-Y: 21.80
◳◰ Market Sentiment Index :
▣ News sentiment score is N/A
▣ Twitter sentiment score is N/A
▣ Reddit sentiment score is N/A
▣ In-depth FXSBTC technical analysis on Tradingview TA page
▣ What do you think of this analysis? Share your insights and let's discuss in the comments below. Your like, follow and support would be greatly appreciated!
◲ Disclaimer
Please note that the information and publications provided are for informational purposes only and should not be construed as financial, investment, trading, or any other type of advice or recommendation. We encourage you to conduct your own research and consult with a qualified professional before making any financial decisions. The use of the information provided is solely at your own risk.
▣ Welcome to the home of charting big: TradingView
Benefit from a ton of financial analysis features, instruments and data. Have a look around, and if you do choose to go with an upgraded plan, you'll get up to $30.
Discover it here - affiliate link -

✳️ Frax Share 520% Long-Term Potential Revealed!Subtle signals because this is a long-term chart yet revealing... Let's look at Frax Share vs Bitcoin (FXSBTC).
WARNING: Trading Altcoins vs Bitcoin (ALTSBTC) is for experts, high profitability ahead. Be aware!
Let's start by looking at the candles and volume.
✔️ FXSBTC produced four sessions flat, that is from early June through early July.
✔️ This week the highest volume came in on the bulls side since February.
✔️ In June 2022 we have one session marking the bottom and prices start to grow.
✔️ In 2023 we have 5 sessions forming a bottom and then prices will start to grow. This is an alternation, fast vs slow.
The potential is huge, we are looking at 323% and up to 522% mid to long-term but there can be more.
Once things start to develop we will know how much strength the bulls have, the momentum and we can update the charts and targets before the major bull-run, we have plenty of time.
Namaste.

✳️ Frax Share | 100% Success Rate, Clear UptrendMany Altcoins have been doing good but corrections can be strong.
Many Altcoins have been growing... Take a look at this one.
We looked at Frax Share vs Bitcoin (FXSBTC) 2-January, the exact the same date when it took off, we see the same pattern, another wave, another opportunity, easy one.
111% Can be the easy target, a higher high in continuation of the bullish trend.
Since we are set for massive gains, the next Fib. golden ratio level is also possible, at 375%.
Since this is a BTC pair and Bitcoin is also set to grow, we aim and plan for the first target mainly, if the other one happens, we take it as good luck.
Don't be greedy, be grateful for any and all wins, take your profits and move on.
Endless opportunities will continue to develop.
Day after day, week after week, month after month.
Just as we saw years of bearish action, we will see years of bullish growth.
Namaste.

✳️ Frax Share vs Bitcoin Bullish Pattern (50%+ Jump Revealed!) Look how beautiful the FXSBTC (Frax Share) chart looks... We have a very clear and strong bullish pattern.
We have a higher low this January 2023 compared to September 2022, just yesterday the bullish action got started.
We can see easily additional growth.
First 18% followed by 50%+.
More information on the chart.
The blue space is the support/stop-loss.
Namaste.

FXS LONGHav ebeen awaiting oppertunities to re-enter FXS, as can see the Trendmaster bouncing price higher, currently at that same level, counter trendline retested, and previous high retested. Hoping this level holds.

Frax Share (FXS) formed bullish Shark for upto 42.50% pumpHi dear friends, hope you are well and welcome to the new update on Frax Share (FXS) token
Prviously we caught more than 140% pump of FXS token as below:
On a daily time frame, FTX has formed a bullish Shark move for anaother bullish reversal move.
Note: Above idea is for educational purpose only. It is advised to diversify and strictly follow the stop loss, and don't get stuck with trade

FXSBTCFXS looks good and I think we can trust it and publicly we see a positive movement in the coming days

FXSBTC: breaking resistanceWhat Is the Frax Protocol (FRAX)?
The Frax Protocol is the first fractional-algorithmic stablecoin system. Frax is open-source, permissionless, and entirely on-chain – currently implemented on Ethereum (with possible cross chain implementations in the future). The end goal of the Frax protocol is to provide a highly scalable, decentralized, algorithmic money in place of fixed-supply digital assets like BTC. The protocol incorporates the following concepts:
Fractional-Algorithmic – Frax is a unique stablecoin with parts of its supply backed by collateral and parts of the supply algorithmic. The ratio of collateralized and algorithmic depends on the market's pricing of the FRAX stablecoin. If FRAX is trading at above $1, the protocol decreases the collateral ratio. If FRAX is trading at under $1, the protocol increases the collateral ratio.
Decentralized & Governance-minimized – Community governed and emphasizing a highly autonomous, algorithmic approach with no active management.
Fully on-chain oracles – Frax v1 uses Uniswap (ETH, USDT, USDC time-weighted average prices) and Chainlink (USD price) oracles.
Two Tokens – FRAX is the stablecoin targeting a tight band around $1/coin. Frax Shares (FXS) is the governance token which accrues fees, seigniorage revenue, and excess collateral value.
Before Frax, stablecoins were divided into three different categories: fiat collateralized, overcollateralized with cryptocurrency, and algorithmic with no collateral. Frax is the first kind of decentralized stablecoin to classify itself as fractional-algorithmic ushering in the 4th and most unique category.
How Many FRAX and FXS Coins Are There in Circulation?
The supply of the FRAX stablecoin is dynamic and always changing to keep the price at $1 due to its fractional-algorithmic monetary policy. The supply of the Frax Shares (FXS) tokens are hard capped to 100 million tokens at genesis with no inflation schedule in the protocol. The FXS token is the governance token which accrues all value of new minted FRAX, fees, and excess collateral. FXS is an investment and governance asset while FRAX is the currency token.
What Makes Frax Unique?
The Frax Protocol is a community driven and unique design stablecoin. Over 60% of the supply of FXS is issued over a number of years to liquidity providers and yield farmers. It is an entirely decentralized protocol with governance onchain. It is also the first and only stablecoin to incorporate the fractional-algorithmic hybrid design at the time of its launch in November 2020.
Who Are the Founders of the Frax Protocol?
The Frax Protocol is the brainchild of American software developer Sam Kazemian who came up with the first idea of a fractional-algorithmic stablecoin in 2019.
The founding team of Frax engineers includes Travis Moore and Jason Huan. Sam Kazemian originally devised the idea when he noticed that stablecoins were growing rapidly but none had any mixture of algorithmic monetary policy and collateralization. Projects that had purely algorithmic monetary policy had failed or shut down without any significant traction. Frax was designed as an answer to measure the market’s confidence in a partly algorithmic and partly collateralized stablecoin.

Frax Share (FXS) Chart Signals And PatternsFXSBTC (Frax Share) has a beautiful chart showing an ascending channel and some higher lows...
We have a strong spike on the RSI.
After hitting a higher low it is ready to grow.
We have hidden bullish divergence with the MACD compared to the August low.
Going back to the main chart, yesterday we had a candle challenge EMA50 and today we are looking to close above EMA10 and possibly EMA21 as well, switching the potentials towards the bulls.
We go strongly bullish above EMA50.
With all this being said, keep in mind that the charts can always change.
You need to have a plan/strategy developed before you trade.
This is Alan Santana.
Thanks a lot for reading.
Your support is truly appreciated.
Namaste.

$FXS/BTC 4h (Binance Spot) Bull-pennant breakoutFrax Share broke out bullish locally and looks ready for another leg-up that pull-back.
FXS is not only a DeFi token but also a member of the Avalanche Ecosystem!
It works as a governance for the Frax Protocol, which is the first fractional-algorithmic stablecoin system (FRAX).
Current Price= 0.00012369
Buy Entry= 0.00012395 - 0.00011715
Take Profit= 0.00014456 | 0.00015810 | 0.00018294
Stop Loss= 0.00010275
Risk/Reward= 1:1.35 | 1:2.11 | 1:3.51
Expected Profit= +19.92% | +31.15% | +51.75%
Possible Loss= -14.77%
Fib. Retracement= 0.5 | 0.786 | 1.272
Margin Leverage= 1x
Estimated Gain-time= 2 weeks

FXSBTC Technical Analysis
FXSBTC on H8 had formed a triangle. After the breakout and pump it will go down for the Pullback. It ix expected to continue the Bullish move after the Pullback.
⬆️Buy now or Buy at 0.0001040
⭕️SL @ 0.0000680
✅TP1 @ 0.0001490
✅TP2 @ 0.0001600
✅TP3 @ 0.0001800
✅TP4 @ 0.029000
✅TP5 @ 0.030000
✅TP6 @ 0.033000
✅TP7 @ 0.0003900
Check the Links in Description and If you LIKE this analysis, Please support our page and Ideas by hitting the LIKE 👍 button. ❤️ Your Support is really appreciated! ❤️
Traders, if you have your own opinion about it, please write your own in the comment box. We will be glad for this.
Feel free to request any pair/instrument analysis or ask any questions in the comment section below.
We will have more FREE forecasts in TradingView soon
Have a Profitable Day

FXS/BTCFXS/BTC has gaining speed , and bullish momentum . Supported by a rising Uptrend, Bullish Divergence and price pattern.

FXSBTC: breaking resistance"What Is the Frax Protocol (FRAX)?
The Frax Protocol is the first fractional-algorithmic stablecoin system. Frax is open-source, permissionless, and entirely on-chain – currently implemented on Ethereum (with possible cross chain implementations in the future). The end goal of the Frax protocol is to provide a highly scalable, decentralized, algorithmic money in place of fixed-supply digital assets like BTC. The protocol incorporates the following concepts:
Fractional-Algorithmic – Frax is a unique stablecoin with parts of its supply backed by collateral and parts of the supply algorithmic. The ratio of collateralized and algorithmic depends on the market's pricing of the FRAX stablecoin. If FRAX is trading at above $1, the protocol decreases the collateral ratio. If FRAX is trading at under $1, the protocol increases the collateral ratio.
Decentralized & Governance-minimized – Community governed and emphasizing a highly autonomous, algorithmic approach with no active management.
Fully on-chain oracles – Frax v1 uses Uniswap (ETH, USDT, USDC time-weighted average prices) and Chainlink (USD price) oracles.
Two Tokens – FRAX is the stablecoin targeting a tight band around $1/coin. Frax Shares (FXS) is the governance token which accrues fees, seigniorage revenue, and excess collateral value.
Before Frax, stablecoins were divided into three different categories: fiat collateralized, overcollateralized with cryptocurrency, and algorithmic with no collateral. Frax is the first kind of decentralized stablecoin to classify itself as fractional-algorithmic ushering in the 4th and most unique category.
How Many FRAX and FXS Coins Are There in Circulation?
The supply of the FRAX stablecoin is dynamic and always changing to keep the price at $1 due to its fractional-algorithmic monetary policy. The supply of the Frax Shares (FXS) tokens are hard capped to 100 million tokens at genesis with no inflation schedule in the protocol. The FXS token is the governance token which accrues all value of new minted FRAX, fees, and excess collateral. FXS is an investment and governance asset while FRAX is the currency token.
What Makes Frax Unique?
The Frax Protocol is a community driven and unique design stablecoin. Over 60% of the supply of FXS is issued over a number of years to liquidity providers and yield farmers. It is an entirely decentralized protocol with governance onchain. It is also the first and only stablecoin to incorporate the fractional-algorithmic hybrid design at the time of its launch in November 2020.
Who Are the Founders of the Frax Protocol?
The Frax Protocol is the brainchild of American software developer Sam Kazemian who came up with the first idea of a fractional-algorithmic stablecoin in 2019.
The founding team of Frax engineers includes Travis Moore and Jason Huan. Sam Kazemian originally devised the idea when he noticed that stablecoins were growing rapidly but none had any mixture of algorithmic monetary policy and collateralization. Projects that had purely algorithmic monetary policy had failed or shut down without any significant traction. Frax was designed as an answer to measure the market’s confidence in a partly algorithmic and partly collateralized stablecoin.
Where Can I Buy or Obtain FRAX and FXS?
FRAX, the stablecoin, is available on many major exchanges and DeFi platforms like Uniswap and DEXes. The Frax Shares (FXS) tokens are also available and as liquid as the stablecoin. Investors looking to purchase upside and governance rights to the world’s first fractional-algorithmic stablecoin should buy Frax Shares (FXS). Users who want stability by using the world’s only fractional-algorithmic stablecoin should purchase FRAX." source cmc

Frax Share (FXS) 35% Higher With More Coming...Here you have another update for FXSBTC (Frax Share), this one moved straight up.
After breaking above EMA50, resistance was found at EMA100 (0.00000958), the blue line on the chart.
We can see FXSBTC being really strong as this resistance is about to be challenged again...
As soon as this level is conquered, prices breaking and closing above it, we can expect strong growth.
Any trading below this level would signal consolidation before the next move.
Previous chart 1-July
Thanks a lot for reading.
Namaste.

Frax Share (FXS) Gigant Falling Wedge Breaking (880% Mapped)Frax Share (FXSBTC) hit a new All-Time Low recently and is now starting to change course.
Just four days ago we had a 'volume breakout' and we are seeing prices grow above EMA10/EMA21 with bullish indicators.
MACD above zero and the RSI above 50.
This is a strong chart setup and additional grow is possible.
On a trading perspective; we are strongly bullish above EMA10/21 and also above the last low 447 satoshis.
Any trading above this levels and we aim higher.
If prices move and close below 447, we can see more bleeding before the jump.
Right now... We aim higher.
I've mapped over 800% potential on this chart.
This is not financial advice.
Namaste.

FXSBTC - Long - Potential 9.89%FXSBTC - Long - Potential 9.89%
Exchanges: Binance
Signal Type: Regular (Long)
Entry Zone:
0.0000689 - 0.0000716
Take-Profit Targets:
1) 0.0000741
2) 0.0000788
Stop Targets:
1) 0.0000657
Trailing Configuration:
Entry: Percentage (0.0%)
Entry Triggers: Bullflag Breakout, Market Sentiment, Bullish Future Pivot


Frax Share FXSBTC going long“FXS before you Go Go!” Yep… this $70M Market Cap coin of 100M max supply, is about to breakout from a 50D EMA. If it successfully breaks out it could have a 100% potential gain from 1300 sats to 2600 sats.
While there’s nothing impossible in them world of Crypto as a fundamental news could drive FXS north instantly, this trade could take longer than normal to materialize as FXS needs first to breakout, retest then head north.
But what do you think?
Expect The Price Breakout From The Trend Line Soon❕ By Elliot View ABC Correction Completed And Strong PRZ Zone Formed At 800 ,And By Classical View The Main Pattern Is Falling Wedge ,We Expect The Price Breakout From The Trend Line Soon
🔴 Stop loss zone : 900 ~ 880

