Frax Share 1,104% Target Explained · Scam Wick & MoreFrax Share is starting to recover with strong bullish momentum. The low for this pair was set 3-February with what many people call a "scam wick." Higher lows since. A higher low in March then again in April and June. Only a few pairs completed their lows in February and this is good.
The scam wick
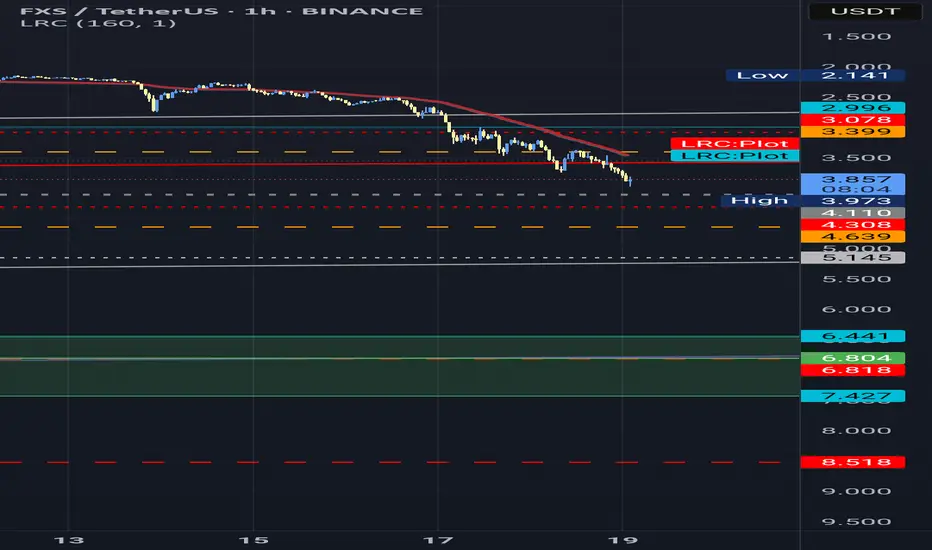
Related pairs

Bumpy road to 13$ (4$ - 5$ - 6$ - 7$)According to the information available about #fxs and, market's overall situation which experienced knows about; the real worth for FXS is higher than these prices.
The value increase for FXS will happen one way or another; but, the real question is... if it will be able to hold on to that price
Nothing lasts forever, Not even this IdeaI would short now, but I'd also put my Stop-loss close, and my TP open, and shift my Stop-loss gradually. this position is risky, but hey no trade is too expensive when you are learning constantly, and acting accordingly.

FXS/USDT – Long-Term Accumulation Base Ready for Takeoff🧠 Overview:
Frax Share (FXS) has been consolidating in a long-term accumulation phase, forming a strong base in the $1.24 – $2.54 zone for over a year. This prolonged sideways movement suggests institutional accumulation and a potential macro reversal, especially as the price is tightening near a m

FXS TO THE WHITE LINEWe were in and booked partial earlier , now again entered
FXSUSD Long
📦 Entry Zone: $3.0237 (Marked on chart)
🎯 TP1: $3.207
🎯 TP2: $3.487
❌ SL: $2.7760
🧠 Strategy:
✅ Use low leverage
✅ Risk only 2–5% per trade
⚠️ Stick to the plan — no chasing trades.
Discipline = Consistency 💹
TuffyCalls Team

FXSUSDT 1W AnalysisFXS ~ 1W Analysis
#FXS Buy after successfully breaking through this resistance line if you still have confidence in this coin with a short-term target of at least 20%++

FXS/USDTKey Level Zone: 2.8080 - 2.8350
HMT v8.1 detected. The setup looks promising, supported by a previous upward/downward trend with increasing volume and momentum, presenting an excellent reward-to-risk opportunity.
HMT (High Momentum Trending):
HMT is based on trend, momentum, volume, and market str

$FXS Setup Heating Up CRYPTOCAP:FXS Setup Heating Up 🔥
CRYPTO:FXSUSD is holding strong above the breakout zone near $3 after a clean retest.
As long as it stays above this support, the setup looks bullish with a potential 100% move toward $6.20.
Momentum is building, one to keep an eye on!
DYRO, NFA

#FXS/USDT#FXS
The price is moving within a descending channel on the 1-hour frame, adhering well to it, and is heading for a strong breakout and retest.
We are experiencing a rebound from the lower boundary of the descending channel, which is support at 3.70.
We are experiencing a downtrend on the RSI ind

FXSUSDT 1D#FXS is on the verge of breaking out above the neckline of the rounding bottom pattern and the descending resistance on the daily timeframe. In case of a breakout, the targets are:
🎯 $4.098
🎯 $4.934
🎯 $6.073
🎯 $7.212
⚠️ Use a tight stop-loss.

See all ideas
Summarizing what the indicators are suggesting.
Oscillators
Neutral
SellBuy
Strong sellStrong buy
Strong sellSellNeutralBuyStrong buy
Oscillators
Neutral
SellBuy
Strong sellStrong buy
Strong sellSellNeutralBuyStrong buy
Summary
Neutral
SellBuy
Strong sellStrong buy
Strong sellSellNeutralBuyStrong buy
Summary
Neutral
SellBuy
Strong sellStrong buy
Strong sellSellNeutralBuyStrong buy
Summary
Neutral
SellBuy
Strong sellStrong buy
Strong sellSellNeutralBuyStrong buy
Moving Averages
Neutral
SellBuy
Strong sellStrong buy
Strong sellSellNeutralBuyStrong buy
Moving Averages
Neutral
SellBuy
Strong sellStrong buy
Strong sellSellNeutralBuyStrong buy
Displays a symbol's price movements over previous years to identify recurring trends.
Frequently Asked Questions
The current price of FXS / TetherUS (FXS) is 3.575 USDT — it has risen 1.69% in the past 24 hours. Try placing this info into the context by checking out what coins are also gaining and losing at the moment and seeing FXS price chart.
FXS / TetherUS price has fallen by −4.51% over the last week, its month performance shows a 78.32% increase, and as for the last year, FXS / TetherUS has increased by 55.98%. See more dynamics on FXS price chart.
Keep track of coins' changes with our Crypto Coins Heatmap.
Keep track of coins' changes with our Crypto Coins Heatmap.
FXS / TetherUS (FXS) reached its highest price on Jan 12, 2022 — it amounted to 45.900 USDT. Find more insights on the FXS price chart.
See the list of crypto gainers and choose what best fits your strategy.
See the list of crypto gainers and choose what best fits your strategy.
FXS / TetherUS (FXS) reached the lowest price of 0.351 USDT on Feb 3, 2025. View more FXS / TetherUS dynamics on the price chart.
See the list of crypto losers to find unexpected opportunities.
See the list of crypto losers to find unexpected opportunities.
The safest choice when buying FXS is to go to a well-known crypto exchange. Some of the popular names are Binance, Coinbase, Kraken. But you'll have to find a reliable broker and create an account first. You can trade FXS right from TradingView charts — just choose a broker and connect to your account.
Crypto markets are famous for their volatility, so one should study all the available stats before adding crypto assets to their portfolio. Very often it's technical analysis that comes in handy. We prepared technical ratings for FXS / TetherUS (FXS): today its technical analysis shows the strong buy signal, and according to the 1 week rating FXS shows the buy signal. And you'd better dig deeper and study 1 month rating too — it's neutral. Find inspiration in FXS / TetherUS trading ideas and keep track of what's moving crypto markets with our crypto news feed.
FXS / TetherUS (FXS) is just as reliable as any other crypto asset — this corner of the world market is highly volatile. Today, for instance, FXS / TetherUS is estimated as 11.53% volatile. The only thing it means is that you must prepare and examine all available information before making a decision. And if you're not sure about FXS / TetherUS, you can find more inspiration in our curated watchlists.
You can discuss FXS / TetherUS (FXS) with other users in our public chats, Minds or in the comments to Ideas.