FXS ShortTake profit fibonacci golden ration 5.284 though horizontal support is lower than this and stoploss is at 6.055.
FXSUSDT trade ideas

FXS Short Take profit fibonacci golden ration 5.284 though horizontal support is kinda lower than this.

FXS SHORT IDEAIF the price would come up to this zone, i would look the possibility of an LTF change for a short. I have this view, because inside of this box, we have confluence. Like here will meet the price with the impulse down move's VAH area, the previous range VAL, and the most important resistance is the Golden Pocket.

FXSUSDT | IMPORTANT ZONEFXSUSDT has been trading in bullish trend.
The price has approaches to an important zone having multiple confluence of resistances.
The zone is also 0.382 fib level and 200 SMA too and previous support now acts ass resistance.
The bulls need to break above the mentioned zone and to hold rising support.
While bears will be active below break of support.
Manage your levels accordingly.

FXS/USDTI expect that the trend will turn to the upside I have entered a buy in this transaction and I expect the upside targets are clear on the chart and the Stop closes daily below the red line

FXSFXS touched the support zone now I think its time to buy, but remember that this information its just my opinion.

FXSUSDT | BUYING ZONEFXSUSDT has been in downtrend and price is making lower lows and lower highs. Now the price has approached to multiple support zone. The bulls can show some strength from here. The bullish candles formation on support will confirm the holding of support.
We are watching out the price action on support.
The bulls need to hold the support. While break below support zone will bring bears in party.
Trade your levels accordingly.


$FXS E.T.L 2306hrs anyone else expecting this to launch into orbit ??
$20 mill buyback and burn should get some momentum going till $8.289
thought id try the new feature of pasting pics on charts , good job trading view always building !!

$FXS flip $6 and flythis bubba should teleport to $11 as it flips $6 .
got a bag from a while ago so gonna let it run , H4 stoch could do with some more time to reset but if King corn decides to move this should break on through to the other side.

FXS/USD - Resistance approaches! Take care.You may be tempted to FOMO into Frax Shares, but check out this resistance, 10% left to go and it will be hit.
The last time the price was there it was rejected and pushed to form another all-time low!
Best to be cautious here and not FOMO just because you see a green candle.
Wait for a breakout at least. Bias is mildly bullish, but a break of resistance is necessary for this momentum to continue.
Like and follow if you liked my idea!


FXSUSDT Analysis - 05.05.22Entry triggers: ending diagonal,
5 waves in
Entry: market price
TP: 27.10 ( around wave 4’s termination)
SL: 29.36
There is a possibility these are rising wedges, in which-case, waves are a-e instead of 1-5, otherwise this is a rare case of an ending diagonal, cause it’s often observed as a sub-wave to wave 5.
Trade with due diligence!

💡Don't miss the great buy opportunity in FXSUSD @fraxfinance
Trading suggestion:
". There is a possibility of temporary retracement to the suggested support line (26.948).
. if so, traders can set orders based on Price Action and expect to reach short-term targets."
Technical analysis:
. FXSUSDT is in a range bound, and the beginning of an uptrend is expected.
. The price is below the 21-Day WEMA, which acts as a dynamic resistance.
. The RSI is at 61
Take Profits:
TP1= @ 29.779
TP2= @ 33.672
TP3= @ 37.507
TP4= @ 41.758
TP5= @ 43.885
SL= Break below S2
❤️ If you find this helpful and want more FREE forecasts in TradingView
. . . . . Please show your support back,
. . . . . . . . Hit the 👍 LIKE button,
. . . . . . . . . . Drop some feedback below in the comment!
❤️ Your support is very much 🙏 appreciated! ❤️
💎 Want us to help you become a better Forex / Crypto trader ?
Now, It's your turn !
Be sure to leave a comment; let us know how you see this opportunity and forecast.
Trade well, ❤️
ForecastCity English Support Team ❤️

FXSUSDTHello Crypto Lovers,
Mars Signals team wishes you high profits.
You see that the price could rise up after it touched the support line. It is expected that the price will have a reform and then moves to the resistance lines again.
Warning: This is just a suggestion and we do not guarantee profits. We advise you analyze the chart before opening any position.
Wish you luck

FXS/USD - Uptrend lost, come back at $20!See chart.
Yellow area is a potential buy zone, but even so, exercise patience as this bear market is still searching a bottom.


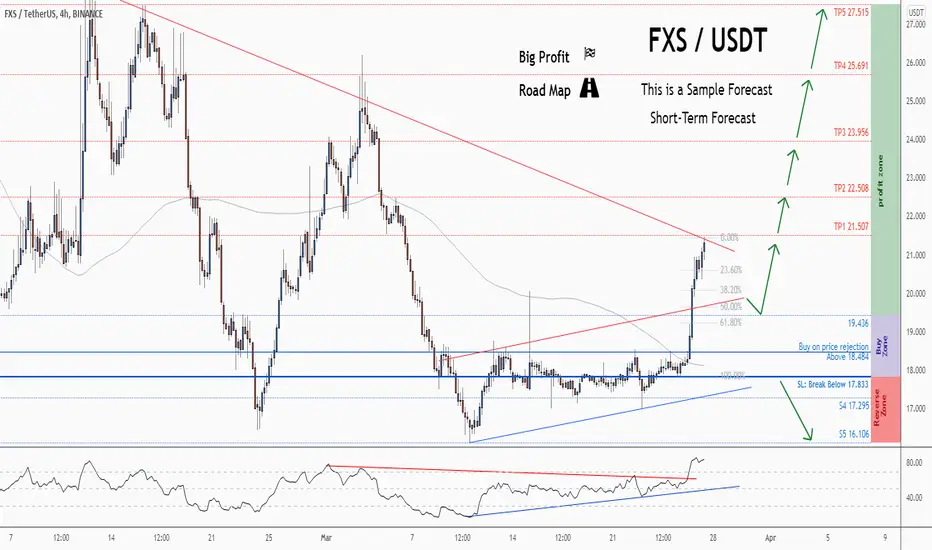
💡Don't miss the great buy opportunity in FXSUSD @fraxfinance
Trading suggestion:
". There is a possibility of temporary retracement to the suggested support line (19.436).
. if so, traders can set orders based on Price Action and expect to reach short-term targets."
Technical analysis:
. FXSUSD is in an uptrend, and the continuation of the uptrend is expected.
. The price is above the 21-Day WEMA, which acts as a dynamic support.
. The RSI is at 83
Take Profits:
TP1= @ 21.507
TP2= @ 22.508
TP3= @ 23.956
TP4= @ 25.691
TP5= @ 27.515
SL= Break below S2
❤️ If you find this helpful and want more FREE forecasts in TradingView
. . . . . Please show your support back,
. . . . . . . . Hit the 👍 LIKE button,
. . . . . . . . . . Drop some feedback below in the comment!
❤️ Your support is very much 🙏 appreciated! ❤️
💎 Want us to help you become a better Forex / Crypto trader ?
Now, It's your turn !
Be sure to leave a comment; let us know how you see this opportunity and forecast.
Trade well, ❤️
ForecastCity English Support Team ❤️
💡Don't miss the great buy opportunity in FXSUSD @fraxfinance
Trading suggestion:
". There is a possibility of temporary retracement to the suggested support line (19.436).
. if so, traders can set orders based on Price Action and expect to reach short-term targets."
Technical analysis:
. FXSUSD is in an uptrend, and the continuation of the uptrend is expected.
. The price is above the 21-Day WEMA, which acts as a dynamic support.
. The RSI is at 84
Take Profits:
TP1= @ 21.507
TP2= @ 22.508
TP3= @ 23.956
TP4= @ 25.691
TP5= @ 27.515
SL= Break below S2
❤️ If you find this helpful and want more FREE forecasts in TradingView
. . . . . Please show your support back,
. . . . . . . . Hit the 👍 LIKE button,
. . . . . . . . . . Drop some feedback below in the comment!
❤️ Your support is very much 🙏 appreciated! ❤️
💎 Want us to help you become a better Forex / Crypto trader ?
Now, It's your turn !
Be sure to leave a comment; let us know how you see this opportunity and forecast.
Trade well, ❤️
ForecastCity English Support Team ❤️

THIS IS FXSThis is not my exact entry, but what im pointer is if it will create a divegence and the fact that it it at its lowest price there should be a good bounce,
