#GALA\USDT#GALA
The price is moving in a bearish channel pattern on a 4-hour frame, which it adheres to perfectly. We have a major support area at the 0.03800 level.
We have a tendency to hold above moving average 100.
We have a downtrend on the RSI indicator that supports the rise and is about to break higher
Entry price is 0.04100
The first target is 0.04990
The second goal is 0.05600
The third goal is 0.06400
GALAUSDT.P trade ideas

Is the BOTTOM IN for GALA?Keep your eye on this gem. I would NOT be surprised to
see GALA retest the .786 FIB @ around .025 cents. Not financial
advice and I'm certainly not looking into a crystal ball. I believe
BTC dominance will top out at around 60%...(currently 56%) so...
as BTC dominance continues to ride up...look for ALTS to slowly
bleed out over the next month or two. Like I said...this is not
written in stone and we may have already bottomed here at the
.618 FIB. Good luck and Happy Trading! Booooooya!

Descending Triangle A descending triangle is a bearish chart pattern used in technical analysis to predict a potential downward price movement. It's formed by drawing two converging trend lines:
1. A descending resistance line (upper line)
2. A horizontal or slightly sloping support line (lower line)
The pattern appears as a triangle, with the price action contracting and consolidating between the two lines. Here are some key characteristics:
1. The upper line connects a series of lower highs
2. The lower line connects a series of equal lows or slightly lower lows
3. The price action is contained within the triangle
A descending triangle can be a powerful signal, but it's essential to combine it with other forms of analysis and risk management techniques to ensure a well-informed trading decision.

Weekly bullish top bands for Gala at 0.7777$ (0.4550 current)This should get a trade with a nice profit cushion to withstand any volatility which might follow. Perhaps a good investment opportunity in the cards. No guarantees play safe!

GALA Could Test 0.06 againGALA Could Test 0.06 again
The price broke out from a small bullish channel.
Immediate resistance will be found near 0.05100.
If the price manages to move above this area then we may see GALA rising for the second
target found near 0.055 and 0.060
You may find more details in the chart!
Thank you and Good Luck!
❤️PS: Please support with a like or comment if you find this analysis useful for your trading day❤️

📉📈 GALA Trade Analysis 🔄💼Trade Overview:
GALA has consistently rebounded off the support level depicted in the chart over the past month, presenting a potentially favorable opportunity for a long trade as it tests this support zone once again.
Trade Strategy:
Entry: Consider entering a trade at $0.03930, taking advantage of the proven strength of the support zone.
Take Profit: Set take profit targets at $0.05 - $0.054, aiming for gains within this range, and identify the next area of resistance at $0.065 - $0.07.
📊🔍 Monitor GALA's price movement for trade execution and adjustments! #GALATrading #CryptoAnalysis 🌐🔒

GALAUSDT-1WWaiting for collision to trend line and wait to see reaction and then we will decide too buy or not...so we wait for now until the assignment is clear...GOOD LUCK traders

GALA/USDT exciting opportunity bullish horizon?👀🚀GALA Analysis💎 Paradisers, gear up for a promising trading opportunity with #GALAUSDT. There's a strong potential for a bullish reversal from the key support at $0.03557. If it maintains its momentum at this level, there's a significant chance it could initiate a bullish push, aiming to breach resistance and target our designated strong resistance area.
💎 Should INDEX:GALA fail to rebound from the $0.03557 support and instead break below it, this could indicate a continued downward trend, with the next critical demand zone at $0.03317. Notably, this level has already seen significant upward movements twice due to its robust liquidity.
💎 If #GALA reaches this demand zone again, it is crucial for the price to secure a rebound from this level to maintain support. A failure to rebound could escalate bearish momentum, exacerbate negative market sentiment, and possibly lead to further declines in price.
MyCryptoParadise
iFeel the success🌴

GalaUsdtThe Gala is going to turn to up trend. I expect it will go to the place shown on the Chart C. And then, will see at that time it could be extended to wave 5. The stop loss is if it closed two candles below $0.025 for a 4-hour frame.

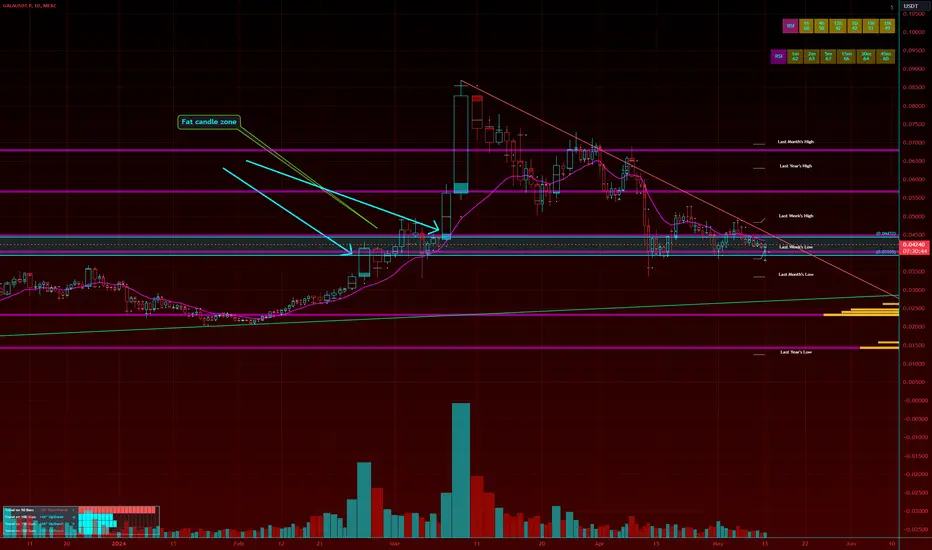
We are in the Fat Candle Support zoneUsing the new volume candles from TradingView which are absolutely amazing. We can state some simple facts.
We are currently in a zone where previously, fat candles have formed at this zone.
I am expecting another fat candle, hopefully to the upside out of this zone.
HOWEVER! I will play to the downside as well. This is a tightening range, and a breakout is coming, but it could very well be to the downside. Use stops! we've seen several breakouts fail recently as well, so move those stops up and lock in profit if you can when we get a move.
#GALA/USDT #GALA
We have a bearish channel pattern on a 1-hour frame, the price moves within it and adheres to its limits well, and it is about to break upwards.
We have a green support area at 0.0450
We have a tendency to stabilize above moving average 100
We have a downtrend on the RSI indicator that supports the price higher
Entry price is 0.4600
The first target is 0.04800
The second goal is 0.05070
The third goal is 0.05320

Hourly Support Fueling up nowWith many other alts already breaking out of their lower time frame supports 10-30%, a laggard has been spotted.


GALA ANALYSIS🔮 #GALA Analysis
💲💲 #GALA is trading in a Descending Triangle Pattern. If the price of #GALA breaks and sustain the higher price then will see a pump of around $0.07450 expecting almost 70-75% in coming weeks📈
⁉️ What to do?
- We have marked crucial levels in the chart . We can trade according to the chart and make some profits. 🚀
#GALA #Cryptocurrency #Support #Resistance #DYOR

GALA updatedPossible double bottom playing out in the coming few weeks.
I don't believe we are in FULL BLOWN ALTCOIN season as of yet.
BTC dominance is still to high. Watch for this formation on GALA
If it plays out like a think it will...THAT IS WHERE YOU GO APE shit
on GALA when price hits roughly .33 cents. I've seen these double
bottom patterns play out just before ATLCOIN SEASON is set to explode.
!!!PAY ATTENTION!!!...oh and...Happy Trading!

GALA Short Positron Playing Out NowYou should be able to find entry and it could get back up close to entry.... Either way this is my plan and it a great risk to reward. Used multi time frames to determine possible take profits at the blue lines but I believe in a day or two this will complete. It hit a big supply zone and needs to find demand. Like always just my idea based on what I am seeing on the charts, I have been in this trade since much earlier but there is still plenty if room for profits. Just use your strategy to find a good entry point. This is not necessarily a reversal just a pullback so take profits...
This is not financial advise just a trade I see as being very profitable as is already. Patience is key This is rushed so my apologies.


GALA coin analysisGala coin has breakout previous valid high and turned into bullish trend after CHoCH. But it is forming trendline liquidity as shown on the chart. Thats why I will long below that liquidity zone which is aslo a sell side liquidity. I am expecting price to come below that poi after toiucing its supply zone. This is my analysis on 1H time frame. What are your thoughts?

GALAUSDT: Bullish TrendGALAUSDT.P is trading in symmetrical triangle pattern and recently forming Bullish Divergence on 1hr time frame. so we will wait for the breakout of the pattern and previous LH for the confirmation of the bullish trend.

Watch GALA to hit this lineThis is a line of confluence. BTC will probably come back down
eventually to retest 51k. Watch GALA to possible hit this line and
bounce. This is on the WEEKLY time frame so this could take 2-3
months to play out. That's where you go LONG on GALA. Not a
bad area right now to DCA into this game token while things are
gonna get somewhat boring. Good luck and happy trading

GALAUSDT 1D analysis.Hello, friends!
This is ESS team.
LOOK this chart that we expect some.
After a BIG rise, GALA is making a berish extended wave.
The BLUE 5D uptrend line is where GALA needs to be supported in order to rise.
If this trend line is supported, and rise up,
and then, If the upper end of the extended wave is also retested after the breaking upward,
the GALA will fly once again.
Unfortunately, If the blue uptrend line is retested after breaking through due to the strong sell-power, it could drop to the bottom of the extended wave.

$GALA Trading IdeaGALA/USD has formed a potential descending channel on the 12H-1D timeframes. There's a strong chance we could rise from the bottom and retest the local resistance at $0.05274.
If it breaks out of this channel to the upside, my potential targets would be around $0.068 to $0.086. Keep an eye on this setup.

GALAUSDT 1D#GALA is moving inside a descending channel on the daily chart. It has bounced from the middle line of the channel and MA100. You can buy it on its support levels and wait for the targets.
Supports are:
$0.04400
$0.04034
$0.03455
Targets are:
$0.05231
$0.05811
$0.06390
$0.07216
$0.08268
