GALA/USDT Market Analysis - Waiting for Market Correction for BIn recent days, the GALA/USDT market has demonstrated a significant buying force, indicating strong investor interest in this trading pair. This surge in activity suggests a heightened confidence in the GALA cryptocurrency.
However, it's crucial to recognize the importance of timing when entering the market to maximize potential gains. Currently, it appears advisable to refrain from initiating positions during these periods of buying strength. Caution suggests waiting for a market correction before considering new buying opportunities.
Exercising patience for a market downturn can present substantial advantages. Buying opportunities often arise when the market corrects after a bullish phase, allowing investors to acquire assets at more attractive prices.
In summary, while the recent buying strength is encouraging, adopting a wait-and-see approach could prove strategic. Waiting for a market correction before taking positions may yield more favorable buying opportunities in the long run.
It's always recommended to closely monitor market developments, consider both technical and fundamental analyses, and review historical trends for well-informed decision-making. Cryptocurrency markets are known for their volatility, and a cautious approach can help mitigate potential risks.
GALAUSDT.P trade ideas

GALA showing good investment opportunityHi Everyone;
today we have a good reward Investment opportunity
it is more than 51 times the risk and the chart is look very promising.


$GALA3x Long Position
1HR:
Bullish trend strength: 35
MA7 > MA25 > MA99
MA50 > MA100 > MA200
Supertrend is long
Price > MA7
Price > MA50
Price > Tenkan Sen
Price > Kijun Sen > Kumo
Kijun Sen acting as support
MACD > 0
4HR:
Bullish trend strength: 30
MA7 > MA25 > MA99
MA50 > MA100 > MA200
Supertrend is long
Price > MA50
Price > Tenkan Sen
Price > Kijun Sen > Kumo
Chikou Span > Price
1D:
Bullish trend strength: 15
ADX > 25
Supertrend is long
Chikou Span > Price
MACD > 0

GALA Exiting Parallel Channel Gala was trapped in a parallel channel from last two year and now is time for exit.
I bough few in advance and will add more once is closes above the channel and look for targets as per chart
Middle of channel is also a support if it plans to come back.
previous supports in dotted lines are my planned target for coming months.

GALA-USDT | 15M | TECHNICAL ANALYSISHello traders, BINANCE:GALAUSDT I have determined the formation target on the chart. I wish everyone success.
Like and comment if you find value in our analysis.
Feel free to post your ideas and questions at the comments section.
Good luck

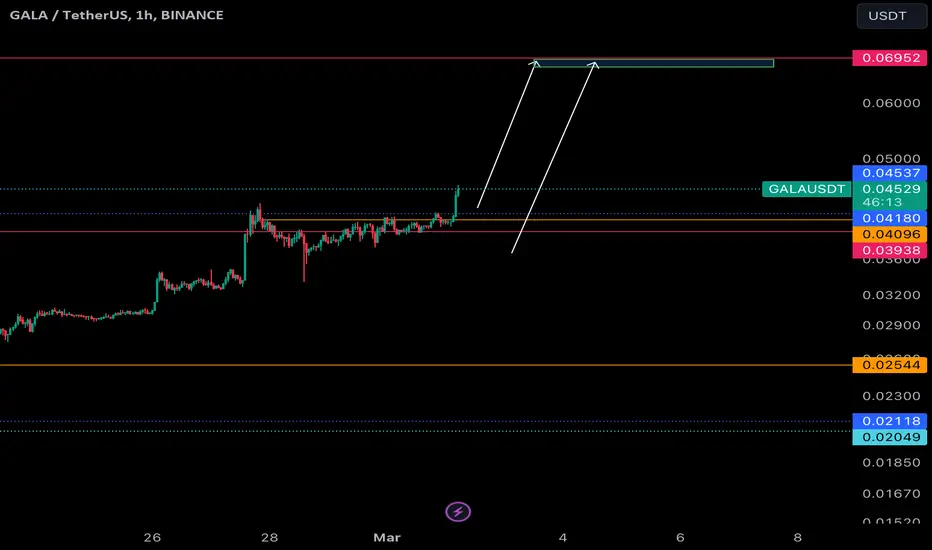
Very Bullish Hello my friends, an analysis for the long term and for the holders on Gala currency.
As I specified in the daily chart, there an attractive target around 0.069$ for this currency, it was assumed that the price will be reached in the future.
Do not forget that this is my personal analysis and you should act according to your trading strategy and plan.
My method has no loss limit and you can visit the rest of my analysis for accuracy.
You can send a message to analyze the currency you want.
Good luck
gala monthly formationGala, this is a long-term chart, the movements will be accordingly, the falling wedge coming from the left has broken, it normally comes to rtest, 30.75 can be withdrawn, then the rise continues, the first stop is 0.073, the next stop is 0.166
But this is a monthly chart, these movements do not happen overnight, each candle represents a month, it takes time.

GALA/USDT Bracing for a Bullish Reversal from Key Support?💎 Paradisers, prepare for an exciting turn in #GALAUSDT, as it's on the brink of a bullish leap from a pivotal support area.
💎 Diving into #GALA's recent actions, we're seeing signs of a potential bullish shift right after facing a hurdle at $0.03669. Now, with #GALA hovering around the strong support level of $0.02081, holding firm here could trigger an energetic bullish wave.
💎 Eager to seize every opportunity? If #GALA dips below $0.02081, we're looking to bounce back from an even lower support at $0.01690. Dropping further could lead us to rethink our bullish expectations.

GALAUSDTThe signal was much earlier. As a result of the signal, the price rose by 120% and then corrected. But the targets remained, all targets based on Fibonacci levels. Long-term signal, purchases only on SPOT

GALA Bullish GALA walking in to the rising wedge.
I will buy on the spot and wait to the moon.
At the moment there is a bearish divergence on the weekly timeframe.
Now I expecting small pullback to the support zone and after that I think will bounce back up.

GALA/USDT It required GALA break out this area or continue down!💎 GALA's recent market trends have been particularly dynamic. Presently, GALA is exhibiting a rebound from the demand zone, navigating its way back toward a key resistance level that it previously breached.
💎 For GALA to sustain its upward momentum, it is critical for it to break through this resistance barrier. Achieving this breakout could see GALA advancing toward the projected strong resistance area, signifying a bullish progression.
💎 Conversely, if GALA struggles to overcome this resistance level or fails to reclaim its position above it, the likelihood of it reverting to the demand zone increases. In this scenario, GALA may need to gather additional momentum for another attempt at an upward trajectory.
💎 The demand zone's significance cannot be overstated in this context. Should GALA fail to hold its ground in this zone, or if it breaks below it, a bearish shift in the market trend may be triggered. Under these circumstances, GALA's path could lead to a further descent, targeting the next critical support area.

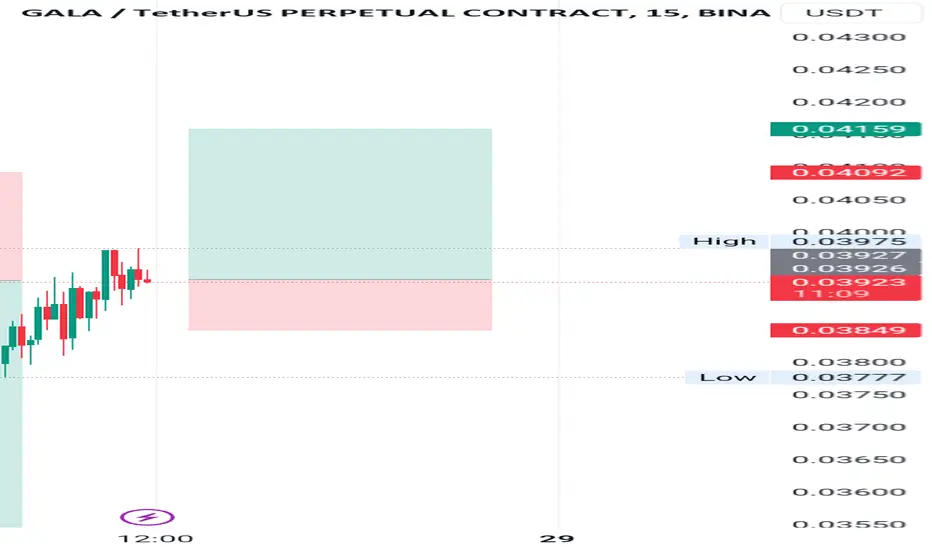
🎮💹 GALA Trading Strategy - Spot Trades and Laddering! 🚀📊🔍 Strategy Overview:
Condition: Price bounced from the $0.035 - $0.0385 support area.
Entry Criteria: Ladder into the trade within the support zone.
Targets: Aim for the next resistance levels at $0.043 - $0.045 or $0.049 - $0.051.
Risk Management: Set stop-loss just below $0.035.
📢 Analysis: Considering BTC's overbought conditions, a cautious approach with spot trades and laddering can help manage risks effectively. Stay vigilant and adapt to market dynamics. 🌐🚀 #GALA #CryptoTrading #RiskManagement 💰📈

GALA BUY SETUPHi Everyone!
MINA Analyze ( GALAUSDT), 15-minute time frame ⏰
if GALA is able to breakout resistance, then the next target is 0.04250,
Goodluck Guys!
*Follow For More!
*DYOR

How long does the bull market last?📊 According to the buying pressure in the market and the upward movement of the price, if the range of 0.0430 units is broken and the price stabilizes above it, the price may increase to the range of 0.0550🎯 , and in the case of the strength of the range of 0.0850 🎯🎯units.
📊 Otherwise, the price may fall to the range of 0.0300 units.

galausdtThis analysis provides a good position for a sell trade and given the downtrend of the bitcoin trend in the medium term.

GALA head & shoulder patternOn the 15-minute time frame, Gala is exhibiting a formation of a head and shoulders pattern. Additionally, on the 1-hour time frame, it is consolidating and displaying signs of weakness due to its significant rally. Therefore, I anticipate a correction.

GALA where is it heading to🤔?Gala is currently undergoing a reversal after forming a head and shoulders pattern. It is possible that this could be a retracement or a trap to entice traders to go long, only to ultimately decline. Nonetheless, I am maintaining a long position on Gala due to a favorable risk-reward ratio.
GALAUSDTGala looks pretty decent. The weekly graph looks really good.
Gala has a huge potential and ready to explode.
Targets are shown on the graph.
NFA.

GALA to 40$As Elliott wave I hope it is right for MEXC:GALAUSDT , we are now at the start of wave 3
I think we gonna this through this bull run

GALAUSDT CUP HANDLE??!
As seen in the chart, the cup formation appears. I expect an increase in the direction I specified as long as the market allows it.
note to myself!


Congrats Gala Holders 🚀As I tell you congratulations to those who bought the Gala.
All Targets hit in a short time frame 🎯
