GALAUSDTHello again,
Mars Signals team wishes you high profits.
This is a one-day-time frame analysis for GALAUSDT
Clearly, R2 is a resistance area in the current chart with its presentation of the disability of the price to rise at several points. R1 used to be a long-term support area. S1 used to be a resistance line. And S2 is a support area at the bottom that contains the support of price at different points. According to the past behavior of price, it could have a noticeable rise after being in a fluctuation at its lowest amount and by reaching R2, it face another rejection down to S2. Then by receiving the support there, the price was capable of having a great rise and could break S1 upward. At the present, the price has a fluctuation below R1 and we predict it to experience more rise up to R1 and after a pull back, another increase is waiting for it toward R2. We must wait for some confirmation candles to rise and an increase would be there for the price to reach higher amounts. It is even possible that the price loses the support at any points or even falls below S1 and via giving us some falling signs, more decline will definitely be waiting for the price toward lower amounts. S2 is believed a perfect point for putting trade orders but we should wait for the price to move toward it and then in our future updates, we will provide specific details for you. It is highly recommended to be cautious about various points and details and remember that for enjoying less risky trades. You can obtain every piece of information and details through our analyses and updates.
Warning: This is just a suggestion and we do not guarantee profits. We advise you to analyze the chart before opening any positions.
Wish you luck
GALAUSDT.P trade ideas

GALAUSDTThe market is predicted to have a positive outlook, with an expectation of over-performing movements that will conclude the micro-cycles and offer another opportunity to enter the market at the top. The important levels in the market can be identified by golden lines, which indicate support and resistance.

Gala Bull Cycle quarterlyThe outlook is bullish, with overshooting B waves to complete the uptrend micro-cycles and for another entry point to top it off.
All golden lines are support and resistance.

GALA USDT#GALA/USDT
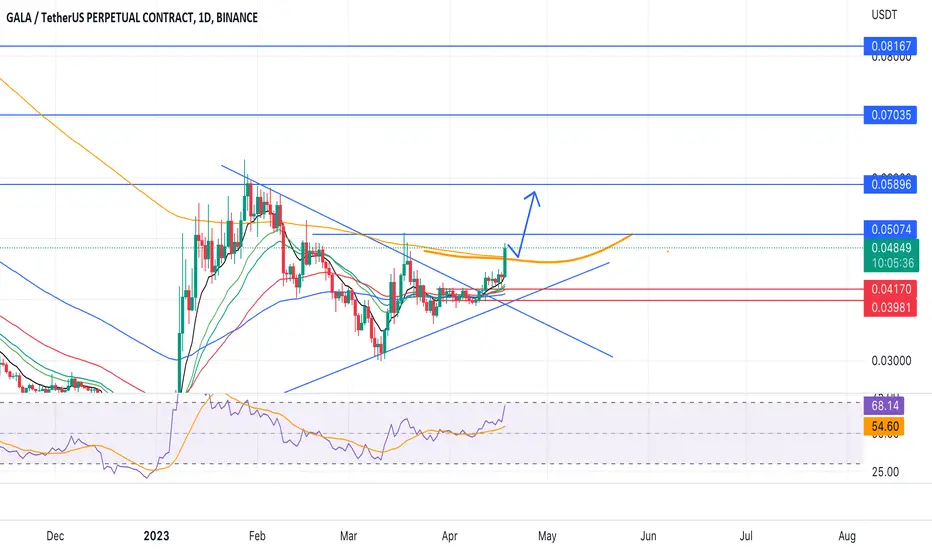
When closing a daily candle above the 200 moving average and on a retest, you can open a Long position
Nearest resistance level: 0.05074
When broken through, the road opens higher.
Indicated on the chart
Galausdt Buy opportunityGALAUSDT completed 5 wave legs from its ATH of $0.8412 and has undergone a significant correction after reaching its ATH, but the price reached an important bottom at $0.0154, which could be the end of the correction and the beginning of a new uptrend.
The price responded well to the bottom, showing an immediate bounce. This bounce crossed above the trendline that determines the trend, signaling a potential reversal.
As shown on the chart, the price is currently accumulating above the trendline in the form of bullish flag, which is potential bullish continuation pattern. We recommend accumulating GALAUSDT from this zone given on the chart, which has historically acted as support and resistance in the past.
We recommend placing a stop loss below the trendline to limit potential losses in case of a sudden drop in price. The stop loss level is also shown on the chart for reference.
Our targets for GALAUSDT are shown on the chart, we should use proper risk management and evaluate the market conditions before making any trading decisions.
Thank you for reading, and we appreciate your engagement on this post.
Please note that this analysis is not financial advice, and you should always perform your own research and risk assessment before entering any trade.

GALAUSDT Good Buy!GALAUSDT Technical analaysis update
Buy zone : Below $0.046
Stop loss : $0.0435
Take Profit 1 : $0.0484
Take Profit 2 : $0.0527
Take Profit 3 : $0.0575
Take Profit 4 : $0.0630
Thanks
Hexa

GALA moving - broke out of descending channel GALA
Market Cap: 319.4M
Category: Metaverse / Play to Earn
Target 1: 0.05456
Target 2: 0.06108
Target 3: 0.06812
Stop Loss: 0.03694
Manage Risk - have a stop loss in place
Not Financial Advice
This is for Entertainment Only

GALAUSDT | Support & Resistance - Sell Stop & Buy StopGALAUSDTis showing sideways movement so we have drawn support and resistance levels to take buy-stop and sell-stop trades along with the stop losses.

GALA longGALA bounced off the lower boundary of ascending channel. Bullish movement to resistance level at 0.0446 is possible.

GALA USDT TRADING PLAN 2023there are my analysis for gala usdt price chart with the urgent levels of resistance.
hope u like it

GALA, a breakout like no other... soon.GALA, is now undergoing a big shift both in daily and weekly chart -- creating higher lows with significant volume.
Expect some big jump from hereon... It has poke out the initial pennant flag formation everyone is waiting for.
SEEDED L at 0.041
TAYOR.


Gala chartthe price action is forming into a perfect position with the potential game launch of their big title game Mirandus.

Gala Another Breakout Galusdt
Descending Channel breakout & Successful retest already confirmed as expected
Formed symmetrical triangle pattern on daily time-frame incase of another succesful breakout expecting 60-100% Bullish move incoming days
Wait for confirmation, risk under your control and always do your own research

GALA building pressure GALA looks like it will pop soon. Seems to be building pressure. Banging its head on the 50 fib, running into the end of wedge between uptrend and downtrend, RSI is near the middle, MA's are mostly underneath price for support.

Risky LONG $GALAHere we go with another risky long
waiting for a little alt-season if BTC holds 30.000 all the weekend.

✅TS ❕ GALAUSD: broke up the range✅✅ GALA maintains an ascending structure.
The chart has broken through the upward range.
We believe that the asset will continue to grow. ✅
🚀 BUY scenario: long to 0.04912 🚀
----------------------------------------------------------------------------
Remember, there is no place for luck in trading - only strategy!
Thanks for the likes and comments.

#GALAUSDT #LQR #TOBTC #LaqiraProtocol The support and resistances in the chart are specified,
the Levels are obtained from the confluence of fibo and static surfaces,
after confirmation you can open a trade
this analysis is not a buy or sell offer


GALA ANALYSIS (1D)Hi, dear traders. how are you ? Today we have a viewpoint to SELL/SHORT the GALA symbol.
For risk management, please don't forget stop loss and capital management
When we reach the first target, save some profit and then change the stop to entry
Comment if you have any questions
Thank You

Galausdt Double Breakout Galausdt
Galausdt has been showing a symmetrical triangle pattern on the 4-hour time-frame, and the breakout of this pattern has been confirmed. This breakout can be seen as a bullish signal, indicating that the price may continue to rise in the short term.
Moreover, there is another symmetrical pattern forming on a higher time-frame, which may be indicative of a potential bullish move. If this pattern also breaks out, it could potentially trigger a 30-50% increase in the price of Galausdt.
However, as with any trading idea, there are no guarantees, and it's important to keep an eye on the price action and volume before making any trading decisions. It's also important to have a clear plan for risk management in case the market moves against the expected direction.

Re-Publish GALA Breaking outthis is the 2 day and published it a while back sort of an Adam and Eve pattern breakout , but look for at least a touch of top side of Gaussian Channel.
Watch the 5Day as this will lead into it,
Look at both 200 Averages over head, must likely pull back from there if hit, but looking really strong for the next few bar closes in the 2 day

