Home Work #3, 4 Part 2The task was to polish the skill of charting trend channels with some of the most common patterns as double tops and bottoms, cup and handle , bear and bullish flags.
GALAUSDT.P trade ideas

Gala Games ($GALA) - break the trendGala needs to break this trend.
You don't want to see green again if you're bullish, must hold the 100ema and flip red.
Then game on.
Vatsik

GALAUSDT 2H HR MTGALA was able to start climbing after a long fall
The first bullish wave and correction to the 0.5 Fibonacci area
Eat 2 with an upward trend

GALAUSDTA bullish butterfly pattern can be seen in GALAUSDT 1H TF. We have taken a long entry at the current price. TPs and SL are defined.
Cheers.

where the best longs for #GALA #CRYPTO shorts tooBest way to save my own levels and ideas lets see if anyone can use it inside the object tree go for all my save lines and fibs for #GALA #BTC #ETH #ETC

#TOBTC #LQR #GALAUSDT Lower Time Frame GALA in Lower TIme Frame have a important Cicle level on 0.04005
and the next important minor support on 0.03870 and 0.03832

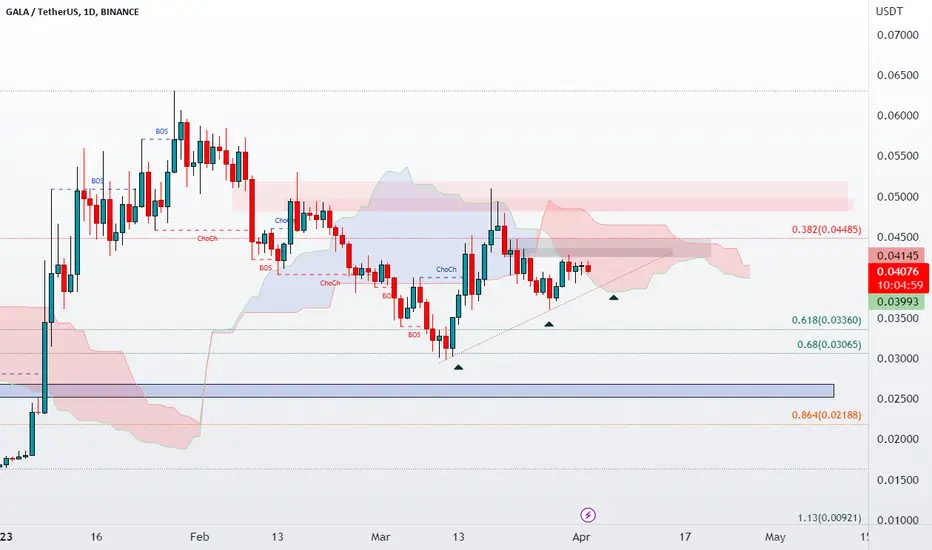
#TOBTC #LQR #GALAUSDTGala in Daily Have a Strong Resistance on the way.. which is 0.04247 - 0.04442
and a Confirm level for next impuls Ways gona be 0.382 fib level 0.04485
First important Daily Support is the next Touch on Up-Trend .

GALAUSDT 4 hourIt looks like the demand zone will hit and rise. made choch and now checked and fell down.

GALAUSDTIt looks like the demand zone will hit and rise. Choch on the big watch and now it is believed that it is making a check movement

GALAUSDT Long Plan After about %10 DeclineOKX:GALAUSDT
With a bullish price signal 0.034 level seems to try.
Details are on the graph.
May the force be with you!

Gala/usdtGALA/USDT 4H Time frame update.you can check and get idea.crypto is very risk market and dont trade high laverage.

GALA going upperThe instrument is in a downtrend, the lows are updated, the volumes are decreasing, these grounds indicate a loss of buyer's interest in pushing the price up, while the chart shows the seller's global downward dynamic pressure. Against this background, a short breakout level has been formed with several touches, after which I expect the triggering of stop orders that will give an impulse for a breakdown.

GALA/USDT LongHello guys, here is my analysis for the crypto pair GALAUSDT, its just my thought and not an ascertion
Feel free to drop your opinions too
Thanks

🔥 GALA Triangle Analysis: Moving To ResistanceIn my most recent GALA post I talked about the massive triangle that GALA is currently trading in. My expectation was that we'd go down to retest the bottom support and reversed from there.
In my view, the reversal has been started. I'm looking for a move towards the top resistance of the pattern. Ideally, we will break through that resistance area with a big green candle, but that's for later.
For now, the yellow area is our target.

GALAUSDT POSSIBLE LONG SETUPGALAUSDT is showing clear signs of a rise, for this reason im Bullish, in addition to the buying volume that has increased immensely in the last few days, we can see that it has broken out of the falling wedge and the SMA of 200 and the SMA of 20 on the daily timeframe, in addition to that it has made a bullish engulfing exactly at the bottom edge of the falling wedge.
I'll wait for confirmation and update this idea.

Gala longGala bounced off the support area. Bullish movement to resistance level at 0.049 is expected to happen.

Gala Long to $0.11402Hi guys, I am long on Gala based on the following TA
Wave 1 high of 0.05064
Wave 2 appears to be an expanded flat correction (3 down, 3 waves up exceeding the high of wave 1, followed by 5 weaves down).
Wave 3 may be in play with wave 1 being put in and the retracement of wave 2 down to the 0.618 Fib Level, we are potentially looking for a bounce here in to Wave 3 of 3.
Wave 3 price extension to 0.11402 range which coincides with the 1.618 fib area and also a weekly resistance level.
It is too early to confirm we are in Wave 3, for confirmation would wait for price to break the high of wave 1. This analysis will be invalidated price falls below 0.02993 or if we fail to break the high of wave 1.

GALAUSDTgala reacted to 0.618 fib level . now its have 2 options .
1- break above level and go up
2- break down and hit the next support

Trade entry long GALA / USDT 🙌🔥Trade entry long GALA / USDT Big Correction and Big Boom 🙌
If you like this analysis, smash the "like button" and leave a comment below to share your thoughts
or let me know what crypto you want to see!
Trading is a reflection of yourself. Learn more daily and be ready for every opportunity.
Have a nice trading!


trade entry long GALA / USDT on kucoinGALA breaking long down pattern to the upside; long term bull flag play in tact

