Gala Short to 0.02675On this fibonacci analysis it shows the bears might be heading towards the 236 fibonacci retracement down at 0.02675 area. If we find support there would be a great place to build longs.
Today there was a sell signal and I dont believe we recover before we hit some bigger support on much lower number. I wont be buying until my target gets hit or I see a convincing buy signal.
Next possible support above 2675 is 3200, which might give us a temporary bottom. I'd like to be ready with a short from higher so I can withstand that.
GALAUSDT.P trade ideas

GALA/ Whats next?good buy when it does a stophunt to the below and goes back up in seconds.
short and long prices can us see on chart.

gala shortif GAlA go bellow fib line 0 we should get nice profits $$$$ .
its only my opinion do own research. :D

GalaUsdtGALA USDT
SHORT
PRICE: 0.04106 / 0.04125
TP: 0.03978
SL: 0.04165
LV: X5
This is not a buy or sell signal and it is my personal analysis, so I have no responsibility for this currency
And your profit and loss is related to you
This is just my personal analysis
Thanks Devil.p.v

GALA USDT - Just an idea* its just an idea and not a pro advice *
I believe to Gala potential but note sure about the exact time and price, Gala can touch Fib 0.786 soon if the price do not cross from the 2H support line (Current 0.051) after the previous Pump.
If Gala pass the mentioned support and RSI break down the trend line, we could expect the Price comes to 0.0402 (Fib 0.236) and by touching the MA 200 daily, go for 0.382, 0.5 and finally 0.786 Fib.
I will appreciate you to share your opinion
BINANCE:GALAUSDT

GALA Long Position SetupGala is currently in a triangle pattern, and third push is on its way,
I am expecting for a break of down trend, and claiming all targets,
Lets see,

Gala Games, Plenty of upside potential - LongGala seems to be trading within a flag setup. At all different hourly intervals, it looks oversold. Many other fundamentals look good; Volume is even picking up a bit.
Support areas are strong and $Gala regularly makes big moves off support areas in short time periods. A look at the list of 'whales' shows little activity from them, if any, in relation to trading Gala; many received their coins when Gala was priced higher.
Consolidation has been going on for a bit after the last push above six cents. IMO, it's a steal at these prices and something to hold onto for years.
Gala Games has plenty of upside potential. They recently acquired Ember Entertainment and will begin onboarding Ember Entertainment mobile users to Web3. Ember Entertainment has several mobile games, which only add to Gala Games' already attractive portfolio. Gala plans to be the platform for web3 gaming; they understand mobile gaming is extremely important. They're making good moves, continuing to build, merge, etc.
*Important* - Cointelegraph headline - Gamers made up nearly half of all blockchain technology in January. Mobile gaming is almost $140B/year industry up $30B from last year (2022).
Gaming on web3 will be huge, who doesn't want to take in-game purchases after they're done with a game and trade or sell them?
*This is not financial advice. Added TPs and a stop loss just in case.
IF ETH & BTC drop significantly, Gala will, too.

GALA - Bounce here or fall lowerGALA broke out of its long term trendline a few weeks ago with a nice pumperino. It has still been in a nice uptrend but might fall further into a horizontal range and even further. If it continues to pump it could test the 50 SMA.

GALAUSDTGALAUSDT 1h TF
the price have moved upside and broken last lower high and created new higher high, we have to wait for new higher low and entry can be taken if the price break recent high.

I will analyze for you based on Fibonacci strategy and wave analI will analyze for you based on Fibonacci strategy and wave analysis

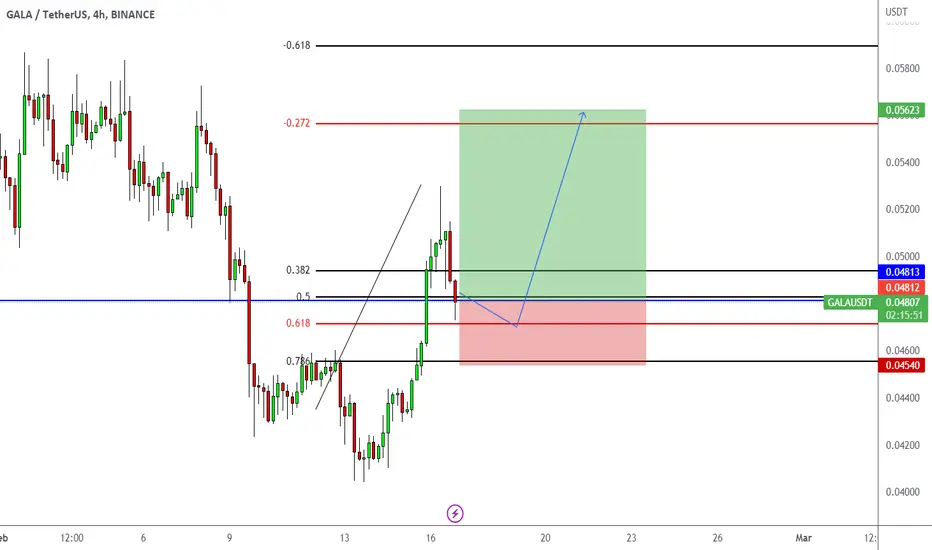
Gala short long and where?Gala just comirfed a short so is wil probable to the aupport zone (red lines) most likely it would bounce there. But take profit on time at the .618.
Ita also possible its gonna shoot like a MF.

GALA token forming bullish BAT for upto 25% pumpHi dear friends, hope you are well and welcome to the new trade setup of GALA token with US Dollar pair.
In previous trade setup, the priceline of GALA was moved slightly moved down than buying zone, however, recovered soon and pumped more than 26%.
Now this time on a daily time frame, GALA is about to complete the final leg of a bullish BAT pattern for another bullish reversal move soon.
Note: Above idea is for educational purpose only. It is advised to diversify and strictly follow the stop loss, and don't get stuck with trade


GALA Bearish TriangleThe instrument, after a recent pump, was poured into the volumes of buyers, which are now declining, thereby moving into accumulation (balance). In the trading range, the price approached its local lows, accompanied by declining loyalties. There was an approach to a downward slope, but there was no sharp reaction from the buyer during the long period, which may indicate its absence or weakness. Now the price is forming a trade in the support zone of the round number 0.46$ I expect the continuation of the local short with activity in the glass

GALAUSDT...not a surprise for sureBINANCE:GALAUSDT
it's simple
it's clear
it's easy
it's...a buy trade if we have confirmation bar above the 0% FIb chan. line
don't be a pussy...BE A MAN!
#STOP_BEING_POOR

GALA / USDT Price Prediction As You Can See In Pic inverse head and shoulders Are Showing In The 4 Hour Chart.
As You Can See The 0.618 Fibonacci Retracement Is A Special Level Gala price Level 0.05091 If The Price Breaks This Level
Then Good For Long.

GALA / USDT Price Prediction As You Can See In Pic inverse head and shoulders Are Showing In The 4 Hour Chart.
As You Can See The 0.618 Fibonacci Retracement Is A Special Level Gala price Level 0.05091 If The Price Breaks This Level
Then Good For Long.

GALAUSDT is ready for the breakout?The current price of GALAUSDT is testing a dynamic resistance level in the $0.05 area where the market also has a static daily resistance level. Additionally, the price is creating an inverse head and shoulders pattern, which is a technical chart pattern that may indicate a potential trend reversal from a downtrend to an uptrend.
An inverse head and shoulders pattern consists of three distinct troughs or valleys with the middle trough being the lowest, forming the "head," and the two outer troughs forming the "shoulders." The middle trough or the "head" is typically lower than the shoulders, and the pattern is completed when the price breaks above the "neckline," which is a trend line drawn connecting the high points between the shoulders.
If the price of GALAUSDT is able to break out from the neckline of the inverse head and shoulders pattern and the market satisfies Plancton’s rules, it may be a signal for a long position. To satisfy Plancton’s rules, a trader may have a predetermined entry price, set stop loss and take profit levels to manage risk and maximize profits, and monitor the price action for any signs of a trend reversal or invalidation of the initial analysis.
–––––
Keep in mind.
🟣 Purple structure -> Monthly structure.
🔴 Red structure -> Weekly structure.
🔵 Blue structure -> Daily structure.
🟡 Yellow structure -> 4h structure.
⚫️ black structure -> <= 1h structure.
–––––
Follow the Shrimp 🦐

GALAUSDT future for 2.5%/25% Absolute X3My recommended trades are based only on the uptrend of the market. It will be opened in the time frame of 1 hour and at the end of the day, profit trading will be closed with any amount of profit. And only losing trades will remain open until they are liquidated. This trading strategy is backtested and works only in an uptrend.

How Much Juice Left for GALA?You can clearly see a Bullish Ascending Triangle formed on the Daily chart
Price is perfectly rejecting 200 Daily EMA , and if it breaks above, ~$0.07 is a good target
If BTC consolidates/moves up, &/ there happens to be a good fundamental news for GALA , you can expect those red lines above to be hit
If BTC does a major correction/pullback, then expect this technical analysis to be invalidated
Happy Trading!
Not a Financial Advice.


Gala On verge Of Breakout Seems Like Gala Getting ready for Further Continuation
Forming Bulish flag In h4 timeframe Incase Of breakout Expecting another 45 To 50% bulish Move
