GALA Short Positron Playing Out NowYou should be able to find entry and it could get back up close to entry.... Either way this is my plan and it a great risk to reward. Used multi time frames to determine possible take profits at the blue lines but I believe in a day or two this will complete. It hit a big supply zone and needs to find demand. Like always just my idea based on what I am seeing on the charts, I have been in this trade since much earlier but there is still plenty if room for profits. Just use your strategy to find a good entry point. This is not necessarily a reversal just a pullback so take profits...
This is not financial advise just a trade I see as being very profitable as is already. Patience is key This is rushed so my apologies.
GALAUSDT trade ideas


GALA coin analysisGala coin has breakout previous valid high and turned into bullish trend after CHoCH. But it is forming trendline liquidity as shown on the chart. Thats why I will long below that liquidity zone which is aslo a sell side liquidity. I am expecting price to come below that poi after toiucing its supply zone. This is my analysis on 1H time frame. What are your thoughts?

GALAUSDT: Bullish TrendGALAUSDT.P is trading in symmetrical triangle pattern and recently forming Bullish Divergence on 1hr time frame. so we will wait for the breakout of the pattern and previous LH for the confirmation of the bullish trend.

Watch GALA to hit this lineThis is a line of confluence. BTC will probably come back down
eventually to retest 51k. Watch GALA to possible hit this line and
bounce. This is on the WEEKLY time frame so this could take 2-3
months to play out. That's where you go LONG on GALA. Not a
bad area right now to DCA into this game token while things are
gonna get somewhat boring. Good luck and happy trading

GALAUSDT 1D analysis.Hello, friends!
This is ESS team.
LOOK this chart that we expect some.
After a BIG rise, GALA is making a berish extended wave.
The BLUE 5D uptrend line is where GALA needs to be supported in order to rise.
If this trend line is supported, and rise up,
and then, If the upper end of the extended wave is also retested after the breaking upward,
the GALA will fly once again.
Unfortunately, If the blue uptrend line is retested after breaking through due to the strong sell-power, it could drop to the bottom of the extended wave.

$GALA Trading IdeaGALA/USD has formed a potential descending channel on the 12H-1D timeframes. There's a strong chance we could rise from the bottom and retest the local resistance at $0.05274.
If it breaks out of this channel to the upside, my potential targets would be around $0.068 to $0.086. Keep an eye on this setup.

GALAUSDT 1D#GALA is moving inside a descending channel on the daily chart. It has bounced from the middle line of the channel and MA100. You can buy it on its support levels and wait for the targets.
Supports are:
$0.04400
$0.04034
$0.03455
Targets are:
$0.05231
$0.05811
$0.06390
$0.07216
$0.08268

Analysis GALAIn the previous analysis we have seen a price leap again?
There was a block block in 0.053 that somewhat filled
There is no much buyer in the market right now and I expect to move towards small support of 0.039 if this support can be lost to the golden support of 0.024 and be able to buy.
If each of these two -lane is maintained, we can reach the resistance levels stretched with red
Note to put your purchases in two said support

GALAUSDTIt is a technical setup for Galausdt in a parallel channel. My long-term Bias is a long but I would wait till break out of the channel before I enter the trade

🔥 New Bullish Trend Is Just Started 👉 The Main Formation For GALA Is a ABC Corrective Pattern Which Wave C Completed At The 0.038$ Area And The Price Perfectly Bounced From This Support And Looks New Bullish Wave Is Started
📈Currently There Is a Nice Bull Flag Formed At The Lower Timeframe Which I Expect a Breakout Soon, Totally The Setup Is Bullish At Both Low And High Timeframes
🎯 Short And Mid Term Targets Are 0.066$ And 0.1$

GALA: buy by risk
📊Analysis by AhmadArz:
🔍Entry: 0.04723
🛑Stop Loss: 0.04132
🎯Take Profit: 0.05159 -0.05665 -0.06041 -0.07028 -0.07653
🔗"Uncover new opportunities in the world of cryptocurrencies with AhmadArz.
💡Join us on TradingView and expand your investment knowledge with our five years of experience in financial markets."
🚀Please boost and💬 comment to share your thoughts with us!

GALA APPEARS TO BE BEARISHIt appears that GALA has reached its peak. I anticipate a price retracement.
GALA CLASSIC PATTERNGala is showing bullish signs as it breaks through the resistance level. I anticipate a significant increase in price.

GALA. USDTWill the pattern be completed!?
So congratulations on your 200% profit
But even if the pattern does not complete, you can exit with a profit.
Gala is a cryptocurrency with high potential.

$GALA is in the sweet spot for accumulation! 📈"🚀 INDEX:GALA is in the sweet spot for accumulation! 📈 With potential gains of 20x on the horizon, missing out now could lead to regrets later. Don't sleep on this opportunity! #crypto #GALA #investment"

GALA/USDT is the possible the price bouncing and back to upward!💎 The recent market dynamics surrounding #GALA have indeed been quite notable. Currently, the price is bouncing from the demand area, which is a positive indication.
💎 This bounce suggests potential upward momentum, with the price likely to test the resistance area next. If there is a successful breakout above the resistance, it could pave the way for further upward movement, potentially leading to a backtest of the strong resistance area.
💎 However, if GALA fails to bounce from the demand area and instead breaks down below it, this could signal a bearish scenario. Such a move could lead to continued downward momentum, with the next significant support level likely found at the support area.
💎 GALA must maintain support and reclaim the area above the demand to validate the bullish scenario. Failure to do so, especially if the support area is also breached, could confirm a bearish trend, potentially leading to further downward movement.
MyCryptoParadise
iFeel the success🌴

GALAUSDT - RangeboundGALAUSDT is rangebound with no clear HH or LL. To trade the range there are 2 scenarios, either one, if executed will cancel the other scenario.If it breaks the support to the downside sell order should be executed at S2 or if it breaks the resistance to the upside buy order should be executed at R2. Support and Resistance levels are clearly marked on the chart

GALA/USDT - March-25-24Buckle Up for a Potential Massive Rally!
GALA is gearing up for what could be an exhilarating rally ahead! After reclaiming the lost support, the stage is set for a significant move to the upside. All it requires now is a bit of patience to reap potentially massive profits with your spot bag!
We've identified not just one, but two promising targets on the horizon that could significantly boost your portfolio. It's time to strategically plan your entry and hop on board this momentum train in spot.
Remember, patience is key as we await the fulfillment of these targets.
Money Management Matters: Protecting Your Profits
As always, effective money management is crucial, especially in the volatile world of cryptocurrency. Ensure you set up stop losses to mitigate risks and safeguard your investments. Adjust your stop along with the price movement to maximize gains while minimizing potential losses.
Final Thoughts: Stay Informed, Stay Profitable
always remember, diligence and risk management are the keys to long-term success in the crypto space.
#GALA #CRYPTO #Trading

🎮📈 GALA Long Trade Opportunity! 🚀💰📊 Analysis:
Support Retracement: GALA retraced to the $0.04 support level.
Entry Point: Consider entering a long spot trade at the current support level.
Profit Targets: Aim for $0.05 - $0.054 or $0.059 - $0.065 resistance levels.
Risk Management: Set a tight stop-loss just below $0.039.
📈 Trading Strategy:
Entry: Long trade initiated at $0.04 support.
Targets: Take profits at identified resistance levels.
Risk Control: Maintain discipline with the stop-loss.
🚨 Note: Stay vigilant for market fluctuations and adjust strategy accordingly! 📊🔍 #GALA #LongTrade #CryptoAnalysis 🎯💱

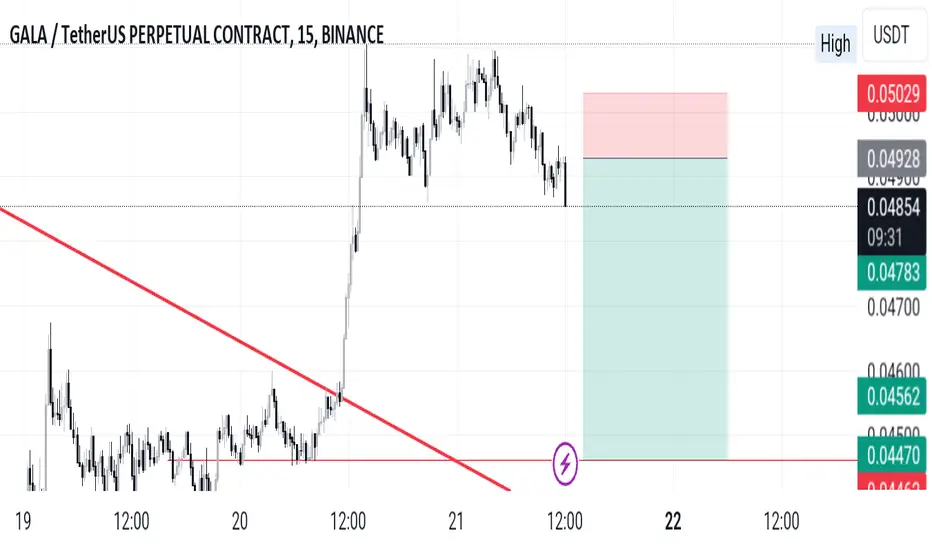
GALA Bull Market StartedMy personal opinion is as Gala has broken the white downtrend line it is in a bull market now. This Bullish picture is invalid if white trend line breaks downwards. Until that GALA is Bullish.

GALAUSDT WHAT TO DO?The Gala has reached to a very sensitive level It may break it and continue to the up ward movement after a pullback or it may retest the level and come back to the downtrend area.

Galausdt is countinuing the down trendI think the trend is going to continue the down trend movement. As the chart shows we have a complex pullback and the LWP level too. so I put and sell stop order under the LWP level
