#GALAUSDT Analysis — Macro Reversal Forming at Historical Suppor📈 #GALAUSDT Analysis — Macro Reversal Forming at Historical Support
🗓 Published: May 10, 2025
🕰 Timeframe: 1W | 📊 Exchange: Binance
🔍 Technical Overview
GALA is back at its multi-year support zone around $0.0117–$0.015. This level previously triggered major cycle rallies and is again showing signs of a potential bottoming pattern.
📌 Macro Structure:
✅ Rejection from red supply zone → multiple cycles
✅ Falling wedge breakouts in previous recoveries
✅ Consistent reaction to blue base = high probability reversal support
🟦 Support (Reversal Base):
$0.0117–0.0155
🔵 Historical pivot zone and volume base
📛 Weekly close below = invalidates bullish thesis
🟢 Entry Zone: ~$0.0195 (live)
Structure suggests early positioning with a defined SL
🔻 Stop (Panic Level):
Below $0.0150 – breakdown from base
Risk = 21.65%
🎯 Target Zones (If Reversal Holds):
TP1: $0.0463 – local resistance (2024 pivot)
TP2: $0.0816 – macro range top
TP3: $0.063–$0.082 – post-breakout acceleration zone
📈 Potential R:R = 15.66 — extreme asymmetric profile
🧠 Strategy Insight
GALA is showing signs of accumulation at the cycle bottom, just as in past recoveries.
• Early long setups triggering
• DCA with stops below $0.015 = clean invalidation
• Pump trigger = weekly close above red zone
💡 This is a macro positioning play — not a short-term momentum trade.
🗣 What’s Next?
Watch for a breakout of mid-range and $0.046 reclaim. That unlocks the next stage targets.
If bulls hold this zone → major rotation is possible mid-Q2.
📢 Cycle bottoms don’t shout — they whisper. GALA is whispering again from the same zone it always did.
we ask Allah reconcile and repay
GALAUSDT trade ideas

Gala Games Update: Looking—Still Bottom Prices—Good!Gala Games, we looked at it recently, just a month ago. Nothing changes but one small detail, there is a strong bullish breakout from the buy zone.
This weekly candle is full green. GALAUSDT lasted a total of four weeks in the buy zone after the All-Time Low. Leading to the ATL, four more weeks the action happened around this level. So total is 8 weeks, minimum for you to buy at bottom prices. With the action we are seeing now, these prices are now gone forever, but there is good news. It is still early.
The chart is very clear. Actually, we can change/extend the buy zone to include current prices. For example, the buy zone we identified a month ago was the green box on the chart. Now, I drew a new box, blue, and this can be our new buy zone. Since it is still early and Gala Games has so much potential for growth, it is easy to buy now focusing on the long-term, you can't go wrong.
The chart is very clear, Gala Games is trading still at bottom prices with a young bullish breakout. Growth is expected for months if not years. On a broader picture, we are set for an entire decade of financial prosperity and growth. Not only Crypto of course, everything related to finance. But, this does not change the fact that there will still be bear markets and strong corrections, it is only that the bullish cycles will be uncharacteristically strong while the bearish cycles will be weak and short. This is based on hundreds of years of data and a combination of so much... So much that I don't have the space nor time to share it all here.
It is only necessary to say, that GALAUSDT is still early for those looking to profit from a massive bullish wave. Literally, All-Time Low. Once we hit bottom, there is no other place left to go but up.
Prepare to be amazed as the Cryptocurrency market takes over the world.
Namaste.

Gala bull run possibleI was looking at this inverse shs forming on the daily as it was dipping, now that the inverse shs pattern is active im buying no rush. Looking at magic blue line breakout and massive bull run.

#GALA/USDT#GALA
The price is moving within a descending channel on the 1-hour frame and is expected to break and continue upward.
We have a trend to stabilize above the 100 moving average once again.
We have a downtrend on the RSI indicator that supports the upward move with a breakout.
We have a support area at the lower limit of the channel at 0.01727, which acts as strong support from which the price can rebound.
Entry price: 0.01764
First target: 0.01790
Second target: 0.01818
Third target: 0.01842

#GALA/USDT#GALA
The price is moving within a descending channel on the 1-hour frame, adhering well to it, and is on its way to breaking it strongly upwards and retesting it.
We are seeing a bounce from the lower boundary of the descending channel, which is support at 0.01500.
We have a downtrend on the RSI indicator that is about to break and retest, supporting the upward trend.
We are looking for stability above the 100 Moving Average.
Entry price: 0.01509
First target: 0.01538
Second target: 0.01558
Third target: 0.01590

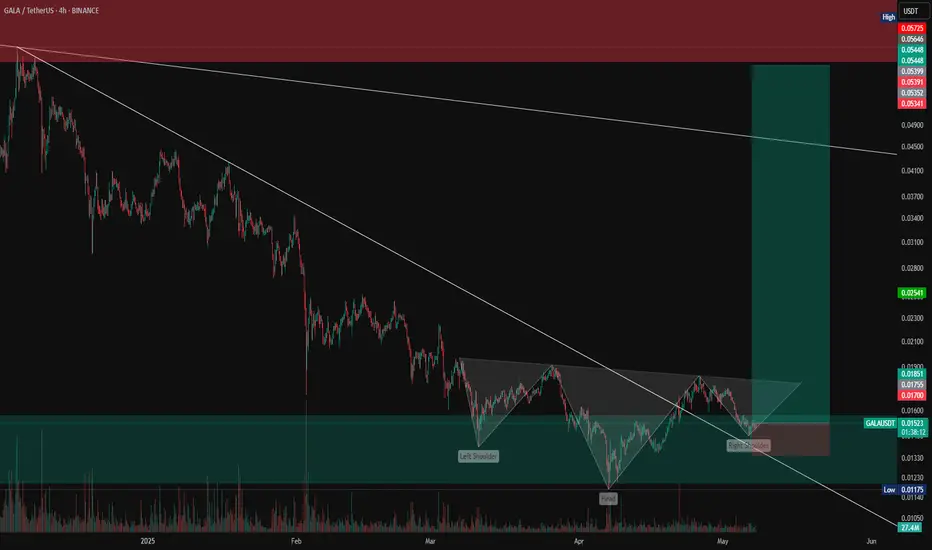
GALAUSDT Long setup in 4hwe have inverted head and shoulders in chart , buy opportunity by good Risk/Reward ratio 1/3
GALA / USDTHi friends,
Hope you're surviving the volatility!
GALA / USDT printing a descending broadening wedge, and I am taking this trade.
T1 is basically the top of the wedge, and if it holds the area shown in the chart it could reach T2 & T3 as well!
Fingers crossed!
Trade thirsty, my friends!

Gala short signalaccording analysis price reject from 1hr order block and MSS on 15 M now priceretest the 15m POI and then continue
daily bais bearish
entry moduel short
entry 0.01729
stop loss 0.01783
1st target 0.01593
2nd target 0.01370

GALAUSDT , INVERSE HEAD AND SHOULDER After breakout descending trend line in daily time frame Gala formed inverse Head and shoulder in 4H time frame , wait to breakout neckline or inter in shoulder .

BREAK AND RETESTGALAUSDT has been bullish inside of the channel forming higher highs and higher lows. Recently we saw a break and retest of the support highlighted on the chart...
For that reason , my bias is bullish from the 0.01750 level.
SL : 0.01684
TP : 0.01942

GALA/USDT 1W🌱 INDEX:GALA ⁀➷
#GalaGames. Macro chart Another
🌴 Intermediate Target - $0.13
🍃 Macro Target 1 - $0.20
🍃 Macro Target 2 - $0.35
🍃 Macro Target 3 - $0.57
- Not financial advice, trade with caution.
#Crypto #GalaGames #GALA #Investment
✅ Stay updated on market news and developments that may influence the price of Gala Games. Positive or negative news can significantly impact the cryptocurrency's value.
✅ Exercise patience and discipline when executing your trading plan. Avoid making impulsive decisions driven by emotions, and adhere to your strategy even during periods of market volatility.
✅ Remember that trading always involves risk, and there are no guarantees of profit. Conduct thorough research, analyze market conditions, and be prepared for various scenarios. Trade only with funds you can afford to lose and avoid excessive risk-taking.

#GALA/USDT
#GALA
The price is moving within a descending channel on the 1-hour frame, adhering well to it, and is heading for a strong breakout and retest.
We are seeing a bounce from the lower boundary of the descending channel, which is support at 0.01688.
We have a downtrend on the RSI indicator that is about to break and retest, supporting the upward trend.
We are looking for stability above the 100 moving average.
Entry price: 0.01703
First target: 0.01725
Second target: 0.01754
Third target: 0.01788

Gala longIm just seeing opportunities to go long on good value tokens.
None of this is financial advice, im just pointing out that if you are patient and know what you are looking for then the right times to trade are easy to spot.
my long strat has triggered

GALA Breakout Alert
INDEX:GALA has broken out of a falling wedge pattern on the daily chart — a strong bullish signal 📈
✅ Momentum is picking up, signaling potential continuation.
🎯 Targets: $0.019 → $0.025 → $0.030 → $0.034 → $0.041
Keep an eye on the breakout level for confirmation! 👀

GALA Bulls Assembling? Reversal Signs Are Clear!INDEX:GALA reversal in play?
Price is reacting strongly from a key demand zone, signalling possible accumulation. If momentum continues, a breakout could be on the horizon.
Key upside targets:
• $0.025
• $0.033
• $0.045
Could this be the start of GALA's next bullish leg?
Share your thoughts below.

gala looks extremely bullish after long bearish consolidation seems gala is finally ready for massive recovery falling wedge has already got cleared gala looks ready for 2x bullish rally

#GALA/USDT#GALA
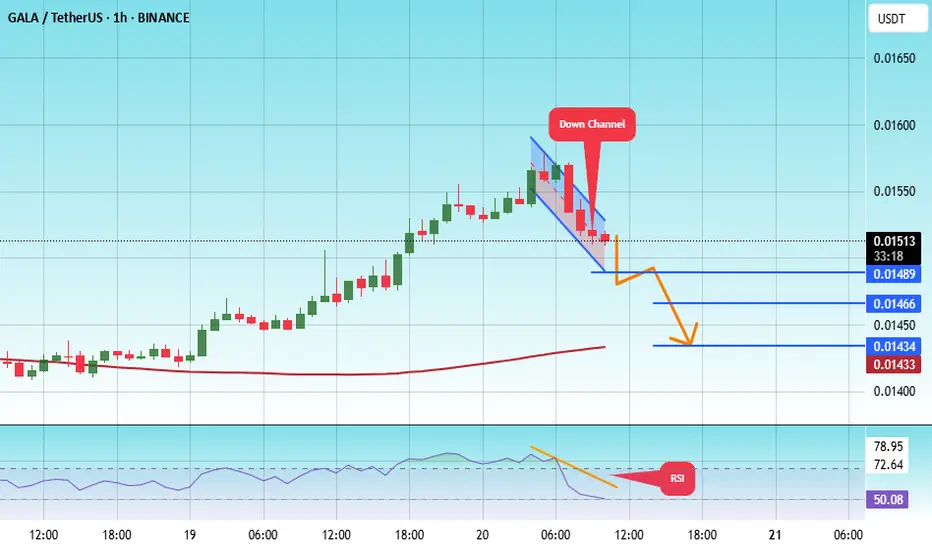
The price is moving within a descending channel on the 1-hour frame, adhering well to it, and is on track to break down strongly and retest it.
We are seeing a bounce from the upper boundary of the descending channel. This support is at 0.01533.
We have a downtrend on the RSI indicator that is about to break and retest, which supports the decline.
We are looking to stabilize above the 100 moving average, but the price is on track to touch it first.
Entry price: 0.01516
First target: 0.01489
Second target: 0.01466
Third target: 0.01434
GALAUSDT 1WThe price has reversed from the static support zone and the lower boundary of the descending channel, forming favorable reversal candles. The target is the previous static resistance level (the upper boundary).

GALAUSDT 1D AnalysisGALA ~ 1D Analysis
#GALA Buy after successfully penetrating this resistant line with a short -term target of at least 10%+ from here.

Galausdt Wyckoff EyesOn the weekly chart, GALA shows signs that may indicate:
• Formation of a price base: The price is moving within a narrow range after a prolonged downtrend, suggesting a possible end to the distribution phase.
• Increase in trading volume: Recent price rises have been accompanied by increased volume, supporting the idea of accumulation.
• Resistance breakout attempts: The price is testing previous resistance levels, which may confirm a transition into a new phase.
⸻
📊 Technical Indicators
• RSI (Relative Strength Index): Around 61, indicating bullish momentum without entering the overbought zone.
• MACD: Showing positive signals with bullish crossovers.
• Overall technical outlook: Suggests the potential continuation of the uptrend if current breakout attempts are confirmed.

Watch These 4 Crypto and Thank Me Later!I analyze several crypto assets that have strong potential to rebound nicely next week
They are:
TRUMP
GALA
TAO
FARTCOIN
Enjoy the analysis!

#GALA/USDT#GALA
The price is moving within a descending channel on the 1-hour frame, adhering well to it, and is on its way to breaking it strongly upwards and retesting it.
We are seeing a bounce from the lower boundary of the descending channel, this support at 0.01415.
We have a downtrend on the RSI indicator that is about to break and retest, supporting the upward trend.
We are looking for stability above the 100 moving average.
Entry price: 0.01504
First target: 0.01540
Second target: 0.01577
Third target: 0.016532

#GALA/USDT#GALA
The price is moving within a descending channel on the 1-hour frame, adhering well to it, and is on its way to breaking it strongly upwards and retesting it.
We are seeing a bounce from the lower boundary of the descending channel, this support at 0.01443.
We have a downtrend on the RSI indicator that is about to break and retest, supporting the upward trend.
We are looking for stability above the 100 Moving Average.
Entry price: 0.1460
First target: 0.01476
Second target: 0.01500
Third target: 0.01530
