GALA is gaining upside momentumHello, everyone!
Couple of weeks ago we made analysis on GALA where considered that it's closed to it's bottom. Since then this asset is staying at the same level and most of traders disbelieved in the any potential bounce.
If you remember 2D is our working time frame to establish the Elliott waves cycle. Usually we have 3 confirmations of the reversal: bullish reversal bar, then AO momentum reversal and finally fractal breakout.
This bullish reversal bar is not an obligatory condition, it could be or not. AO reversal is obligatory one. Here we have 3 green bar on AO histogram. The key level for reversal confirmation was the yellow line. Price has successfully passed this line.
Moreover MFI has printed the squat bar at the very bottom and green bar is about to be printed today which is another one bullish factor here. If we are right minimal target is $0.02 where the Fibonacci 0.61 zone is located.
Follow us and never miss the update
GALAUSDT trade ideas


GALAUSDT - BULLISH/BEARISH?Gala is on down trend & respecting trendline so let see if its breakout then we can see huge pump otherwise most probably it can follow downtrend.

GALA Coin almost ready.Hey, it looks like its heading down to the 1.168 fib / 0,00953 level. From here we should see an explosion to the upside.

GALA ANALYSIS🟢#GALA Analysis : Waiting for Breakout 💰💰
🚀🚀As we can see that #GALA is trading in a falling wedge. If it breakout with good volume then we can see a big bullish move in #GALA 📈📈
🔖 Current Price: $0.01340
⏳️ Target Price: $0.04375
⁉️ What to do?
- According to the analysis #GALA will go up to 0.04375. Keep your eyes on the chart, observe trading volume and stay accustom to market moves.🚀💸
🏷Remember, the crypto market is dynamic in nature and changes rapidly, so always use stop loss and take proper knowledge before investments.
#GALAAnalysis #Cryptocurrency #WaitingforBreakout #DYOR

GALA 📌 macro analysis ⏰
BINANCE:GALAUSD :: long term 📌 analysis ⏰
#dyor #NFA gaming coin 🎮
Detailed information ( #explaination )
🐿
SUPPORT 📌 $0.0134-0.01506
< #BUY > 📌 $0.00903-0.0104
RESISTANCE 📌 $0.112-0.163 < #sell >
( very high resistance make it as #principaltrade )
After breaking resistance 📌 weekend candle close above
Possible target 📌 $0.5-0.53 & $1.98-2.1
#explanation
Gaming coins 😊 Strom community and project
Recently effect in news 🗞️ if this take hard 📌 turn risky to holders like #ftx
I am expecting $0.1-0.15 will be bull top 🔝 but based on comfirm we can move
I will update you 👍 or remind me 😊
I am not expecting it will reach support 2 📍 but news 🗞️ getting hard 📌 it will hit easily
Until FEBRUARY 2024 coin have bearish 📍 phase 📍
March 2025 will be decided phase 📍 on this coin 🪙
Risk is high 👍
Recommend position size 1%
Old user's try to average 60% at support 1
40% at support 2 📍 based on ur old liquid 💰
Or ask here 👍

GALA - just one more dump!Hello, dear friends!
Last time I have too many analysis updates on INDEX:GALA . Some of you could think that I am their ambassador, but it's not true. This asset just in the nice price range to accumulate some coins. You have already seen my global analysis that bottom is almost here.
Today I will show you the local price action analysis. the fact that price set the new lower low means that we are in new bearish impulsive wave. I think this is wave 5. This wave should also consists of 5 waves. It looks like wave 4 has been finished and wave 5 in wave 5 is in progress.
I expect the dump slightly below current low. If Awesome oscillator will show divergence it's gonna be the nice reversal sign.
Best regards, Skyrex team
__________________________________________________________
🔥Please, follow us and smash the rocket🚀 button to support us🔥

GALA sell Trade Based On N WaveWelcome to our crypto exploration hub! We're here to navigate the exciting world of digital assets, providing you with comprehensive insights into market dynamics and potential trading opportunities.Our mission is to decode the crypto market's mysteries and equip you with the knowledge you need to make informed investment choices. From the latest developments in Bitcoin to the hidden potential of various altcoins, we're your trusted source for daily technical analysis.While technical analysis is a valuable tool, it's important to remember that it's just one piece of the puzzle. We encourage you to take a well-rounded approach to your investments, considering factors like macroeconomic trends, news, and community sentiment.Join us for the freshest analyses, and don't hesitate to join the conversation in the comments below. Keep in mind that our content is purely for educational purposes and should not be construed as financial advice. Always integrate it into your broader investment strategy."

GALA - where is the dump limit?Hello, dear friends!
Time to make an update for the annoying BINANCE:GALAUSDT which have already took 2 my stop-losses during this dump. Elliott waves analysis is showing us that the bottom is too close and the potential reward is gonna be 10X more than risks, that's why it's ok to get couple of SLs.
Looking at the current price action it looks like dump don't want to be stopped. On the 2D time frame we can see the forming of the green bar, which means that asset can go a little bit lower.
Elliott waves analysis is showing us the potential ending diagonal forming and wave 5 has two potential targets: 1 and 0.61 levels from wave's 1 length. The first target is unreachable because of negative price zone, that's why our target is $0.009. Anyway MFI is decreasing right now, it means that downtrend is weakening everyday.
Best regards, Skyrex team
__________________________________________________________
🔥Please, follow us and smash the rocket🚀 button to support us🔥

Hope you bag small bag7% from my entry, you can take profit and adjust stop lost to entry and the signal run.

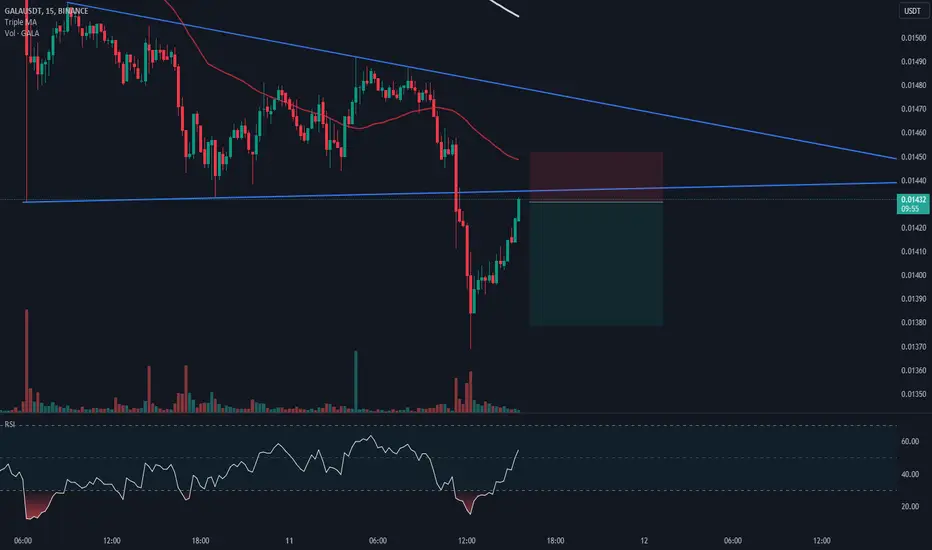
Gala is nice long entry point here Entry : 0.01444
TP1: 0.01458
TP2: 0.01473
TP3: 0.01487
Stop loss: 0.01430

galagala continues to decline, and there are no signs of an uptick yet...maybe the market will go down until the btc halving....


galllllllaaaaaaaaaaaagala is going to make a miracle.the targets on the chart are at least....on member of gala games wrote in coin market cap told that gala is preparing to 25_50x move.
i think this is going to happen

Ultimate GALA analysisHello, dear friends!
Today I will show you why there is a huge confidence in potential pump for BYBIT:GALAUSDT.P and also the bear market could be finished for this asset.
First of all let's take a look at the 2D time frame. It looks like price is printing the ending diagonal in last bearish wave 5 which consists of 5 waves.
Awesome oscillator is showing the potential divergence. Of course, momentum has not been changed still, but when we will see three green bars on the hist it means that we did not make a mistake.
Watch out the updates to this article in the next hour!

Simetrical triangle on GALA/USDT with pullbackGALA is completing a pullback vs a simetrical triangle. The simetrical triangle is a continuist pattern. In this case the price maybe be go down at least to 0.01379
Another Simetrical triangle on GALA/USDTGALA is forming a simetrical triangle. The simetrical triangle is a continuist pattern. In this case the price maybe be go down at least to 0.01400

Gala LongI want to share that in the world of cryptocurrency trading, there seems to be a drop in Gala value in the short term, but it may turn bullish afterward.

sometimes we win, sometimes we get stopped out...Hello ladies and gents,
Seems like the marker isn't ready to push higher just yet.
With USDT breaking above resistance lines the market took a 5-10 percent hit this weekend.
With that I got stopped out of a sweet buy and I'd like to explain why I purchased this coin when I did.
We have been seeing a lot of coins pumping randomly as BTC goes sideways or slightly higher.
Some coins pumping 40% in a day.
With the GALA news I thought market makers were punishing some people just before a quick pump but it didn't happen.
Saw CHR, TRB, ORN, OGN, BAKE, all type or coins pumping but not this one.
I dont hold coins such as GALA, I just look for key entries, with very minimum risk in tokens like this because if the market is up for it, it provides.
So I got it on my watch once again but ONLY after it hits my confluence lines and bounce..
There are a lot of coins providing scalping profits or daily trades that I'll focus until this scenario happens.
Anyway, trade thirsty my friends.

Simetrical triangle on GALA/USDTGALA is forming a simetrical triangle. The simetrical triangle is a continuist pattern. In this case the price maybe be go down at least to 0.01458

GalausdtHello friends. According to the history, it is at a good support point. The possibility of rising due to the improvement of the general market conditions

LONG position on GALAGALA has reached the daily support zone and it can bounce back from here. long term setup, keep tight stop loss and use lower leverages

