GALAUSDT trade ideas

GALAUSDT: Long-Term Bullish Potential Despite Bitcoin DipGreetings, fellow traders,
This analysis presents a brief overview of GALAUSDT's current market position and potential for a long-term trade.
While the recent two-day uptrend of GALAUSDT has been influenced by Bitcoin's price fluctuations, the overall outlook remains positive for a long-term, long position. Despite the current dip, Gala demonstrates significant potential for growth. As indicated on the 4-hour chart, the price currently resides at the bottom of the ascending channel, which is a very good point to take a Long position, presenting a strong opportunity for an upward move.
I've identified three potential price targets for this long trade:
Target 1: $0.03610
Target 2: $0.03950
Target 3: $0.04100
BINANCE:GALAUSDT
These targets are based on the current chart.
Investors are encouraged to conduct their own due diligence and manage their risk accordingly.
Profitable trades to all!

GALAUSDT: Short Opportunity as Downtrend ConfirmedGreetings, Traders,
GALAUSDT has officially entered a downtrend, presenting a solid opportunity for short positions.
I recommend entering a short trade below the $0.03150 price zone.
Target 1: $0.03020
Target 2: $0.02910
A stop-loss order placed above $0.03250 could be considered to manage potential risk
Following the breakdown below the key support level, as seen in the daily chart, a short position is favored.
This is not financial advice. Please do your research before making any trading decisions.
Exercise proper risk management and set a stop-loss order according to your risk tolerance.
Profitable trades to all!

GALAComprehensive Analysis of GALA
🔹 Project Introduction:
GALA is a blockchain-based ecosystem focused on developing decentralized gaming (GameFi) and NFTs. The project aims to give players full control over their in-game assets while introducing a new economic model for the gaming industry.
📊 Technical Analysis of GALA/USDT
🔍 Overall Market Condition:
GALA is currently trading within a mid-term ascending channel and is sitting at a key support zone that will determine the next major price direction.
🟢 Bullish Scenario:
Key Support Zone:
$0.02435 – $0.02684 (Blue Box)
If this support holds, the price could move toward the midline of the ascending channel.
The next major resistance lies within the red zone:
$0.05949 – $0.06914
This resistance acts as a crucial ceiling for the price.
🚀 Potential Targets After Breaking the Red Resistance:
✅ TP1: Channel Top
✅ TP2: Breakout Above the Channel → Higher Price Levels
🔴 Bearish Scenario:
If the blue support zone fails to hold:
The price could drop to the bottom of the ascending channel + weekly support
🏁 (Gray Box)
Losing this level may trigger a new bearish trend.
📈 Trend Confirmation Factors:
✔ Increasing volume on breakouts → Confirms bullish momentum
✔ Declining volume on pullbacks → Indicates weak selling pressure
✔ RSI near 50: A move towards 70 (Overbought Zone) signals bullish strength
📌 Summary & Suggested Strategy:
🔹 Holding the blue support → Targeting the red resistance
🔹 Breaking the red resistance → Potential move towards TP1
🔹 Breakout above the channel → Strong bullish rally
🔹 Heavy rejection → Key support at the bottom of the channel (Gray Box)
⚠️Risk Management:
Monitor trading volume & RSI behavior to confirm breakouts or reversals.

GALA SCENARIOI tried to create this scenario to anticipate declines and increases, I tried to create a 3 pattern scenario

#GALA/USDT Ready to go up#GALA
The price is moving in a descending channel on the 1-hour frame and is adhering to it well and is heading to break it strongly upwards
We have a bounce from the lower limit of the descending channel, this support is at a price of 0.02690
We have a downtrend on the RSI indicator that is about to be broken, which supports the rise
We have a trend to stabilize above the moving average 100
Entry price 0.02900
First target 0.03073
Second target 0.03252
Third target 0.03440

Gala is ready to PUMP!As you can see GALA is ready to go up because it grabbed the IDM liquidity in dayli time frame and made a SCOB confirmation , so we expect it reach to top of structure soon...
its just my oponion and its not a financial advice.

Example of explanation of chart analysis and trading strategy
Hello, traders.
If you "Follow", you can always get new information quickly.
Please click "Boost" as well.
Have a nice day today.
-------------------------------------
There was an inquiry asking for detailed information on how to analyze charts and create trading strategies accordingly, so I will take the time to explain it.
Before reading this article, you need a basic understanding of charts.
That is, you need to understand candles and price moving averages.
If you study this first and then read this content, I think you will have some understanding of trading.
---------------------------------------
Whether you are trading spot or futures, marking support and resistance points according to the arrangement of candles on the 1M, 1W, and 1D charts is the first task you need to do before trading.
To do this, you need to understand the arrangement of candles.
Therefore, before using my indicator, it is better to study candles first and understand the arrangement of candles.
When studying candles, it is better not to try to memorize the names or shapes of various patterns.
This is because the overall understanding of candles is important, not the various patterns of candles.
If you study with a book or video, you will be able to understand candles after reading or watching them at least 3 times.
We study charts to trade, not to analyze charts and teach them to others, so we need to study efficiently and save time.
-
If you study candles, you will naturally understand the price moving average.
The indicator corresponding to the price moving average is the MS-Signal indicator.
This MS-Signal indicator consists of the M-Signal indicator and the S-Signal indicator, and the main indicator is the M-Signal indicator.
Therefore, we added the M-Signal indicator of the 1W chart and the M-Signal indicator of the 1M chart to the 1D chart so that we can see the overall trend.
-
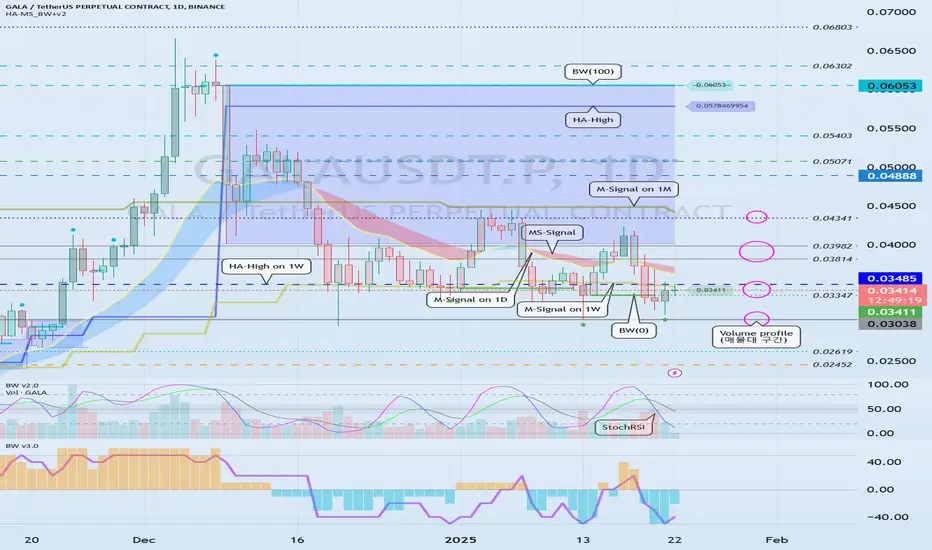
You can see the arrangement of the MS-Signal (M-Signal of 1M, 1W, 1D charts) indicators in the example chart.
Currently, since the M-Signal of the 1M chart > the M-Signal of the 1W chart, we can see that it is a reverse array.
If you understand the price moving average, you will understand that we should not trade when it is a reverse array, but when it is a regular array.
Therefore, since the current state of the example chart is a reverse array, it is not suitable for trading.
However, the reason we brought this chart in this state is because the M-Signal indicators of the 1M and 1W charts are converging.
As convergence progresses, it will eventually diverge.
Therefore, since the possibility of price volatility increases, the possibility of capturing the timing for trading increases depending on whether there is support at the support and resistance points.
-
The indicators included in the example chart are drawn as horizontal lines to indicate support and resistance points.
This work performs the same role as the support and resistance points drawn on the 1M, 1W, and 1D charts according to the arrangement of the candles mentioned above.
Therefore, on the 1M, 1W, and 1D charts, horizontal lines are drawn on the indicators to indicate support and resistance points.
You can draw horizontal lines on indicators that are horizontal for at least 3 candles, and if possible, 5 candles.
-
Among the HA-MS indicators, the important indicators are the HA-Low and HA-High indicators.
The HA-Low and HA-High indicators are indicators created for trading on the Heikin-Ashi chart.
Therefore, it is the next most important indicator after the MS-Signal (M-Signal on 1M, 1W, 1D charts) indicator that can tell the trend.
You can create a trading strategy depending on whether there is support near the HA-Low, HA-High indicators.
-
The next most important indicator is the BW(0), BW(100) indicator.
When this indicator is created or touched, it is time to respond in detail.
That is, when you are trading with a trading strategy created from the HA-Low, HA-High indicators, when the BW(0), BW(100) indicators are created or touched, you can choose whether to proceed with a split transaction.
In addition, you can understand the OBV, +100, -100 indicators as response points for split transactions.
Therefore, you do not need to indicate support and resistance points for the OBV, +100, -100 indicators.
However, it is recommended to mark support and resistance points for the HA-Low, HA-High, BW(0), BW(100) indicators.
-
If you look at the price position in the example chart, you can see that it is located in the 0.03347-0.03485 range.
And, the M-Signal indicator of the 1W chart is passing through this range, and the HA-High indicator of the 1W chart is acting as support and resistance.
Therefore, whether there is support near 0.03485 is an important key point.
If support is confirmed near 0.03485, it is a time to buy.
However, since the MS-Signal (M-Signal on the 1D chart) indicator is passing between 0.03485-0.03814, the point to watch is whether the MS-Signal (M-Signal on the 1D chart) indicator can break through upward.
As I mentioned earlier, if the MS-Signal indicator passes, a trend change will occur, so it is significant.
Therefore, in order to turn into a short-term uptrend, it is likely to be supported around 0.03814-0.03982.
Therefore, the first split selling section will be around 0.03814-0.03982.
At this time, whether to sell or hold depends on your investment style and investment period.
-
Since the M-Signal indicator on the 1M chart is passing around 0.04341, it is likely to start when the price is maintained above the M-Signal indicator on the 1M chart in order to turn into a long-term uptrend.
Therefore, the second split selling period will be around the M-Signal indicator on the 1M chart.
This is also something you can choose.
-
An important volume profile section is formed around 0.03038.
Therefore, the 0.03038 point corresponds to a strong support section.
-
(30m chart)
When the time frame chart you are trading is below the 1D chart, it is recommended to activate the 5EMA indicator on the 1D chart.
(I just used the 30m chart as an example. The same principle applies to any time frame chart you usually use.)
This is because there is a high possibility of volatility when the 5EMA of the 1D chart and the M-Signal indicator of the 1M, 1W, and 1D charts are touched.
In other words, you can understand that it plays a certain role of support and resistance.
If it touches the HA-High, BW(100) indicator and falls and falls below the MS-Signal indicator, it will basically touch the HA-Low or BW(0) indicator.
On the other hand, if it touches the HA-Low, BW(0) indicator and rises and rises above the MS-Signal indicator, it will basically touch the HA-High or BW(100) indicator.
However, since it may not do so and may rise or fall in the middle, it is necessary for the support and resistance points drawn on the 1M, 1W, and 1D charts as mentioned earlier.
The support and resistance points drawn on the 1D chart are currently indicated at the 0.03347 point.
Therefore, even if it falls below the MS-Signal indicator, you can understand that there is a possibility of rising again around 0.03347.
Since the 5EMA of the 1D chart and the M-Signal indicator of the 1W chart are passing around 0.03485, we can see that the area around 0.03485 is an important support and resistance zone.
-
Since the StochRSI indicator is currently above 50, we should focus on finding a time to sell.
Since it has fallen below the BW(100) and HA-High indicators, it has fallen too much to start trading with a sell (SHORT) position.
However, if you can respond quickly, you can enter a sell (SHORT) position when it falls from the 0.03411 point where the MS-Signal indicator is passing.
When the StochRSI indicator falls below 50, we should focus on finding a time to buy.
At this time, you can trade based on whether there is support or resistance at the support and resistance points drawn on the 1M, 1W, and 1D charts or around the MS-Signal (M-Signal on the 1M, 1W, and 1D charts), 5EMA, HA-Low, HA-High, BW(0), and BW(100) indicators on the 1D chart.
As mentioned earlier, you should not forget that trading strategies can be created based on whether there is support at the HA-Low and HA-High indicators.
Therefore, if possible, it is recommended to trade based on whether there is support near the HA-High indicator point of 0.03443.
-
Thank you for reading to the end.
I hope you have a successful trade.
--------------------------------------------------
TradeCityPro | GALAUSDT Battle Between Buyers and Sellers 👋 Welcome to TradeCityPro Channel!
Let's dive into this cryptocurrency altcoin, after which I will explain in detail about Trump’s meme coin and his wife in the next analysis.
🔍 Bitcoin Overview
Before starting today’s analysis, let’s take a quick look at Bitcoin on the 1-hour timeframe. Last night, we saw some volatility, triggered by the inauguration of the new U.S. president, Mr. Trump, which led to these movements.
Initially, we experienced some bearish candles and dropped below $100,000. However, we bounced back and reached a new price ceiling of $109,350, which was touched on most exchanges. It was an unprecedented event for Bitcoin fans.
📅 Weekly Timeframe
On the weekly timeframe, GALA is one of those cryptocurrencies that is still fluctuating within its larger range box. It seems likely that it will break out soon.
The key resistance level here is at 0.06090. When we previously attempted to break the range box, the breakout was fake, and we returned to the box.
For re-entry, I plan to buy long-term once the range box ceiling at 0.06090 is broken. However, I will need volume increase for confirmation. For now, the main exit trigger will be a break below 0.01579.
📈 Daily Timeframe
On the daily timeframe, GALA is showing a good potential for a bullish movement as it’s breaking above its previous daily range.
After breaking the resistance at 0.02434, the price moved up nicely to the range box resistance of 0.0609, which was a reasonable place to take profits or exit the position. I personally opted for the latter.
Currently, the price is at a crucial support level at 0.03305, which is important on both the daily chart and also aligns with the 50% Fibonacci retracement level, a key technical point. This zone is considered a potential reversal zone (PRZ).
For re-entry, I will buy if we experience a fake breakout at this support level or if we break above 0.04344. The most significant entry will be if the weekly ceiling of 0.06090 breaks. I will continue to hold my 0.02434 entry. For selling, I won’t do anything at 0.03305, but there’s a possibility I might open a short futures position, as the price could move towards 0.02821 or 0.02434.

Gala Update: The Whales Have BoughtMy analysis was doing well until the price failed to reach a new all-time high, rejecting at $0.4247, breaking through my diagonal support, and invalidating my prior technical analysis (TA).
What Happened
After adjusting my charts according to the new price action, I now see that the Wave 2 correction started as an A-B-C correction but transitioned into a Triangle Correction. Initially, I tracked this as a WXYXZ correction, which wasn’t entirely incorrect. However, I expected the market to reverse after the "Z" correction. Instead, we saw two additional impulses before the correction ended.
I have marked my invalidation lines on the charts for reference. To be fair I like this analysis more than my previous as if you have been following me it was always an issue that Wave C was truncated so this Triangle Correction actually fits much better - Lets see how it goes.
Analysis of Events
As the market dumped starting at 8:00 AM (AEST) over a five-hour period, approximately 1.556 billion contracts were traded. There was massive volume, over six times higher than Gala's usual trading volume. During this period, the price ranged between $0.03933 and $0.03165, indicating significant absorption.
Absorption Explained:
During this price consolidation, a substantial number of participants were selling off positions. Under normal circumstances, this volume of selling would push the market further downward. However, it didn’t. The reason? Large buy orders were absorbing the sell orders.
What we witnessed was the market dumping into a buying zone, where larger players were waiting to absorb the sell pressure. This indicates that larger market makers entered the market with the expectation that the price is heading upwards. When these players enter at such significant levels, it typically sets the stage for a bullish move in the near future.
Updated Technical Observations
Invalidation Lines: Clearly marked to reflect the failed reversal after the "Z" correction.
Volume Spike: The 6x increase in volume during the sell-off confirms strong market participation.
Buy Zone: The price consolidation at $0.03933 - $0.03165 demonstrates a critical accumulation phase.
Larger market players entering at these levels strongly imply an upcoming upward momentum. As always, patience and adherence to updated TA will be critical moving forward.

#GALA/USDT Ready to go higher#GALA
The price is moving in a descending channel on the 1-hour frame and sticking to it well
We have a bounce from the lower limit of the descending channel, this support is at 0.03330
We have a downtrend on the RSI indicator that is about to be broken, which supports the rise
We have a trend to stabilize above the moving average 100
Entry price 0.03500
First target 0.03597
Second target 0.03778
Third target 0.03986

Gala Update: Bullish - Back Testing SupportI had the day off yesterday and missed the downward movement, which, in hindsight, was fairly predictable. There was a noticeable bearish CVD (Cumulative Volume Delta) divergence forming as early as yesterday morning, signaling a potential correction.
Despite that, it wasn’t anything too serious. As you can see, price broke out of the diagonal resistance and has since come back to back-test it as support. We’ve successfully held that level as support—definitely a positive sign.
Looking ahead, my next target upward is $0.04586, as we continue to work through resistance levels step by step.
Key Levels:
Support: Holding the back-tested diagonal resistance as support is critical for maintaining bullish momentum.
Resistance: Watching for the next significant hurdle at $0.04586, which aligns with the next resistance zone.
This progression suggests that Gala is in a healthy consolidation and recovery phase, provided the support levels hold. Keep an eye on volume and market reactions as we approach the $0.04586 target.

#GALA/USDT Ready to go higher#GALA
The price is moving in a descending channel on a 15-minute frame and sticking to it well
We have a bounce from the lower limit of the descending channel, this support is at a price of 0.03532
We have a downtrend on the RSI indicator that is about to be broken, which supports the rise
We have a trend to stabilize above the moving average 100
Entry price 0.03621
First target 0.03743
Second target 0.03865
Third target 0.04017

GALA/USDT BREAKOUT: READY FOR A 100%+ PUMP!!🚀 Hey Traders! 👋
If this setup has you pumped, smash that 👍 and hit Follow for trade ideas that actually deliver! 💹🔥
GALA: Breaking Out and Ready to Fly! 🚀
GALA has just broken out of a symmetrical triangle on the 8-hour timeframe, signaling a potential 100%+ pump from here! Now’s the time to position yourself for the next big move.
📊 Trade Setup:
Entry Range: CMP (Current Market Price) and add more up to $0.039
Targets: $0.048 / $0.057 / $0.068 / $0.085
Stop Loss: $0.036
Leverage: Use low leverage (max 5x)
🔥 Why GALA?
This breakout could be the start of a major rally, and the risk-to-reward here is highly favorable. Don’t miss out on this opportunity!
💬 What’s Your Take?
Are you bullish on GALA’s breakout potential? Drop your analysis, predictions, or strategies in the comments below! Let’s navigate this market together and secure those gains! 💰🚀

#GALA Breakout: Next Move Incoming! #GALA Breakout Alert! 🚀
The breakout has occurred, and INDEX:GALA is poised for another leg up!
Stay tuned for updates, keep an eye on the action, and don't forget to follow for more.
DYOR, NFA
#Crypto #Altseason

Bottom in for Gala: Key Indicators Signal Bullish MomentumThe Wave 2 correction for Gala began on December 5th and initially appeared to be a straightforward Zig-Zag pattern. However, it evolved into a more complex WXYXZ correction, making navigation challenging.
The correction concluded with a bottom at $0.03034 on Monday, December 13th. While I initially anticipated a larger retracement for Wave C, the strong price action suggests truncated Wave C, falling short of expectations. This marks a pivotal turning point for Gala as bullish signals begin to dominate the landscape.
Why I’m Now Bullish
Momentum Indicators Are Bullish
The Weekly and Daily Stochastic RSI have flipped bullish. I employ a dual momentum strategy, trading in the direction of the higher time frame (Weekly) and seeking entries on the Daily or Hourly charts. With both the Weekly and Daily Stochastic RSI indicating bullish momentum, purely based on the strategy I no longer maintain a bearish bias.
Breakthrough of Key EMAs
Gala's price has broken above the Exponential Moving Averages (EMAs) on both the 4-Hourly and Daily charts. This signals strong upward momentum and a potential shift in trend direction.
XRP Validation of Wave 3
XRP has broken the high of Wave 1, validating that it is now in Wave 3 of its bull run. This is significant because altcoins like Gala often follow broader market leaders like XRP.
Bitcoin’s Ascension into Wave 5
Bitcoin’s recent price action suggests it has begun its ascent into Wave 5. Bitcoin’s movements have a strong influence on altcoins, and its bullish trajectory supports the case for Gala’s upward potential.
Addressing Bearish Sentiment on Bitcoin
Many market participants remain bearish on Bitcoin. Understandably as Bitcoin has had a relatively shallow correction barely correcting down to the 0.386 Fibonacci level, which is typically a minimum expectation for a Wave 4 retracement under Elliott Wave theory. However, markets do not always adhere to theoretical expectations.
My analysis of Bitcoin’s wave count indicates that Wave 4 likely concluded at $98,888.98, and it is now ascending into Wave 5. While bearish skepticism is understandable, Bitcoin’s current price action suggests the bearish scenario is becoming increasingly unlikely.
Short-Term Bearish Action
At the time of writing this momentum indicators on the 1, 2, 4, 8, and 5-hour time frames are bearish, signaling the potential for short-term downside price action. This could provide a final opportunity to enter the market before momentum across the hourly, daily, and weekly time frames aligns fully to the upside. It is worth noting that price action is strong so looking for a dip might prove difficult.
Next Moves for Gala
I’m now focused on identifying an optimal entry point into the market as Gala transitions into the much-anticipated Wave 3. While short-term price action may be choppy, the key level to watch is the break $0.0666. Once this level is reclaimed, it will likely serve as a confirmation of Gala's Wave 3.

Wave C Teeters on Invalidation at $0.03736This analysis of Gala's price action under the lens of Elliott Wave Theory suggests a critical point of potential invalidation in Wave 2, making it a pivotal moment for traders following this method. Here’s a breakdown and insights from the provided analysis:
Key Points from the Analysis:
Wave C in Progress:
Wave C is part of a corrective A-B-C structure and consists of five impulsive subwaves.
Wave 1 of Wave C was established at $0.03034, and the current price action suggests Wave 2 is nearing completion.
Wave 2 Close to Invalidation:
Wave 2, as per Elliott Wave Theory, must not exceed the high of Wave 1 at $0.03736.
Current price action brought Wave 2 within $0.00008 of this invalidation point, highlighting the criticality of this juncture.
Potential Next Moves:
If the price exceeds $0.03736, the wave count for the entire corrective structure becomes invalid.
The expected extension for Wave 3 is projected to the 1.618 Fibonacci level at $0.02592. However, this is a zone of potential support rather than a guaranteed target.
Observations:
Critical Resistance: The $0.03736 level serves as a pivotal resistance. A breach invalidates the current Elliott Wave count and suggests a need to reassess the thesis.
Downside Potential: The 1.618 Fibonacci extension at $0.02592 could act as a significant support level if Wave 3 unfolds as expected.
What to Watch For:
Price Behavior Around $0.03736:
If the price remains below this level, it reinforces the validity of the current wave count.
A breach would indicate that the corrective structure is unfolding differently than expected.
Conclusion:
The analysis underscores a critical moment for Gala, with the $0.03736 level acting as the line in the sand for the current wave count. Traders should stay vigilant and prepared to adapt strategies if invalidation occurs. If the wave count holds, a move toward the $0.02592 zone could provide an opportunity for entries or exits, depending on one’s trading plan.

Gala pump then weekly demand sweep Today marked break out of daily demand zone and rejecting hourly supply we will then form a w to sweep 4hr supply around .042 ish then going back down to weekly demands from .022 to .017 then buckle up 🚀 🚀

Gala Trade Analysis: The Moment of Truth for CryptoThe cryptocurrency market is at a pivotal moment, with its future direction heavily dependent on Bitcoin’s immediate price action. Whether the market undergoes a further correction or breaks out into bullish territory will determine if Gala continues its current corrective phase or begins a new upward trajectory.
Wave C Correction in Play
For Gala, Wave B has concluded, and the focus is now on the ongoing Wave C correction, consistent with its Elliott Wave pattern. The critical target zones for this correction are:
$0.027: A significant support level derived from Fibonacci extensions and prior price action.
$0.024: A deeper corrective target that aligns with potential demand zones.
Currently, the structure of the Wave C correction remains intact and valid, with no signs of technical invalidation. Gala’s price action continues to exhibit corrective behavior, suggesting a potential continuation of the downtrend unless Bitcoin's bullish momentum disrupts this trajectory.
The Potential for a Truncated C Wave
Bitcoin’s recent bullish momentum cannot be overlooked. If Bitcoin sustains its upward trend and holds above $98,300, it is likely to retest its all-time high. This scenario could result in a truncated Wave C for Gala.
A truncated Wave C correction occurs when the C wave does not fully extend below the endpoint of Wave A, often signaling underlying market strength.
Additionally, Bitcoin itself has yet to fully complete its Wave C correction. However, with Bitcoin’s price exceeding the high of Wave B, the correction is no longer a zigzag. This leaves only two possible outcomes for bitcoin:
Bitcoin has entered Wave 5, marking the start of a bullish impulse.
The Wave C correction is an expanded flat, suggesting a final corrective move before resuming the trend.
Key Level to Watch: $98,300
Bitcoin’s performance at $98,300 is critical.
Scenario 1: If rejected, further downside for Bitcoin is expected, potentially extending corrective phases across the crypto market, including Gala.
Scenario 2: If support holds and bullish momentum persists, this could ignite a strong market-wide rally, including a truncated C wave for Gala and a new impulsive wave for Bitcoin.
Conclusion
The cryptocurrency market stands at a defining crossroads, and Gala’s trajectory is intertwined with Bitcoin’s next move. Monitoring Bitcoin’s price at $98,300 is crucial, as it will provide the clearest indication of whether the market corrects further or prepares for the next bullish wave. Stay alert, as this could be the turning point for the entire crypto space.
But also, make no mistake, Crypto is highly manipulated. The market will do everything it can to make you think it's about to turn around, only to reverse against you. Naturally it will take you to the limit.

Sounds familiar!After several years of stagnation, Gala seems to be forming a familiar pattern. The well-known Diamond pattern reminds us that sooner or later we will see an explosion in this currency.

GALAUSDT: Bullish Trend (Harmonic Pattern)GALA is moving in Harmonic Pattern on 1hr time frame, and also forming bullish divergence. so for the bullish trend confirmation we will wait for the break of the resistance level to take a long trade with proper risk management.

Gala Update: Wave A Complete, Wave B in PlayThis analysis is subject to pricing holding support at $0.03441.
Wave A Analysis
I believe we have completed Wave A of an A-B-C corrective structure, with us hitting 2 price targets in my previous idea. Wave A consists of 5 impulsive waves, as mapped out above, and has landed in a key reversal zone — specifically between the 0.618 and 0.65 Fibonacci levels. This is a significant area where price historically tends to bounce.
Additionally, Wave A ended with a swing failure pattern (SFP), which often signals a potential reversal to the upside. However, it is critical that $0.03441 holds, as this has proven to be a significant level of support in the past.
Wave B Analysis
At this point, I am uncertain about the exact corrective structure of Wave B. For now, I am assuming a standard Zig-Zag Correction until proven otherwise. Wave B usually retraces to the 0.50 Fibonacci level, with a target price of $0.03866.
This level has strong confluence for several reasons:
It aligns with a previous point of control.
Just above it sits Weekly Resistance at $0.03944, which will likely serve as a significant barrier.
The EMAs in this range could converge to form a strong resistance zone, potentially marking the end of Wave B and setting the stage for Wave C.
Wave C Analysis
Looking ahead, my target for this correction remains, targeting the 0.786 Fibonacci level at $0.02794. If you refer to the Weekly chart an text book A-B-C correction down to this level seems quite obvious, with Wave C forming a lower-low from Wave A on a higher time frame.
In addition to the above considering the depth of Wave A, a retracement to 0.786 fib level seems plausible. Furthermore, I anticipate Bitcoin revisiting prices below GETTEX:87K which will likely be the catalyst for dragging Gala down to the lower levels.
Bitcoin dominance remains stubbornly high, I would hope to see this fall off a cliff soon as all the metrics are lining up for Altcoin Season except for Bitcoin Dominance. These broader market metrics strengthen the case for Wave C to reach the $0.02794 target.

Gala Last ChanceGala is trapped in a rectangle after its 2021 growth. It seems that after a couple of failed attempts, we will see Gala grow again.
