GALA - Pump During Gaussian Bear PhasePrice is experiencing a bear channel on the Gaussian channel, however this is the best time to pump.
GALA will follow all altcoins during this alt bull pump cycle.
Horizontal Support is Evident.
GALAUSDT trade ideas

#GALA #USDT Short Set UpOn 1H TF looks like it will continue downtrend. Took short at current price.
Entry 0.03331
Stoploss 0.03769
TP-1 0.02927
Tp-2 0.02589

"GALA Ignites the Bulls: A Daily Surge Unfolds"From the point marked with the red arrow on the chart, we observe the beginning of what appears to be a developing pattern in GALA. The structure suggests the formation of a diametric, a rare and complex pattern, and the price is currently advancing toward completing the E wave within this structure.
As long as GALA stays within the boundaries of the green range highlighted on the chart, the potential targets shown remain in play. Each target is clearly defined, and price movement towards these points is anticipated, as outlined in the image.
However, if the price closes a daily candle beneath the specified invalidation level, this would invalidate the current analysis, signaling that the diametric pattern may no longer be in effect.
To manage risk effectively, it’s essential to employ sound capital management strategies. Set your stop loss appropriately and be mindful of your exposure. As we approach the first target, it’s wise to lock in some profits. At this point, adjust your stop loss to the entry price to secure gains and minimize potential losses.
Feel free to ask any questions in the comments if something is unclear or if you'd like further clarification.
Thank you for your time and attention, and as always, trade wisely!"

#GALA/USDT Ready to go up#GALA
The price is moving in a descending channel on the 30-minute frame and sticking to it well
We have a bounce from the lower limit of the descending channel, this support is at 0.03300
We have a downtrend on the RSI indicator that is about to be broken, which supports the rise
We have a trend to stabilize above the moving average 100
Entry price 0.03400
First target 0.03566
Second target 0.03780
Third target 0.04040

GALA is bullish (1D)From where we placed the red arrow on the chart, it seems that the GALA pattern has started.
The pattern seems to be a diametric, now it looks like GALA is going to complete the E wave of this diametric.
It can go to the targets on the picture while maintaining the green range.
The targets are listed on the chart.
Closing a daily candle below the invalidation level will violate the analysis.
For risk management, please don't forget stop loss and capital management
When we reach the first target, save some profit and then change the stop to entry
Comment if you have any questions
Thank You

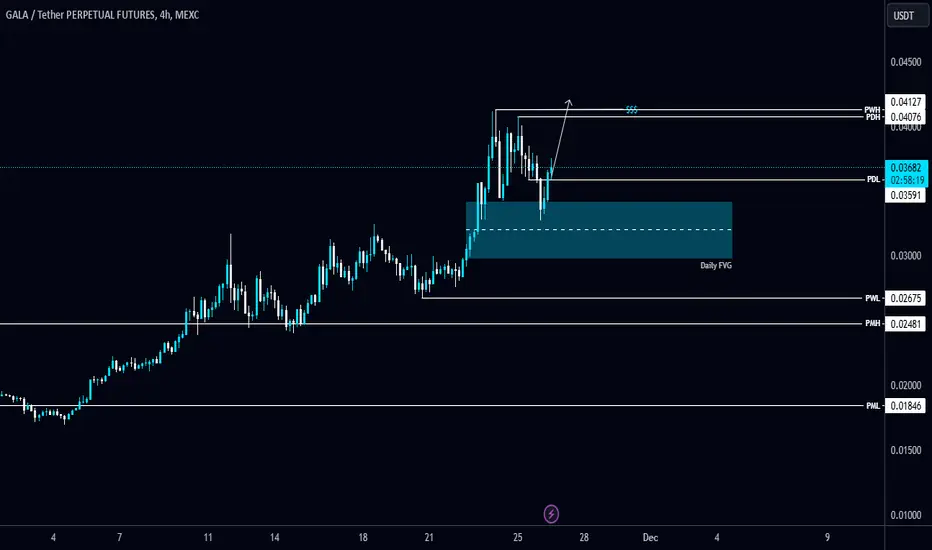
#GALA/USDT tapped the daily FVG and bounced hard.#GALA/USDT tapped the daily FVG and bounced hard.
Expecting a buy-side liquidity to be taken. The local resistance level is PWH $0.02127 and the support level is PMH $0.02481.
GALA short updatewell you see if it keeps respecting this trend line from the 6 hr timeframe it can go up to the 1.618 which you see the target but that will take a few days maybe but it is a good time now to go long and then take again profit around that level we had before. Cause you see it did build some higher lows there and should go up even more and if you hold longer and move your stop loss accordingly you can ride maybe till this 1.618. If you see the trendline break get out of the trade and take your profits. Hope this helps.

GALA TRADE ENTRIESGALAUSDT is doing nice moves and it has given 15% from to me from last chart. Now i will look for another Long position in it below the SSL in FVG. It has done MSS as mentioned on the chart. Entry will be from FVG zone and if price comes down then I will do DCA at marked Dca zone.

#GALA/USDT Ready to go up#GALA
The price is moving in a descending channel on the 30 frame and sticking to it well
We have a bounce from the lower limit of the descending channel, this support is at 0.03655
We have a downtrend, the RSI indicator is about to break, which supports the rise
We have a trend to stabilize above the moving average 100
Entry price 0.03811
First target 0.039030
Second target 0.04021
Third target 0.04145

will gala make the best?Hello,
Today we have BINANCE:GALAUSDT.P , will it do it?
And we see a rise to 0.13.
Or do we settle for a rise to 0.06?
Or even the failure of both areas? We'll see.

#GALA/USDT Ready to go up#GALA
The price is moving in a descending channel on the 30-minute frame and sticking to it well
We have a bounce from the lower limit of the descending channel, this support is at a price of 0.02817
We have a downtrend, the RSI indicator is about to break, which supports the rise
We have a trend to stabilize above the moving average 100
Entry price 0.02820
First target 0.03000
Second target 0.03148
Third target 0.03295

GALA is bullishGaming token GALA is great prospect in this bull cycle.
As it is way far from its all time high and has broken the consolidation triangle.
Entry 0.02639
Target 0.03531
Stop 0.01675
BINANCE:GALAUSDT

Gala Cypher pattern on weekly, Bull RunThe perfect cypher pattern on weekly printed for Gala, Im ready for a massive move up, in this bullish market

#GALA/USDT Ready to go up#GALA
The price is moving in a descending channel on the 1-hour frame and sticking to it well
We have a bounce from the lower limit of the descending channel, this support is at 0.02811
We have a downtrend, the RSI indicator is about to break, which supports the rise
We have a trend to stabilize above the moving average 100
Entry price 0.02895
First target 0.03010
Second target 0.03148
Third target 0.03296

GALA: another awakening patternIt's amazing when you see around so many ascending triangle, it means cryptomarket is awakening and altseason is beginning. Some could say the break out already happened but I think it didn't yet, I'd feel more confident when I'll see a candle closing over this zone. I think it's still a relatively safe zone to buy. Even if this retraces it won't be for long.
Crypto gaming will be huge, be sure to have something in your bag.
Weekly also looks good:
Good luck

#GALA/USDT#GALA
The price is moving in a descending channel on the 1-hour frame upwards and is expected to continue
We have a trend to stabilize above the moving average 100 again
We have a downtrend on the RSI indicator that supports the rise by breaking it upwards
We have a support area at the lower limit of the channel at a price of
0.02500
Entry price 0.02550
First target 0.02715
Second target 0.02839
Third target 0.02994

$GALA - Bullish Wedge BreakoutDino-coins such as CRYPTOCAP:XRP and CRYPTOCAP:ADA have started to move.
If you missed those, watch for the next potential movers.
GALA is coiling up and is forming a bullish wedge pattern and looks primed for a breakout.
Price is now trading above ema200 on the daily chart.
If GALA gains momentum, it could reach its March 2024 high of $0.08
Possible Targets:
$0.0375
$0.0502
$0.0536

GALA is bullish (12H)Looks like GALA is Bullish. We have iCH on the chart.
An important trigger line has been broken and is consolidating on the SWAP range.
Closing the daily candle below the invalidation level will violate this analysis.
Do not enter the position without capital management and stop setting
Comment if you have any questions
thank you

Let the GAMES BEGINIt’s time.
Buy.
Hold.
The market is moving.
Don’t get caught buying someone else’s bag at a higher price. This bull cycle is going to get crazy and if you don’t have your bags packed before this ✈️ takes off, you’ll be buying at .20 and I’ll be taking profits…before holding till .50…then taking more profits while you finally decide to buy.
$1 is going to be child’s play when the markets get moving. All the money is going into BTC, ETH, SOL… but gaming and A.I is the next revolution.
Get in early and thank me later.

GALA bullishBINANCE:GALAUSDT
Gala is currently at a zone that has proven itself as strong support and resistance. It’s a very solid area, and the price is now attempting to break through. The first candle failed to break it, and now the second candle is trying. If we manage a daily close above this zone, Gala could push up to $0.04, then to $0.05
Trade carefully
this is just the technical side
Keep an eye on the news

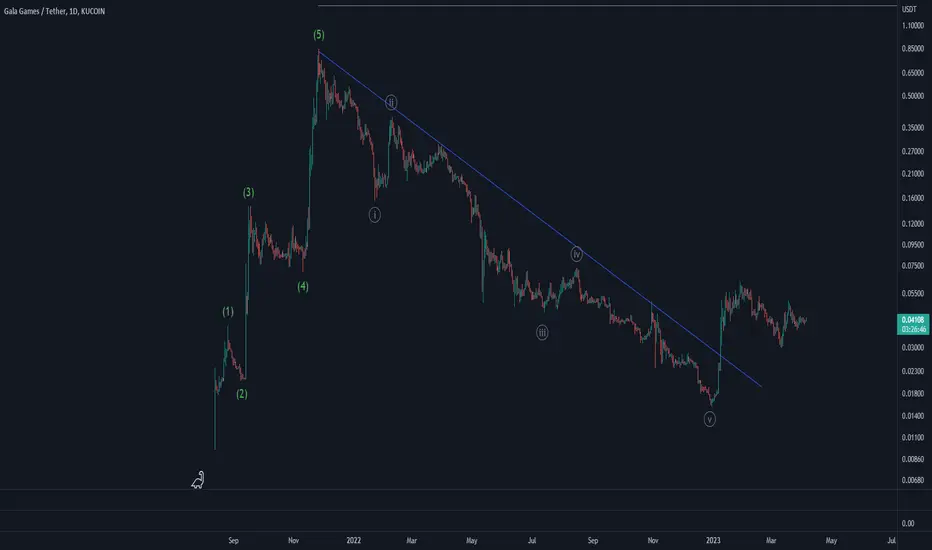
GALA (Gala Games)Gala analysis is straightforward. An upward move with 5 impulse waves followed by a downtrend move unfolded in 5 waves (not so sure about the corrective waves count) and then price breaking the downtrend line. It is upward time unless something strange happens like a very negative fundamental news about Gala. Let's see what happens.
GALA MINIMUM 3XThe crypto boom has just begun and with BTC making new ATHs i have decided to start sharing some of my personal crypto plays for this cycle. The gaming space is like an untapped market in crypto and with GALA being heavily beaten down, i think a comeback is in the cards with a minimum return of 3x in this cycle but depending on how hot things get we may see alot more than that. 👀
The risk to reward ratio here is extremely appealing, best of luck!

#GALA\USDT#GALA
The price is moving in a descending channel on the 4-hour frame upwards and is expected to continue
We have a trend to stabilize above the moving average 100 again
We have a descending trend on the RSI indicator that supports the rise by breaking it upwards
We have a support area at the lower limit of the channel at a price of 0.01900
Entry price 0.01960
First target 0.02100
Second target 0.02210
Third target 0.02379
