GALAUSDTGALA ~ 1W
INDEX:GALA This is the support block that has been holding the price from falling lower.
If you still have Conviction on this coin. do the buying in stages here. With a minimum target of 20%++. This is a very good buy with lower risk
GALAUSDT trade ideas

GALA GALAUSDT.P SHORT I am taking profit on low resistance target it was on bearish trend since 2 days ago

#GALA/USDT is taking the Trendline liquidity in Daily TF!#GALA/USDT is taking the Trendline liquidity in Daily TF!
INDEX:GALA is heading towards the Daily Bullish Order Block. We can look for long at that level. #GALAUSDT local resistance level is PMH $0.02481.

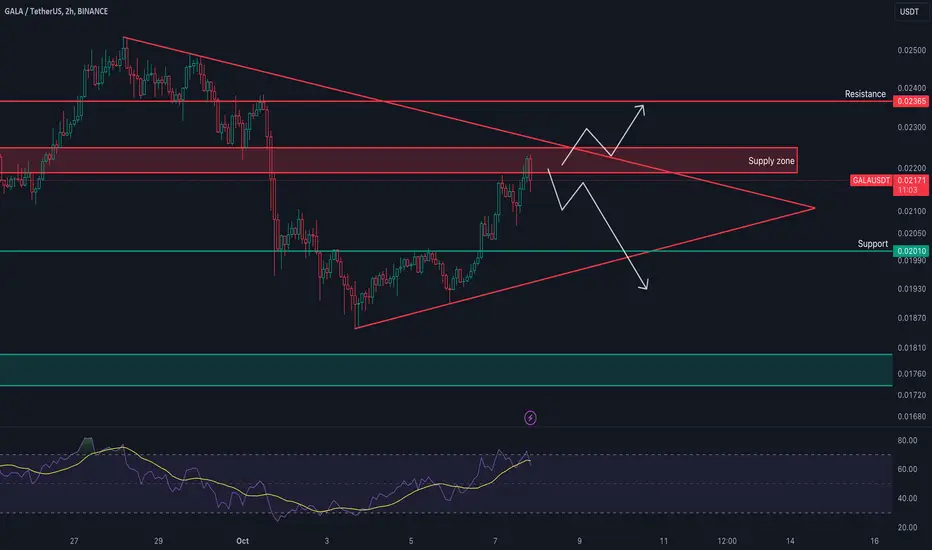
GALAUSDT.P / LONG / M15GALAUSDT may rise from the Support
Support Level: 0.02071 and 0.02054
The price may increase from the specified support level. After a retest, the previous resistance has shifted to act as a support zone. Let's monitor how the price reacts here. I used the support and resistance strategy to analyze this chart.
GALAUSDT.P / LONG / M15
LEVERAGE :- 75X
Entry Price :- 0.02091
Take Profit :- 0.02136
Stop Loss :- 0.02046

Galausdt Trade opportunityGALAUSDT concluded a significant bearish descent, completing 5 legs, and is poised for a potential corrective ABC phase, aiming upward.
Our plans involve entering the market for the uptrend ride. Consider acquiring some positions at the current price, anticipating a probable price decline to add more at the Buyback zone.
Place stop loss as indicated on the chart. Grateful for your support, wishing you a great day..


Gala long can be preparedOn the 4-hour time horizon, at the macd cross, it will be possible to enter long into Gala, then on the 1-hour horizon, you can follow it until the next macd 0.00 cross. It is important that the MACD macd line crosses 0.00 to open a position. It is invalid without trade crosses.

You have to wait for the GalaWe are currently waiting for macd and rsi to do something with themselves in the 4-hour time plane. Possibilities: macd crosses upwards, then the position can be kept up until the 15-minute macd 0.00 cross, and if the rsi line crosses 50 downwards on the 4-hour time plane, then the chart can be followed downwards, until the 15-minute macd 0.00 cross. If one is fulfilled, we go up, if the other, down. Now we are still waiting to see where to go next.

You have to wait for the GalaWe are currently waiting for macd and rsi to do something with themselves in the 4-hour time plane. Possibilities: macd crosses upwards, then the position can be kept up until the 15-minute macd 0.00 cross, and if the rsi line crosses 50 downwards on the 4-hour time plane, then the chart can be followed downwards, until the 15-minute macd 0.00 cross. If one is fulfilled, we go up, if the other, down. Now we are still waiting to see where to go next.

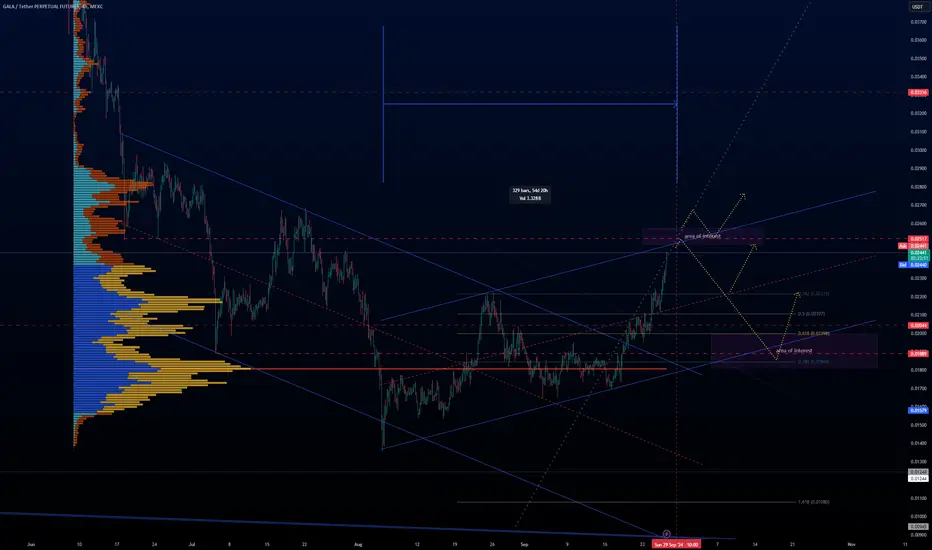
Alikze »» GALA | Wave 3 or C scenario - 8H🔍 Technical analysis: Wave 3 or 3 scenario in the ascending channel
- In the 8H frame, it is moving in an ascending channel.
- So far, a movement cycle AB=CD within the ascending channel has grown to the size of 0.78 fibo.
- After that, it had a corrective cycle up to the green box range, which has met with demand again.
- Currently, it is in the middle of the channel, which can continue its growth by breaking it up to the limit of the first supply area (the ceiling of the channel).
💎 After that, if it has a soft and zigzag correction, it can continue its growth with a bullback to the broken structure (minor ceiling) in the ascending channel until the second supply area as wide as the first channel.
⚠️Note: In addition, if the current price enters the corrective phase and touches the Invalidation LVL area, the bullish scenario is invalidated and must be reviewed and updated again.⚠️
»»»«««»»»«««»»»«««
Please support this idea with a LIKE and COMMENT if you find it useful and Click "Follow" on our profile if you'd like these trade ideas delivered straight to your email in the future.
Thanks for your continued support.
Best Regards,❤️
Alikze.
»»»«««»»»«««»»»«««
BINANCE:GALAUSDT

#GALA/USDT#GALA
The price has broken the descending channel on the 1-hour frame. To the upside and is expected to continue
We have a trend to stabilize above the moving average 100 again
We have an upward trend on the RSI indicator that supports the rise by breaking it to the upside
We have a support area at the lower limit of the channel at a price of 0.01860
Entry price 0.01950
First target 0.02125
Second target 0.02323
Third target 0.02500

GALA intent to go UP is obvious now.GALA went up generously this past few hours -- conveying its intent to reverse to the upside based on the daily data.
This is huge. Daily data doesn't change mind often, so this is a good hint already.
Expect some more than average moves to the upside from the current levels.
Spotted at 0.030
TAYOR.
safeguard capital always.

GALAUSDTSince both rsi and macd crossed upwards on a weekly time plane, and on the one-day time plane the chart is already above the 50 ema, while both rsi and macd have already crossed the middle line, so I have now started my second position in the medium term. This means that I hold the position until the 4-hour macd 0.00 cross, or if I follow it on an hourly time plane, then until the 1-hour death cross. Since the environment is quite bullish, I assume that in the coming weeks he will do the golden cross on the 1-day time plane, which will result in a spectacular gap in terms of the chart. I don't see shorts. I would also welcome the insight of others in case my conclusions do not hold up and I need to rethink my position.

GALA is looking bearish on the USDT chart. It has formed a beariGALA is looking bearish on the USDT chart. It has formed a bearish flag, which is a technical analysis pattern that suggests a continuation of a downtrend. The price has broken down from a rising wedge pattern, which is another technical analysis pattern that suggests a reversal of an uptrend. These patterns are often used by traders to identify potential entry and exit points in the market. Based on these patterns, the price target for GALA is 0.008 USDT, which is the 1.618 Fibonacci retracement level of the previous uptrend.
A bearish flag is a rectangular consolidation pattern that forms after a sharp decline in price. The upper and lower boundaries of the flag are parallel lines. The price typically trades sideways within the flag for a period of time. A breakdown below the lower boundary of the flag signals a continuation of the downtrend.
The bearish flag pattern in the GALA USDT chart suggests that the downtrend that began in September is likely to continue. The price has broken down from the lower boundary of the flag, and there is no sign of a reversal. The price target of 0.008 USDT is based on the 1.618 Fibonacci retracement level of the previous uptrend. This level is often used by traders to identify potential support and resistance levels.
A rising wedge is a triangular consolidation pattern that forms after an uptrend. The upper and lower boundaries of the wedge converge as the price moves higher. The price typically trades sideways within the wedge for a period of time. A breakdown below the lower boundary of the wedge signals a reversal of the uptrend.
The rising wedge pattern in the GALA USDT chart suggests that the uptrend that began in August is likely to reverse. The price has broken down from the lower boundary of the wedge, and there is no sign of a reversal. The price target of 0.008 USDT is based on the 1.618 Fibonacci retracement level of the previous uptrend. This level is often used by traders to identify potential support and resistance levels.
It is important to note that technical analysis is not a guarantee of future price movements. It is simply a tool that can be used to identify potential trading opportunities. Traders should always do their own research and consider other factors before making any investment decisions.

DownSelling over bought in a down trend, quick fall to target in 1-2 days else just wait will it hit tp or sl


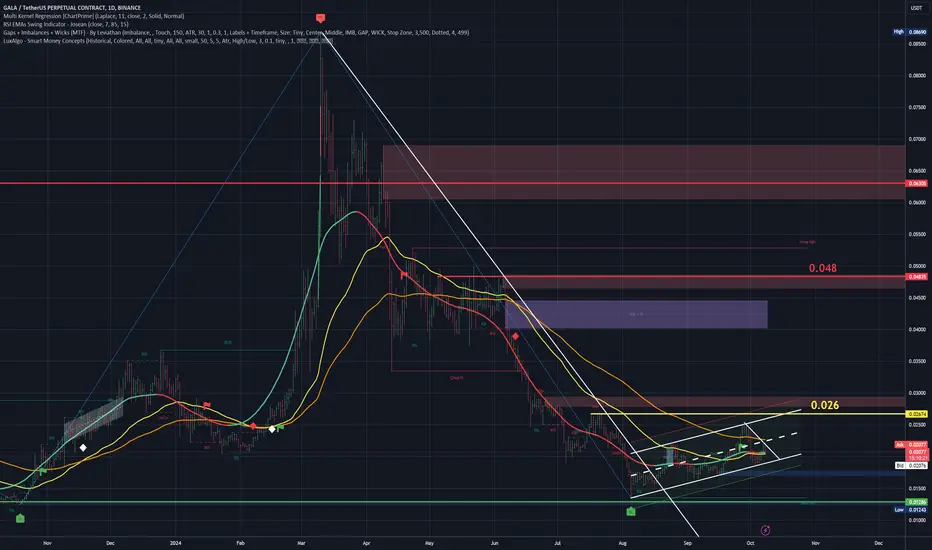
GALAUSDT 1D - Bullish ChannelGALAUSDT 1D - Bullish Channel
GALA, after making lows at 0.0135, is developing a bullish channel with rising highs and rising lows.
It is an interesting value to follow in a trend because it tends to be constant.
The strategy to follow will be to buy at the base of the channel and take profits in the 0.026 area where it has a clear resistance. Now, at the moment it is in a consolidation area so we have to be attentive and respect the SL to protect our investment.
It is likely to continue its trend looking for 0.026, but it is still below the EMA-100 so it can easily turn around.
To confirm that it has bullish strength, we should expect a cross of EMA-50 and EMA-100 and for the value to fluctuate on both EMAs.
LEVELS:
SL: 0.017
TP1: 0.026
TP2: 0.048
All these strategic alternatives can be configured with TradeX BoT, since it will allow you to position in both directions without having to block any amount per position. It will only be necessary for the conditions to be met, either downwards or upwards, for the orders to be executed in one direction or the other, taking the necessary deposits from your wallet.
TradeX BoT (in development): Tool to automate trading strategies designed in TradingView. It works with both indicators and graphic design tools: parallel channels, trend lines, supports, resistances... It allows you to easily establish SL (%), TP (%), SL Trailing... multiple strategies in different values, simultaneous BUY-SELL orders, conditional orders.
This tool is in the development process and the BETA will soon be ready for testing.
FOLLOW ME and I will keep you informed of the progress we make.
I share with you my technical analysis assessments on certain stocks that I follow as part of the strategies I design for my portfolio, but I do not recommend anyone to operate based on these indicators. Get informed, train yourself and build your own strategies when it comes to investing. I only hope that my comments help you on your own path :)
Reverse Head And Sholders on GALA - $GALA #GALA #GALAUSD #GALAUSA nice reverse head and shoulders but although the nice formations, I feel something is not right. INDEX:GALA #GALA #GALAUSD #GALAUSDT

GALA USDT- CLICK HERE TO CHECK FULL ANALYSISThe breakout of the triangle will decide the direction, RSI is also in the overbought region.
GALAUSDT LONG IDEAA very clear and beautiful accumulation structure.
The coin found support at the level of 0.016-0.013 cents. If the price falls below the “red circle” the scenario requires revision. All targets are indicated on the chart.

#galausdt LON🚀🚀🚀 Better put your sealtbelt on!! We have a completed correction of more than 80%. with that Wave 2.... It may take a few weeks, but we're going there... Currently oversold on multiple timeframes! NFA!!

GALA short term outlookGALA pushing up in this ascending wedge.
Looks to be reaching a point where it should lose momentum and retrace a bit.
Potential to take some profits if in a long trade here and add on should price retrace a bit.
Key areas will be when price returns to key support areas around midchannel and at the lower bounds of the channel.
Potential long entry around 0.01844 area with invalidation at previous low (0.01358).
Bullish scenario could be if price were to get above the current resistance and flip to support.
GALA SHORT IDEAGALA has reached to 4h supply and shown engulfig.I can see a FO from a CP so i open Short position on galausdt.
enty:0.02160
tp1:0.02044
tp2:0.01810
sl:0.02252
r/r:3.8
