GALA: Hyper-Bullish Breakout!Have you noticed GALA’s impressive surge lately? The recent breakout from the resistance zone (Green) at $0.04032 - $0.04144 is signaling that momentum is rapidly increasing, with the next critical level just ahead. The question remains: Will GALA settle for a bullish trend, or are we on the brink of a hyper-bullish surge? Let’s explore further!
GALA has not only moved beyond the resistance zone (Green) at $0.04032 - $0.04144 but has also reclaimed a significant structural level that has previously served as both support and resistance. With prices now above this level, bulls have laid a strong foundation for future growth.
Currently, GALAUSDT is testing a descending trend line, which it has been below since early December. This is a crucial area to monitor! A breakout above this trend line could lead to a series of breakouts, often indicating significant bullish strength on the horizon. If the bulls manage to overcome this trend line, it could be a game-changer.
Upon clearing the resistance, GALA is likely to target the next resistance zone (Pink) at $0.05271 - $0.05413. However, if the momentum remains strong, we might see GALA push even higher towards the next resistance zone (Blue) at $0.06288 - $0.06483, which is often associated with considerable profit-taking. Traders should exercise caution at this level, as it has historically attracted sellers.
GALAUST trade ideas

#GALA/USDT#GALA
The price is moving in a descending channel on the 1-hour frame and is expected to continue upwards
We have a trend to stabilize above the moving average 100 again
We have a descending trend on the RSI indicator that supports the rise by breaking it upwards
We have a support area at the lower limit of the channel at a price of 0.03800
Entry price 0.03856
First target 0.03927
Second target 0.04045
Third target 0.04163

GALAUSDT: Bullish TrendAfter the down trend, GALA is moving in Accumulation Phase (Side Ways) and we will expect that GALA will break the this Phase and making HHs and HLs, So for the bullish confirmation we will wait for the break of the Accumulation Phase to take a long trade with proper risk management.

GALA Bulls Must Watch This Level—A Major Move Is Coming!Yello, Paradisers! Have you been watching #GALA’s explosive move? The recent breakout from the ascending triangle pattern is sending a clear message—momentum is heating up fast, and the next pivotal level is right around the corner. But will GALA stop at just being bullish, or are we about to see it shift into hyper-bullish territory? Let’s dive in!
💎#GALAUSDT is now heading straight for a critical descending resistance zone around $0.04600. This is the level to watch! A breakout above $0.04600 would trigger a breakout after breakout setup—something that often signals major bullish strength ahead. If the bulls can smash through this level, it’s a game-changer.
💎GALA will likely be targeting $0.054 to $0.056 after clearing the resistance. But if the momentum stays intact, expect GALA to make a run higher for $0.06660, where we see the next big cluster of profit-taking. The $0.06660 to $0.07000 zone is where traders should be cautious, as this level historically brings out sellers.
💎Not only has GALA broken above its pattern, but it’s also reclaimed a major structural level between $0.0395 and $0.0410—a key zone that has acted as both support and resistance in the past. With price now holding above this level, bulls have established a solid base to build on. Below this, we see a layer of ascending and horizontal support, giving GALA strong protection on the downside.
Paradisers, this setup is looking very promising—but don’t forget, discipline and patience are key in this market.
MyCryptoParadise
iFeel the success🌴

Market Remains Ambiguous: Gala Looks Good To Go. But is it?Before diving into Gala's current movement, it’s crucial to establish this foundational point: Wave 3 is only confirmed when the price breaks the high of Wave 1, which is $0.06667. Until that milestone is reached, any analysis remains speculative.
Previous Analysis Recap
In an earlier idea, we tracked a WXY correction with the Y wave targeting $0.02761 (0.786 Fibonacci level). However, after the Y wave played out for a few days, it became clear that we were correcting within a descending triangle. This pattern suggested the possibility of price movement in either direction.
While I anticipated a downward movement for Bitcoin and Gala, I was also prepared for an upward bounce.
Why I Anticipated a Downward Move?
Bitcoin's Unfinished Correction: In my Bitcoin analysis, I noted that Bitcoin likely hasn’t completed its full correction. During the last bull run, Bitcoin Dominance collapsed during Wave 4 corrections, paving the way for altcoin season. That hasn’t occurred yet, as Bitcoin Dominance remains high. A further price drop would align with the completion of this correction.
Shorter Corrections Are Unlikely: Historically, Bitcoin’s Wave 4 corrections have been deeper and longer, lasting around three months in the previous cycle. At present, Bitcoin’s correction is only 3.5 weeks in, suggesting more time may be required.
Current Developments
Instead of a deeper correction, Gala’s price bounced upward, potentially extending the overall corrective phase. While this could lead to further upward movement, it doesn’t entirely rule out the possibility of additional downside later.
Momentum Indicators Turn Positive:
Gala has already undergone a significant correction, nearly reaching the 0.786 Fibonacci level. Daily RSI indicators suggest there is enough momentum for the price to climb higher - A potential X wave could target $0.04407.
Future Scenarios:
I am open to this being Wave 3, but I am also open to this correction extending to a WXYXZ correction (they can go on forever technically). I can't predict where the X wave will end, and how deep the Z correction will be until X is complete.
However, for Wave 3 confirmation, Gala must surpass $0.06667. It’s worth noting that the X wave could climb as high as $0.06600 and still remain part of a corrective structure.
Perspective and Patience
This analysis serves as a reminder to maintain perspective. While the allure of immediate resolution is tempting, markets often operate on longer timeframes. Bitcoin’s current correction phase is relatively young compared to historical patterns, and this may apply to Gala as well.
Final Thoughts
At this stage, the market remains ambiguous, and interpretations may evolve as new data emerges. The charts provide valuable insights, but certainty is only achieved in hindsight. For now, tracking key levels will be critical to understanding Gala’s next significant move.
Stay flexible and prepared for either scenario as the market unfolds.

Gala- 4h - Accumulation RangeREMEMBER that a lot of investors sell stocks or crypto for fiscal conditions in 2024 to close the year.
For that, we have low buy liquidity , and even with that pressure on the price , GALA is trying to remanin in the same range as 1 week ago, so a breakout can restart a new HH , so patience.
Im bullish on it if the 0.041usd resistance its broken and became a support.

#GALA (SPOT) IN (0.025- 0.036) T.(0.24) SL(0.024)BINANCE:GALAUSDT
#GALA / USDT
Entry (0.02500- 0.03600)
SL 1D close below 0.02400
T1 0.09900
T2 0.15000
T3 0.18000
T4 0.24000
3 Extra Targets(optional) in chart, if you like to continue in the trade with making stoploss very high.
______________________________________________________________
Golden Advices.
********************
* collect the coin slowly in the entry range.
* Please calculate your losses before the entry.
* Do not enter any trade you find it not suitable for you.
* No FOMO - No Rush , it is a long journey.
Useful Tags.
****************
My total posts
www.tradingview.com
1Million Journey
www.tradingview.com
www.tradingview.com
**********************************************************************************************
#Manta #OMNI #DYM #AI #IO #XAI #ACE #NFP #RAD #WLD #ORDI #BLUR #SUI #VOXEL #AEVO #VITE #APE #RDNT #FLUX #NMR #VANRY #TRB #HBAR #DGB #XEC #ERN #ALT #IO #ACA #HIVE #ASTR #ARDR #PIXEL #LTO #AERGO #SCRT #ATA #HOOK #FLOW #KSM #HFT #MINA #DATA #SC #JOE #RDNT #IQ #CFX #BICO #CTSI #KMD #FXS #DEGO #FORTH #AST #PORTAL #CYBER #RIF #ENJ #ZIL #APT #GALA #STEEM #ONE #LINK #NTRN #COTI #RENDER #ICX #IMX #ALICE #PYR #PORTAL #GRT #GMT #IDEX #NEAR #ICP #ETH #QTUM #VET #QNT #API3 #BURGER #MOVR #SKL #BAND #ETHFI #SAND #IOTX #T #GTC #PDA #GMX #REZ #DUSK #BNX #SPELL #POWR #JOE #TIA #TFUEL #HOT #AVAX #WAXP #OGN #AXS #GALA

Is GALAUSDT Setting Up for a Bullish Breakout?Yello, Paradisers! Are we on the brink of a major bullish move for GALAUSDT, or is more downside on the horizon? Let’s dive into the latest analysis to help you prepare for what’s coming.
💎GALAUSDT has been consolidating in a descending channel, signaling a healthy retracement. This structure increases the probability of a bullish reversal—if key conditions are met.
💎If the price triggers an inducement and begins forming bullish patterns—such as a bullish I-CHoCH, W pattern, or inverse head-and-shoulders—at the key support zone, the likelihood of a strong upward move will significantly increase.
💎In the case of deeper retracement, we’ll look for a bounce off the strong support zone. However, confirmation is key. Keep an eye on patterns like the bullish I-CHoCH, W formation, or inverse head-and-shoulders to validate the bullish case.
💎If GALAUSDT breaks down and closes a candle below the strong support zone, the bullish outlook will be invalidated. In this scenario, patience will be critical—it’s better to wait for more favorable price action to form before making a move.
💎Discipline and risk management are essential in navigating markets like this. Remember, Paradisers, trading isn’t about predicting—it’s about reacting smartly to what the market shows us.
🎖Play it smart, stay patient, and wait for the best opportunities. Success in crypto is a long game, not a quick sprint! Stay disciplined, and you’ll already be ahead of the majority.
MyCryptoParadise
iFeel the success🌴

The Moment of Truth - Gala's Bottom Could Be InWe are at a pivotal moment. After reviewing my charts, I want to revisit my previous analysis where I illustrated that Gala is currently in a WXY correction, with the Y wave unfolding. Initially, I expected the Y wave to develop as a Zig-Zag correction, but as time has passed, it appears more like a descending triangle. Whilst a descending triangle is considered bearish, in context to the overall correction it could also be considered a consolidation pattern signaling a pending bullish breakout into Wave 3.
Right now, price action is nearing the apex of the triangle, which means a decisive move—up or down—should occur imminently. For this reason my bias has now changed to neutral and I am looking for a bullish or bearish signal to happen.
Bullish Case
Price is currently struggling beneath the 26-day and 50-day EMAs, creating diagonal resistance. For a bullish scenario we are looking for a clear break above these EMAs on the 4-hour chart would provide a reasonable signal that the Y wave is complete and that bullish momentum may be returning.
That said, a WXY correction is inherently complex and could morph into another X wave followed by additional corrective patterns. In such a scenario, an upward impulse might still emerge, but the structure would need to be reevaluated.
Bearish Case
On the downside, price needs to decisively break below $0.03454 to confirm further bearish movement. This level has held as support so far, but the situation remains precarious.
Key points to watch:
The 200-day EMA on the daily chart is around $0.0314. A sustained close below this level would be highly bearish and signal deeper corrections ahead.
A descending triangle, if confirmed, is traditionally a bearish continuation pattern. The measured move from the height of the triangle would target the 0.786 Fibonacci level at $0.02794.
Additionally, order book analysis on Binance reveals significant buy orders clustering around $0.026 and $0.025. While this shows strong demand at lower levels, it also highlights that many market participants are anticipating further downside. This doesn’t guarantee a drop to those levels, but it’s something to keep in mind.
Summary
At this point, I’m adopting a neutral bias.
A breakout above the triangle and EMAs would prompt me to consider entering the market, as it would signal the completion of the corrective phase.
Conversely, a breakdown below $0.03454, especially with daily or 4-hour candle closes under the 200-day EMA ($0.0314),** would signal a bearish continuation, and I’d prepare to fill positions near my targets around $0.02794 or lower.
If I had to speculate, I’m leaning toward the possibility of a flash crash. Here’s why:
If the price is to break down, I would not want it to stay below $0.0314 for long.
A candle close below this level on the daily chart, or even prolonged trading under it on the 4-hour, would place price action below the 200-day EMA. This is highly unusual for a bull market and could signal a deeper correction.
That said, markets can surprise, and we’ll likely have clarity within the next 24 hours. Until then, I’m watching closely and staying flexible. Let’s see how this unfolds.

Watch The Bullish PatternsThe inverted head and shoulder and double bottom patterns are forming starting from orange.
The orange pump will lead to yellow pattern completing and pump.
The retrace and pump of yellow will lead to white pattern completing and pump.
Orange - Inverted H&S
Yellow - Inverted H&S
White - Double Bottom + Inverted Cup & Handle

Gala Price Update – Still BearishWXY Correction:
Left chart confirms we're still in the WXY corrective structure.
Right chart shows price movement in a channel without WXY lines.
Channel Dynamics:
Price is oscillating in a channel, rejecting from the middle.
Key Support: 0.0342, repeatedly tested and holding for now.
Bearish Confirmation:
A close below 0.0342, followed by a backtest or direct collapse through the channel, signals further bearish bias.
Targets:
First Target: 0.02761 (786 Fib level).
Second Target: 0.02449 (weekly support).
Breakdown below 0.02962 (previous low) confirms a straightforward Y correction.
Technical Indicators:
4-hour timeframe is overbought, making it an ideal setup for a breakdown.
Market may remain slow, but a sharper move down would align with current bearish momentum.
An invalidation of my theory would be if price pumps and breaks above $0.040 this will require me to reconsider my bearish bias.

GALA - please tell me I'm wrongLooking at the 1D chart it "appears" to me that GALA has made a nice impulse down from the high 0.08702 in March/24 to the low in August. Then did a nice ABC for a 2nd wave pullback up to the resistance area but not quite to the meridian line but still a perfect 85% retracement.
So longterm it "looks" like GALA is in a wave 3 to the downside and I just make make a way to count this longterm positive. Can anyone show me a way? Please because I got a bunch of GALA in my hold bag. ha
My thoughts, not financial advice Oklah. Cheers

Revisiting Dec 23rd: The WXY Correction in PlayOn December 23rd, I shared my observation that Gala was still undergoing a correction. I proposed it might be following a WXY corrective pattern rather than a straightforward ABC correction ( see idea here ). The key distinction is that an ABC correction is a single structure, while a WXY correction consists of multiple corrective structures linked by an X wave, as illustrated above on the 4-Hourly Chart.
Following changes in price action on December 24th, I posted a bullish scenario for Gala. However, it now seems that my original WXY correction analysis from December 23rd is playing out after all—apologies for the premature bullish outlook.
What did I overlook? One metric that has consistently stood out to me on the weekly chart is the Stochastic RSI, which I’ve included in all my posts. It has remained bearish, and ideally, I would prefered it to drop into the oversold region before expecting the next leg up. While it isn’t a strict requirement, historical patterns strongly suggest that this should happen. In my last post, I reluctantly considered the possibility that this time might be different—but I now see that patience is a virtue and just a reminder to trade the charts.
The WXY corrective structure is clearly visible on the 4-hour chart, and I anticipate the following moves:
A drop to weekly support at $0.2961.
A potential further drop to either the 0.786 level at $0.2761 or lower support at $0.0249.
What’s Next?
We are in the final stages of this correction, and it is likely to conclude within the next 7–10 days. My bullish scenario from December 23rd still holds, but it was shared prematurely.
I am actually very happy to see the weekly RSI moving down to the oversold region, history shows that most big moves happen when the weekly is in the oversold region. With most coins being in the overbought area this has been an point of concern for me. I have illustrated this point in this idea - click here .

GALA: Channel Breakout to Golden Zone - 40% Upside TargetHere's a professional TradingView analysis for GALA/USDT:
Technical Analysis:
Key Levels:
🎯 Entry: 0.035 USDT
🎯 Target (TP): 0.050 USDT (+40%)
📊 Current Price: 0.035 USDT
📈 Volume: 90.38M
Pattern Structure:
• Trading within descending channel
• Double resistance confluence at target zone
• Channel breakout setup forming
Trade Setup:
1. Entry Setup:
- Entry at 0.0356
- Clear channel breakout formation
- Volume accumulation phase
2. Target Analysis:
- Primary target: 0.05
- Confluence with major resistance
- Potential 40% return from entry
3. Key Technical Factors:
- Descending channel boundaries clearly defined
- Wave pattern projecting upward movement
- Multiple timeframe confluence (4H chart)
Risk Management:
• Set stops below recent lows
• Risk:Reward ratio approximately 1:4
• Consider scaling in at entry zone
Timeframe:
• Chart: 4H BINANCE
• Target Timeline: Early January 2025
Note: This is technical analysis only. Always manage risk appropriately and DYOR.
#GALA #USDT #Crypto #TechnicalAnalysis #Trading

Breaking an important resistance Breaking an important resistance with low volume retesting the broken resistance

huge pump coming on gala gala is at support level and now going to break the trendline wait for breakout and then in coming days we will see gala at 0.066 and 0.11 as 2nd target buy at spot as much you can

GALA Going To 0.29$There’s one zone to buy GALA and HOLD it zone ( 0.03$ - 0.28) target 0.29$
What’s GALA Coin ?
—————————————-
GALA Coin is the native cryptocurrency of Gala Games, a blockchain-based gaming platform. Gala Games aims to revolutionize the gaming industry by giving players more control over the games they play, including the ability to own in-game assets and influence the development of the games themselves.
Here are some key aspects of GALA Coin:
1. Utility in Gala Games Ecosystem:
• GALA is used as the primary currency within the Gala Games ecosystem. Players can use GALA to purchase in-game items, NFTs, and other assets in Gala-powered games.
• It is also used for governance, allowing holders to vote on decisions related to the development of the platform and its games.
2. Decentralized Gaming:
• Gala Games is built on blockchain technology, meaning it allows for true ownership of in-game assets. These assets, such as NFTs (Non-Fungible Tokens), can be bought, sold, or traded on various marketplaces.
• Players can earn GALA coins by participating in games or contributing to the network in other ways, such as running nodes or supporting Gala Games’ decentralized ecosystem.
3. Play-to-Earn:
• Gala Games is part of the emerging “play-to-earn” (P2E) trend, where players can earn rewards (in GALA or NFTs) through their in-game achievements and participation.
4. Gala Node Network:
• Gala Games operates a decentralized node network, where individuals can run nodes to support the infrastructure of the Gala Games platform. Node operators are rewarded with GALA coins for contributing to the network.
5. Games on the Gala Platform:
• Gala Games has several titles within its ecosystem, including “TownStar” (a city-building game), “Mirandus” (a fantasy RPG), and others. These games often integrate GALA coins and NFTs for in-game transactions.
Overall, GALA Coin serves as a key element in Gala Games’ vision to create a decentralized gaming ecosystem, where players are incentivized to participate and contribute, and have real ownership of their in-game assets.

Sorry Guys, is Gala's Wave 2 Correction Really Over?Hey everyone! I know a few of you follow my ideas, so I thought I'd post this earlier rather than later—because I don't believe Gala's Wave 2 correction is over yet. After analyzing the price action and a few other key factors, I’ve re-evaluated my position, and things are pointing toward a more complex correction.
Corrections Are Like Driving at Night
Predicting corrections is tricky—it’s like driving at night. You plan your destination but can only see a couple of feet ahead at any given time. As the journey unfolds, your view becomes clearer.
Originally, I thought Gala had completed a straightforward ABC correction. But after reviewing Bitcoin's price action, Bitcoin dominance, and Gala's movement today, I believe we’re dealing with a more complex WXY correction.
What Is a WXY Correction?
In simple terms, it’s multiple corrective structures connected by smaller "X" waves:
Wave W: I believe this was Gala's first corrective wave, a zigzag (ABC correction).
Wave X: A smaller corrective wave that connects W to Y.
Wave Y: The next corrective structure, which could take the form of a zigzag, flat correction, or something else entirely.
I have highlighted this on the 4 hourly chart. I believe we have completed Wave W and I’m closely watching price action and looking for a good exit point around the top of Wave X.
Why Do I Think This?
Bitcoin Has More Downside Potential. I believe Bitcoin could revisit its previous ATH of ~$73K. If this happens, it will have a significant impact on all altcoins, including Gala. (Check out my BTC idea posted today for more details.)
BTC Dominance Signals Market Weakness
In November, Bitcoin dominance rejected off the 0.618 level—just like it did in 2021. That event led to a 31% correction on Bitcoin, and corrections across the market. This could repeat. (Refer to my BTC.D idea posted today.)
Overbought Stochastic RSI
Many altcoins (including Bitcoin) have an overbought stochastic RSI on the weekly chart with a bearish crossover - illustrated above. This signals bearish momentum and has been a nagging red flag for me.
Timing Aligns with a Complex WXY
If Bitcoin’s correction takes another week or two to play out, it aligns with the possibility of Gala completing a WXY correction. Gala already finished an ABC correction, so this scenario seems logical.
Targets
Here’s what I’m watching for:
Possible exit target for Wave X: Around $0.40–$0.42, I think price will probably baournce off one of the EMA's.
Wave 2 Retracement: Could go as low as $0.17 without invalidating Wave 1 however price targets for Wave Y:
Target 1: 0.786 Fib Level at $0.02760.
Target 2: Weekly Support at $0.02449.
I don't know if this is the actual go, but I felt it prudent to share my thoughts so you can at least have time to decide for yourself.
I am still bullish, if you read my Bitcoin Dominance idea we are definitely looking good for an altcoin season we just need clarity on what Bitcoin is going to do. It really is at a junction point, of either going up or going down.

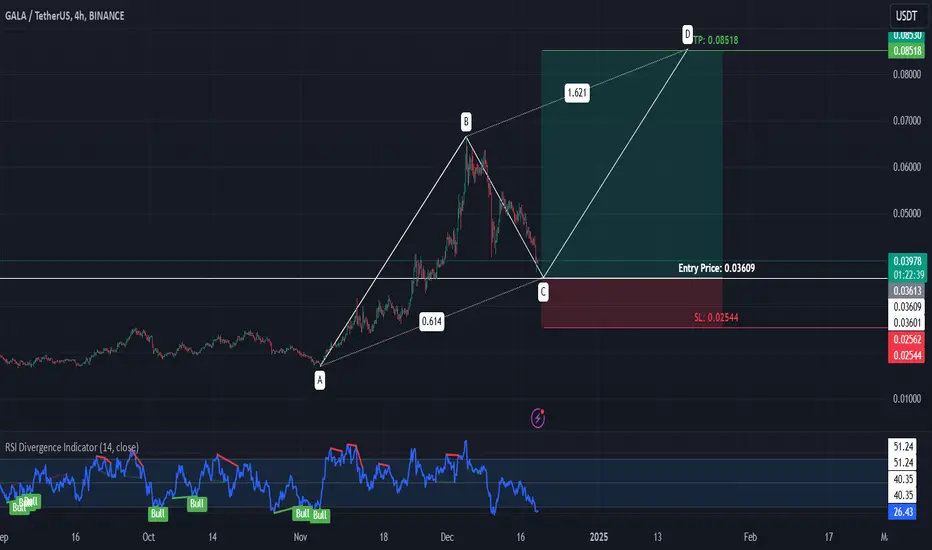
GALAUSDT: Bullish Trend (AB=CD Pattern)GALA is moving in down trend on short time frame, but on the 4hr time frame its making correction and forming AB=CD Pattern. If GALA is maintain on C point and making bullish divergence on any short time frame so its must be touch the D point, So we will wait and observe the Bullish Divergence on any short time frame with break of the LHs to confirmation of the bullish trend and take a long trade with proper Risk Management.
Technical Insights: Building the Bullish Case for GalaTechnical confirmation of Wave 3 will occur when the price breaks above the Wave 2 high of $0.06649, as shown in the 4-hour chart. Until then, I’ll continue building a bullish case while monitoring price action closely.
Bullish Indicators
To support my analysis, I’m using the daily timeframe as the higher timeframe and the 4-hour timeframe as the lower view. Here's what I'm seeing:
Daily Timeframe
Stochastic RSI: Oversold at 0.41, with the K line on the verge of a bullish crossover with the D line. This signals an opportunity for a potential long setup.
RSI: At 40.79, a favorable level for price interest to increase.
Fibonacci Confluence: The ABC correction has bounced at the 0.618 Fibonacci retracement level, a strong indicator of a potential reversal.
Note: The Rate of Change (ROC) currently shows bearish momentum at -28.38, likely reflecting the recent price drop. As momentum indicators are lagging, I’ll monitor this closely for a shift upwards as price momentum builds.
4-Hour Timeframe
Stochastic RSI: Oversold at 14.70, with the K line crossing the D line, forming a bullish crossover—an ideal entry signal for a long position.
RSI: Oversold at 27.28, with upward momentum signaling a potential short-term price spike, which would align with bullish momentum on the daily timeframe.
Positioning and Price Expectations
I have already bought in to Gala, and this review reinforces my bullish bias. While time will determine if we are indeed in Wave 3, the following price targets are based on traditional Fibonacci extensions and levels illustrated on the daily chart:
Target 1: 1.618 Fib Level — $0.11303
Target 2: Monthly Resistance — $0.13158
Target 3: 2.618 Fib Level — $0.16193
Given that Target 2 (monthly resistance) is slightly above the 1.618 Fib Level, it’s reasonable to expect price to wick toward this level before potentially settling at or below 1.618.
Final Thoughts
The crypto market is notoriously unpredictable, and no one can perfectly predict price targets. However, the levels outlined provide a solid framework for assessing the price movement during Wave 3. With five sub-waves within Wave 3, I’ll reassess and adjust as each unfolds to refine expectations.

Wave 3 Incoming? Why I’m Bullish on Gala’s Next MoveAfter closely tracking this correction since December 9th, I’m thrilled to share that my buy-in target of $0.03493 has been hit with near perfection. Throughout this period, I’ve carefully planned my exits and entries, which I’ve illustrated on my charts and shared as ideas in real-time.
By exiting and re-entering at key levels, I’ve been able to:
Protect my capital during the downturn.
Make some gains on the December 11th bounce.
Accumulate an additional 1.9 million Gala tokens on this re-entry – all without leverage.
At the onset, it’s always challenging to identify the exact type of correction we’re in. However, as the pattern unfolded, it became apparent that this was likely a Wave 2 correction, with price retracing to the 0.618 Fibonacci level. Historically, 70% of Wave 2 corrections retrace between 0.382 and 0.786, with only 15% going beyond that.
While there’s a possibility of further downside – especially as I remain short-term bearish on Bitcoin, which could drag alts lower – my priority is to secure a good price rather than aim for the absolute bottom.
Support Levels
Should the price dip further, key supports are:
200-day EMA: $0.03070
Weekly Support: $0.02959
0.786 Fibonacci Level: $0.02760
That said, I’m happy with my re-entry at this level and prepared to manage any downside.
Wave 3: The Opportunity
Wave 3 follows Wave 2 and is typically the most impulsive and exciting phase. Missing it while chasing a marginally lower entry is not a risk I want to take. Whether we’ve already completed the ABC correction or are in its final stages, I’m confident we’re transitioning towards something significant.
The next few days and weeks will be pivotal, and I’m excited to see how Gala performs from here. Let’s see where this journey takes us! 🚀

Recommendation to buy GalaDue to this last market flush, Gala returned to an important support region, but the buying force prevailed and gave us a great entry point with a stop at the last bottom.
Reasons for buying:
1 - Long-term uptrend.
2 - Breakout with pullback of a long-term uptrend line.
3 - Beartrap at an important support line.
4 - Great risk/return ratio with a trade at the next resistance.

Why I’m Holding Off on Entering GalaGala appears to have possibly put in its ABC correction, bouncing at $0.03719, which narrowly missed my 0.618 Fibonacci target of $0.03592 from my previous analysis. I have a buy order placed at $0.03493, and the price has since rebounded to $0.040, a level that has acted as a point of support for some time.
What’s Next?
This level could mark the bounce area, but I’m holding off on entering the market until I see clearer confirmation on the charts. My approach involves dual time frame momentum trading, where I align trades with the direction of a higher time frame and identify entries on a lower time frame. Currently, none of the time frames are aligning to signal a good entry, which suggests the market may still be in the correction phase.
I’m keeping a close eye on the 4-hour chart for signs that the correction is concluding. Based on the current price action, I believe we’re either at the end of the correction or very close to it. However, my buy order at $0.03493 remains active.
Let’s see if the price moves back down to hit that level. Fingers crossed!
