GAS bull signal 50% gainGASBTC bullish signal 3 days ago, July 2 when price was 160. Now price is 240, so potential 50% gain. Indicator showed bullish signal when it crossed over 50. Message me for subscription.
GASBTC trade ideas

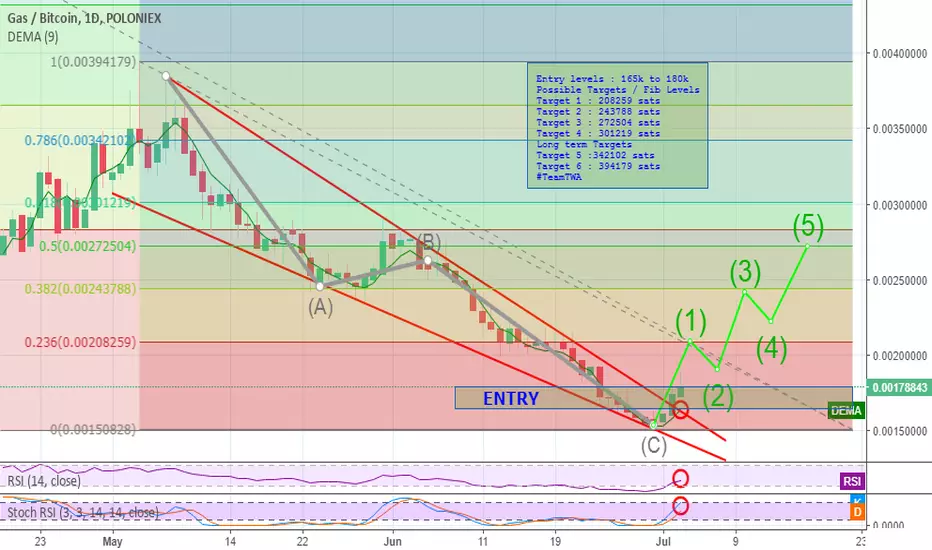
Gas Long Opportunity As we can see almost all the alternate coins are showing exactly the same pattern after the starting of Bitcoin's downward trend since May. Again Gas is showing the same thing here- the same falling wedge pattern- and seems it is going to start its rally if it finished above the upper resistance line.
RSI showing a positive ourlook and volume is expected to spike to see the rally in the near term.
Entry levels : 165k to 180k
Possible Targets / Fib Levels
Target 1 : 208259 sats
Target 2 : 243788 sats
Target 3 : 272504 sats
Target 4 : 301219 sats
Long term Targets
Target 5 :342102 sats
Target 6 : 394179 sats
Good Luck.
Legal disclaimer:
Information on this channel is our team's analyst's "opinion" based on data available at this point in time. These opinions are not recommendations to buy or sell securities/commodities and cryptocurrencies. Trading and investing is a risk and you should not rely on this data to make any financial decisions. You must consult a financial advisory licensed by regulatory agencies in
your legal jurisdiction. All information stated here and in our reports don't guarantee any possible profits or losses. Please do consider to do your own due diligence and research when making any kind of a transaction with financial implications. With Regards. TeamTWA.
GASBTC POTENTIAL 300% PROFIT TRADING OPPORTUNITYGasBTC successfully completed corrective Waves ABC and its time to continue its impulsive waves 12345 which expected to end with a new ATH.
Entry and exit targets are clearly started on the chart.
BLUE: POSSIBLE ENTRY ZONE
RED: STOP LOSS LEVEL
GREEN: SELL TARGETS
Join our discussion room for more about our trading signals.

Gas Potential Trading Opportunity (70-250%) TargetEntry and exit targets are clearly stated on the chart.
BLUE: POSSIBLE ENTRY ZONE
RED: STOP LOSS LEVEL
GREEN: SELL TARGETS
Join our discussion room for more about our trading signals.
Please do click on like icon.
Thanks.


GABTC is going upchoose your risk adversity level and spin the wheel boi
seriously tho this thing is good for at least 15%

GASBTC Coiled For a BreakoutFor 5 days now, GASBTC has been coiling and it looks like it's ready to make a move higher. With Squeezes across most timeframes (as you can see here on the 4 hour chart) I'm looking at a target around .003021 (.382 Fib Extension), just shy of 9% move from here. If this Bull Flag patterns fails, I'll be out relatively quickly with about a 1.55% stop.

Take the pass on $GAS BTC Ladies and gents,
No need to explain much here. Just take a pass despite this false impulse. Wait for the 0.0021-0.0022 range.

GAS vs Bitcoin Getting TractionGAS has found the support at btc 0.0024, that is 76.4% Fibonacci retracement level. This support has been rejected twice, along with the uptrend trendline. The wave up followed, where GAS/BTC broke above the downtrend trendline suggesting the beginning of the uptrend.
Nearest upside resistance is seen at 38.2% Fibonacci, that is btc 0.0038. Previously this level has been acting as the support and then resistance, therefore it is reasonable to expect some resistance again.
While the price continues to print higher highs and higher lows, the downtrend seems to be unlikely at this point. Only break and close below the btc 0.002 could invalidate bullish outlook and establish the downtrend.

GASHi my friends, here is analysis GAS.
- price is still inside blue triangle
- price bounce from 0.236 fib
- perhaps today close above bottom blue trend line, then I expect way to upper trend line
Majkee
(I am sorry for my english)

Gas (GAS/BTC) more downside expected Gas has been correcting since it hit the market in a symmetrical triangle. What I have labeled is an ABCDE correction in the cycle degree, and the current correction is a WXYXZ, and because the Z wave is going to end on the upper resistance line, the price is going to fall back further, which would be a final wave E from the cycle count.


GAS/BTC trading opportunitiesNo reason why we shouldn't continue this solid uptrend movement. If you zoom out to the 3 month you can see we have clearly bottomed.
Zooming out to full 1 month view you will see the uptrend confirmed. Swings are pretty obvious should be easy profits all the way up to 0.004500.

GASSED UP OR RUNNING ON FUMES?whole chart looks like inverse H&S - but each pump has been a lower high. Will be interesting to see if we break that threshold


GASBTC Strong Cup and Handle Pattern Forming on Hourly Chart. There is a strong Cup and Handle Pattern forming on the BTCGAS hourly chart. Wait for retracement to support area highlighted in green and then an upward reversal towards breakout.
*I am not a professional trader or financial advisor. Please trade at your own risk!*

GASBTC Strong Cup and Handle Pattern Forming on Hourly Chart There is a strong cup and handle pattern forming for GASBTC. Look for retracement to support highlighted in green area and then an upward reversal towards breakout.
*I am not a professional trader. Please do not take my analysis as financial advice and trade at your own risk.*

Looks like a solid time to invest Short-Long Term.Hey all, first 'Idea' I've posted on here, so take it with a grain of salt but I do hope it helps at least a few people make some $$ :) I've been following this trend for about three days now, and it's seeming pretty solid should the market carry on the way it is. Let me know what you all think.

Not a bad level to catch some GAS hereJust dipped in a resistance > support zone + kijun support level and possible reversal 4h candle close. Buying with stop at 3250.
Also hidden bullish div.


GAS: gaining BTC!GAS/BTC descending triangle
Targets
0.0042 (~20% profit from now)
0.0054 (~60% profit)
