GAS/BTC- Ascending Triangle GAS/BTC (Binance)- In Ascending Triangle and and testing trend line support also.
GASBTC trade ideas


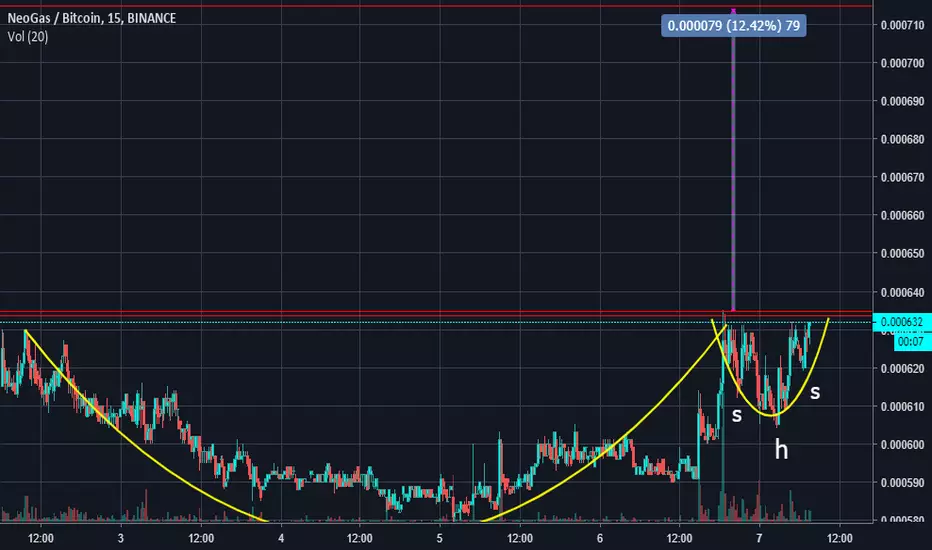
possible gas predictionThere is cup & handle and H&S formation for short term. It could be good profit opportunity
Filled up with GAS. We’re READY FOR LIFT OFF!NeoGas formed a clear ascending triangle on daily frame and is now at the breakout point (614 level).
We also formed a nice inverse H&S pattern on daily frame so good indicators that we will be going up really soon.
Fill up your rocket with some extra GAS because this beauty isn’t come back at this level soon. Neo en Gas hit their bottom, so prepare for breakout.

GASBTC - long setupGASBTC - binance.
Long set-up , GAS started his up-trend and looking for breaking the decending triangle its currently in. If GAS breaks to the up side, we can look for long entry's on the daily lvls thats not been tsted for the first time (D RU = Daily Resitance untested). Targets for me are the first W RU and M SwL ( Monthly swing low) ultimate target is the above D RU (+-200%), expecting this target for the long term to reach.


Gas/Btc bullish????Gas/Btc stuck a big green candle out and said "We are done going down". Looks like it will put in a right shoulder and head north. But be careful these things are writting in stone. Protect your crypto and dont rush into things.
----If you would like to learn TA the proper way leave Me a message----
------If you have any coins that you would like Me to check out just leave a message and I would be more than happy to check them out for you------
------If My charts have helped you and you are feeling generous-tips welcomed :) thanks------
Btc- 1HrzkkMTJZHvLxgutmNT9qNAussZwSBrf8
Ltc- LNhiQ2uEjUhy8UwmXUk1sgA9ZSXqSBkKRV
Eth- 0x85a2db972B76b8d8eAB52F77aB499CD5F74eDfaF
Bch- qr44ltflnphqprc34lmg9nz5zcr6dy0wdcqvx3q9u8
Iota-XTFHKGXUVPTQXFKLWDILPIYASLUIMK9GIJOGXACLEIPIOJI9LVYPGWDYCREXZCEYZ9MZLJJXPYDMRWWTYOYRKBZCCW


GAS bomb is coming, very positive now...
Hi everyone, now I must buy some more GAS here, looks like some big move coming.
MACD: positive divergence
Bollinger band: very tight for one week now
Accumulation zone 1 months in tight price range between 77500-83000sat
In history we can see big 1d bullish candle 87% in 1day
If we break up triangel and 85000sat, there will be open doors for first target, if we go break down we can look for support to 72700sat.
So my targets:
95000sat
116000sat
153000sat
I will be update it
If you like my work, please leave follow, comments or likes, I really appreciate it
Thank you


NEO dApps popping up, while GAS price is dropping.New projects popping up on NEO blockchain are great news for the GAS token holders
The GAS is a fuel of the NEO blockchain; a currency used to pay for utilizing NEO protocol resources. Projects built on top of NEO blockchain will have to use GAS and at the same time GAS can be earned simply by keeping NEO coins in the wallet. By holding, or in other words staking NEO, passive income will be earned.
There are many new dApps are being built on top of NEO blockchain, which should drive the demand for the GAS. For example there are few startups worth mentioning, like NEX, Switcheo, Red Pulse and so on. More on NEO dApps can be found here: ndapp.org
With the huge potential for demand, the price of GAS is also likely to increase in the long run. Dapps built on top of the NEO blockchain are yet to prove their real world usage, and if/when they will become commercially accepted, NEO along with the GAS token have a good chance to rise above all-time highs.
Currently, as the entire cryptocurrency space is struggling, the price of GAS has also been moving down. Back in January 2018, GAS has been traded at btc 0.007, and in August it hit the low at btc 0.0006. This is a huge 91.5% drop,that took only 8 months.
Will GAS/BTC recover at any time?
Certainly it should be expected in the coming month, but at this stage it is not clear when and how strong the recovery will be. Back on the 14th of August, GAS reached th low at btc 0.00066, where it rejected the 427.2% Fibonacci support level, of the Fibs applied to the corrective wave up after the uptrend trendline breakout.
At the same time, new Fibonacci time zone cycle has started and price went up from btc 0.00066 up to the 0.00120 resistance, but failed to break above. Nevertheless, the 200 Moving Average and the RSI downtrend trendline were broken, suggesting the upside growth.
The next Fibonacci cycle starting on the 13th of October, which is just 3 days to go. At that stage the trade volume might increase, resulting in breaking above or below the trading rage, established between btc 0.00066 support and 0.00120 resistance.
As the RSI is holding the uptrend trendline, break above the 200 Moving Average could be the signal on another wave up. But price breaks belwo the btc 0.00066 support, GAS/BTC could decline towards the next support level, at 0.00013.
This could be the bottom of the GAS downtrend, as first signs of the trend reversal are there. Formation of the “higher highs and higher lows” pattern should help to confirm the reversal, while break below the support could have a negative impact on the price..

Time to Fuel up on GASGAS has been consolidating for a little while and volume has been increasing. B-Bands are tight and GAS is ready to move.

GASBTC SAYS," I CAN GRAB YOU 70% PROFITS WITHIN 30DAYS".GASBTC is now currently on the extreme zone from where it has bounced hard in the past. It has pumped various times from this region and its been silence for over 1 months now. i am expecting big pump in this coin
************************************************************************************************
TRADESTATS :-
BUY :- 760-770
FLASH SELL :- 844
SHORT SELL :- 894
SMART SELL :- 945
LONG SELL :- 1212
*************************************************************************************
DONOT TRADE IN HASTE !! PATIENCE PAYS ALWAYS !
HAVE A GOOD DAY TRADERS !!
NAMASTE

GAS/BTC in Very Good Buying Zone and Can Take Sure Shot ProfitGAS Coin in Consolidating Periods and Following Trend Line , Very Soon We Can a Great Spike
Buy GAS/BTC 800
Sell 1050 , 1500
Stay Tuned..........!!
Learn Here , Earn EverWhere

NEO - GAS correlation, which one to buy for the long term?As seen on both charts the correlation between NEO/BTC and GAS/BTC is significant. GAS tends to follow NEO movement but with amplified percentage change both on the upside and downside. It looks like we have established a bottom with very low volatility and stable price action. A typical pattern which we see in BTC as well right now when speculators are surrendering to long term buyers.
GAS would most likely give higher return when NEO starts moving up!


GAS/BTC Levels for Tradrz membersWaiting for confirmation either side of the current grey range. If it's bearish which it currently looks to be, I'll be waiting for re-support on the lower levels noted and aiming for 1000 sats once we see strength.


GAS/BTC Flattening out and looking goodNEO and its other token GAS are very interesting projects, which had a lot of momentum but during this bear cycle, they have taken a beating. Gas, in particular, is way down to less than $6 USD from its ATH of $90.
It seems to have leveled off and hit a bottom. I am entering pretty large into a position in GAS. My thoughts are that we are entering into a mini alt season and some of these low hanging fruits are going to pop. Will it reach its ATH? probably not but it could easily double.
On the TA side there is a pretty busted bullish divergence, maybe it's not textbook, but to me, it is still valid. Because I entered a large position in GAS I am keeping a tight stop loss and keeping my eyes on the market.
PLEASE TRADE AT YOUR OWN RISK. I am not a financial advisor, just a robot from the future who is publishing a trading diary. Educational purposes only.

GAS/BTC TIME TO GOGAS/BTC
ENTER 880-900
STOP UNDER 795
TARGETS 980-1100-1450
-finding support over 100ma on h4
-testing bottom of the trendline
-MACD bullish


Gas wtfOutlandish volume spike on Gas - The lottery results for the much hyped nOS ico on Neo blockchain only came out today, Gas is used to contribute, is it possible someone had forewarning of their positive result...oO Gas will be used on the nOS network - I'm not sure if this spike is more telling of the future value of Gas or nOS...

GASBTC Daily Chart with Fibonacci RetracementsDaily Setup for GAS/BTC via Binance.
We a sitting around weekly lows, which seems like a good time to start to accumulate at these lower levels.
coinmarketcap.com
neo.org
$6.19 USD (10.06%)
0.00094059 BTC (10.52%)
0.34447083 NEO (11.38%)
Share
Watch
Market Cap
$62,679,747 USD
9,527 BTC
3,488,930 NEO
Volume (24h)
$1,629,931 USD
247.73 BTC
90,726 NEO
Circulating Supply
10,128,375 GAS
Total Supply
17,190,378 GAS
Max Supply
100,000,000 GAS
