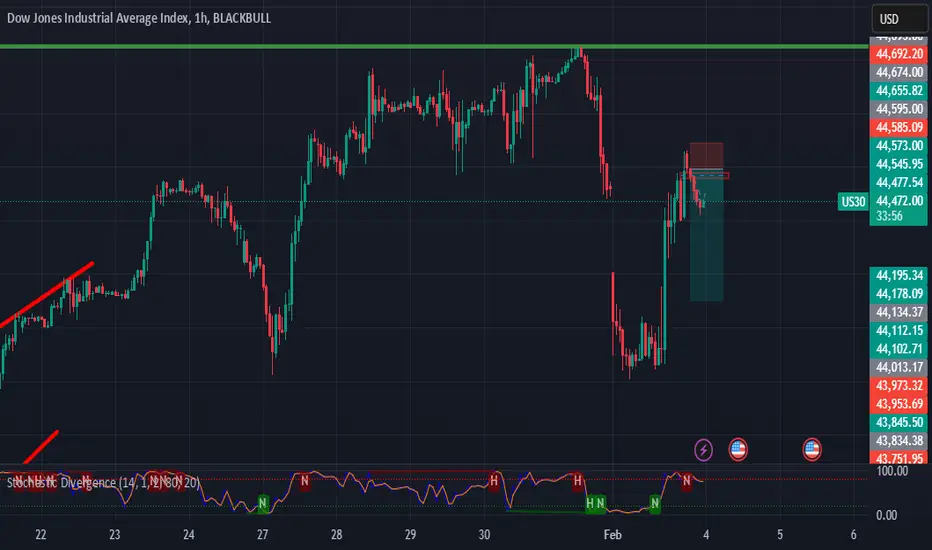
Us30 Buy ideaWe are approaching a high propability setup with US30 getting mulltiple confluences for a buy .
DJ30 trade ideas

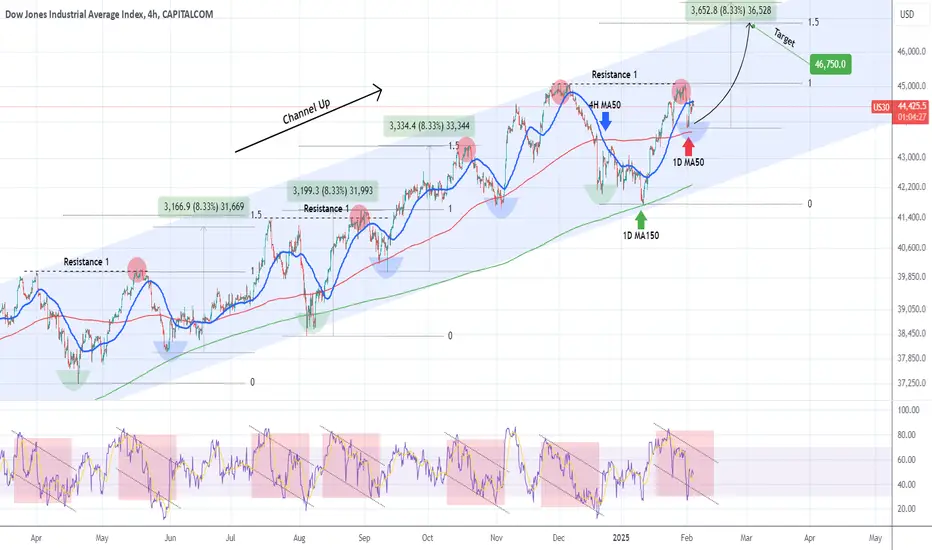
DOW JONES Can the 1D MA50 save the day once more?Dow Jones (DJIA) has been trading within a year long Channel Up and this week's pull-back has so far found Support just above the 1D MA50 (red trend-line). As this chart shows, every 1D MA50 contact that was made after a Channel Up bottom (Higher Low), was a buy opportunity as the blue arc patterns highlight.
The green arcs are the Channel bottoms and technically the strongest buy opportunities and in the past 10 months we've only had 3 of those. This is the 4th blue arc however, the medium-term buy opportunity.
Regardless of colour, the 4H RSI pattern on each of those buy opportunities, has been the same. And the resulting rally has either hit the 1.5 Fibonacci extension or made a +8.33% rise.
This time the 1.5 Fib is a bit closer to the price, so that will be our medium-term Target at 46750.
-------------------------------------------------------------------------------
** Please LIKE 👍, FOLLOW ✅, SHARE 🙌 and COMMENT ✍ if you enjoy this idea! Also share your ideas and charts in the comments section below! This is best way to keep it relevant, support us, keep the content here free and allow the idea to reach as many people as possible. **
-------------------------------------------------------------------------------
💸💸💸💸💸💸
👇 👇 👇 👇 👇 👇
US30 market analysis US30 Analysis:
• Bullish Momentum: The price is breaking through a fair value gap, indicating strong bullish intent as liquidity is being grabbed.
• Support Zone: The current breakout likely retests lower demand zones before continuation.
• Upside Potential: If price sustains above 44,500 and shows further volume confirmation, it could target higher resistance levels, potentially aiming for significant upside gains.
• Recommendation: Look for bullish continuation patterns and monitor for pullbacks to support zones as optimal entry points for a big buy setup.

US30 SELL ANALYSIS SMART MONEY CONCEPT Here on US30 price has form a supply around level of 43418.71 which is likely to continue going down so trader should go for short with expect profit target of 38888.06 and 33607.99 . Use money management

US30 / Pause for Mexico & Canada, But not yet for China!U.S. Pauses Tariffs on Mexico, Canada. China Levies Are Still Happening — for Now.
US30 Technical Analysis
The price has stabilized below the pivot line, indicating a continuation of the bearish trend toward 44,140 and 43,900.
However, if a 4-hour candle closes above 44,410, the price may push higher, targeting 44,610 and 44,750.
Key Levels
Pivot Point: 44250
Resistance Levels: 44410, 44610, 44760
Support Levels: 44150, 43900, 43760
Trend Outlook:
Bullish above 44410
Bearish While below 44410

US30 04FEB 2025 TRADE IDEA The **Dow Jones Industrial Average (US30)** remains in a long-term bullish trend, with price continuing to form higher highs and higher lows. However, in the short term, a pullback is expected after a recent push higher, as indicated by the current price of 44,285.9. The key resistance zone lies between 44,803 – 45,124, where selling pressure could emerge, while major support zones are found at 43,113 – 43,047 and further down at 41,757 – 41,527. If the price fails to break above the resistance, a decline toward the lower demand zones is likely before any potential continuation of the bullish trend.
From a Smart Money Concepts (SMC) perspective, liquidity is positioned both above the 45,103 – 45,124 zone, where stop-losses of retail traders might be targeted, and below at 43,047 – 42,000, which could serve as a liquidity grab area before a bounce. Fair Value Gaps (FVGs) are present near 43,113, making it a potential retracement target. Additionally, a bearish order block (OB) is evident at 44,803 – 45,124, reinforcing the likelihood of rejection from this zone, while a bullish OB at 41,684 – 41,527 suggests a high-probability area for a price reversal. Given these factors, smart money could drive price down toward these key liquidity levels before another upward move.
In terms of supply and demand, the market is currently testing a strong supply zone (44,803 – 45,124), which may result in a short-term decline. Meanwhile, significant demand zones at 43,113 – 43,047 and 41,757 – 41,527 could provide support where buyers may step in. A sell-off from the supply zone, followed by a reaction at the demand levels, aligns with the overall market structure.
On the fundamental side, several macroeconomic factors are influencing US30’s trajectory. The Federal Reserve’s interest rate decision in February 2025 will be a key driver. A hawkish Fed stance could strengthen the USD, putting pressure on stocks, while a dovish approach (rate cuts) could provide upward momentum. Additionally, the US jobs report (NFP and unemployment rate) will be closely monitored; a strong labor market could reinforce the Fed’s tightening policy, negatively impacting equities. Geopolitical risks, including ongoing tensions in Russia-Ukraine, the Middle East, and the US-China trade war, may also introduce volatility. Rising geopolitical tensions could lead investors to seek safe-haven assets, causing US30 to decline, whereas easing tensions could bolster market sentiment and support the index.
Given these technical and fundamental factors, the short-term expectation for US30 is **bearish**, with price likely to retrace toward the 43,113 level and possibly 41,527 before any renewed bullish momentum. Traders looking for short opportunities may consider selling near 44,803 – 45,124, with a stop-loss above 45,200, targeting 43,113 and potentially 41,757. On the other hand, long positions could be considered around the 41,684 – 41,527 demand zone, with a stop-loss below 41,400 and targets back toward 43,113 – 44,800.
Overall, while the broader trend remains bullish, short-term corrections are expected before the market resumes its upward trajectory. Traders should keep an eye on key economic releases and geopolitical developments, as they could significantly impact market sentiment and price action.

US30, Short, 4h✅ US30 has formed a rectangle pattern, and the price is now moving downward toward the key support at 43230. This level has been tested five times as both support and resistance, reinforcing its importance.
SHORT 🔥
✅ Like and subscribe to never miss a new analysis! ✅

US30 H1 I Bearish Drop Based on the H1 chart, the price is approaching our sell entry level at 44,589.66, which aligns with a strong resistance level and the 61.8% Fibonacci retracement. This level is expected to act as a potential reversal point in the bearish setup.
Our take profit is set at 44,078.74, near a previous support level, where price may find buying interest.
The stop loss is placed at 44,913.22, above the previous swing high and above the 78.6% Fibonacci retracement, providing room for price fluctuations while ensuring the bearish setup remains valid.
High Risk Investment Warning
Trading Forex/CFDs on margin carries a high level of risk and may not be suitable for all investors. Leverage can work against you.
Stratos Markets Limited (fxcm.com/uk):
CFDs are complex instruments and come with a high risk of losing money rapidly due to leverage. 63% of retail investor accounts lose money when trading CFDs with this provider. You should consider whether you understand how CFDs work and whether you can afford to take the high risk of losing your money.
Stratos Europe Ltd (fxcm.com/eu):
CFDs are complex instruments and come with a high risk of losing money rapidly due to leverage. 63% of retail investor accounts lose money when trading CFDs with this provider. You should consider whether you understand how CFDs work and whether you can afford to take the high risk of losing your money.
Stratos Trading Pty. Limited (fxcm.com/au):
Trading FX/CFDs carries significant risks. FXCM AU (AFSL 309763), please read the Financial Services Guide, Product Disclosure Statement, Target Market Determination and Terms of Business at fxcm.com/au
Stratos Global LLC (fxcm.com/markets):
Losses can exceed deposits.
Please be advised that the information presented on TradingView is provided to FXCM (‘Company’, ‘we’) by a third-party provider (‘TFA Global Pte Ltd’). Please be reminded that you are solely responsible for the trading decisions on your account. There is a very high degree of risk involved in trading. Any information and/or content is intended entirely for research, educational and informational purposes only and does not constitute investment or consultation advice or investment strategy. The information is not tailored to the investment needs of any specific person and therefore does not involve a consideration of any of the investment objectives, financial situation or needs of any viewer that may receive it. Kindly also note that past performance is not a reliable indicator of future results. Actual results may differ materially from those anticipated in forward-looking or past performance statements. We assume no liability as to the accuracy or completeness of any of the information and/or content provided herein and the Company cannot be held responsible for any omission, mistake nor for any loss or damage including without limitation to any loss of profit which may arise from reliance on any information supplied by TFA Global Pte Ltd.
The speaker(s) is neither an employee, agent nor representative of FXCM and is therefore acting independently. The opinions given are their own, constitute general market commentary, and do not constitute the opinion or advice of FXCM or any form of personal or investment advice. FXCM neither endorses nor guarantees offerings of third-party speakers, nor is FXCM responsible for the content, veracity or opinions of third-party speakers, presenters or participants.

Market Analysis for US30 (Sell)US30 has broken through the fair value gap, confirming a strong bearish momentum and aligning perfectly with our trading strategy. This setup indicates a market imbalance correction, creating an optimal sell opportunity. With price action showing rejection from key resistance levels, we anticipate further downside movement. Stops are placed above the FVG for risk control, and targets are set at the next support zone. This is a textbook example of our strategic approach to capitalizing on market inefficiencies.
US30 BuysAfter a strong recovery we are looking to buy US30 between 44000-44200
A Break of 108 on the DXY will help give us a strong push upside across all indexes

Dow Jones will conquer the 50,000 mark after the adjustment.Here is the most likely scenario for DJI. The support level is around 43,000, after which it is expected to break through to the 50,000 level. Investors can refer to this scenario. This is a scenario chart for reference, not a buy/sell recommendation.

Double top H&S completionDouble top formed. Second top finishing a head and shoulders formation before descent.

DOW at ATH?This analysis is based on the daily upward trend we have been on since last year in August, i believe we have a lot of potential to see the US indices hitting new all-time highs. I am bullish on the Indices, unless fundamental data proves otherwise.

Dow Jones And The Law Of The SeaThe financial markets are setup in a way that symbolizes the Ocean and follows the Law of the Sea.
Your cash is a LIQUID asset that is sat in a riverBANK. Your cashFLOW is used for LIQUIDITY when you purchase an asset. The banks direct the flow of money or CURRENT(cy).
Inflation = inflatable rescue craft used when a debtor/dead ore has lost its charge.
When currency is used, it loses its value or its battery gets depleted. The inflatable craft must be blown up with more fresh air "currency" or to put simply, to print more money.
The word check is literally the meaning of KING in Persia. This is why in chess, when the king is in danger of being eliminated, you say CHECK. This means to cut a king.
When you are looking for a good price to buy, you are looking for a good DEAL. A deal is in ancient maritime commerce, a plank of softwood timber used on the deck of the ship. In commerce, it used as buying or selling. To get a good deal, refers to a certain area on the ship where goods were sold. The deals were made literally on the deals of the merchant ships. This is why in business they "cut" you a deal, because the timber of the ships needed to be cut. Just like a "Deck" of cards the "dealer" deals you.
There is more to this ancient story and how ALL financial terms and system is setup using Maritime Law

US30 created a bullish opportunity after a market correctionUS30 created a buying opportunity after opening the trading day below closing of last friday by over 200 pips. This gave a buying opportunity as price often fills any gaps created by the market.

US30-Bias short pair has made a strong bearish divergence and head and shoulder formation in 5 min chart,in 15 MA 200 is getting respected and shooting star formation followed by the bearish engulfer candle.
Major resistance respected at 44509 ,Support has broken at 44352
FIb level 0.618 is being respected at 44509 which indicates fall expected.
Trade plan bias short @ 44350
SL:44531
TP1:44208
TP2:44155

sell dow again...its a correction upward...big trend is down nowi think wave 1 of C or 3 has just ended here and the correction wave has started in the us market morning...so i will sell it again at the level i mentioned in the chart and my sl is the last ceiling in 4H timerame...TP manually setup

time for sell DOWits a good time to sell dow jones i think wave Y has ended almost and we can think of selling this savage!!!sell wid sl guys and tp is personal

DOW JONES: Buy signal above the 4month RectangleDow Jones just turned bullish on its 1D technical outlook (RSI = 56.676, MACD = 255.440, ADX = 30.051) as it hit the 4H MA50 after an instant rebound on the 4H MA100 inside the same session. This is a strong bullish reversal but the buy signal will be validated if the price crosses over the 4month Rectangle pattern. The rally from its January 13th bottom has been with a significant correction until Friday's and today so far and according to the November rally which was two-fold, if this is the start of the 2nd bullish stage, it should be -1.70% weaker than the first. This implies that from today's low we should rise by +6.30%. This gives us a TP = 46,550 but in order to overcome the bearish pressure of the Rectangle, we will buy only if then price crosses over it.
See how our prior idea has worked out:
## If you like our free content follow our profile to get more daily ideas. ##
## Comments and likes are greatly appreciated. ##

POSSIBLE SET UP ON US30All the details are marked on chart so far no break of structure therefore 45000 level is very important for any upward move we need to have positive closure above 45000 level upcoming week alot of economic data is on card all the levels are marked on chart will take entries only upon confirmation US30 went up from 42000 level but failed to sustain above 45000 which is of significance importance however on monthly timeframe it closed above 80% of range another important aspect therefore will look for small entries till the time its consolidating between 41000-45000
Note: Only for educational purpose not an investment advice

WALL STREET LONGAll timeframes are oversold and there is a lot of divergnece
There is no pattern but this is with the trend
100 pip stop loss
entered at 43895
Take half at M15 overbought

Tariffs, tariffs and more tariffs... What's next for the Dow?It seems like we are stepping into Tariff Wars 2.0, with the announcement of the tariffs on Canada, Mexico and China. But is the outlook really that bad? Let's take a look at the MARKETSCOM:US30 scenario.
TVC:DJI
74.2% of retail investor accounts lose money when trading CFDs with this provider. You should consider whether you understand how CFDs work and whether you can afford to take the high risk of losing your money. Past performance is not necessarily indicative of future results. The value of investments may fall as well as rise and the investor may not get back the amount initially invested. This content is not intended for nor applicable to residents of the UK. Cryptocurrency CFDs and spread bets are restricted in the UK for all retail clients.

US30 Drops 500 Points Amid Tariff UncertaintyUS30 Technical Analysis
US Equity Investors to Stay Focused on Global Trade While Watching Out for Earnings, Payrolls This Week
Currently, if the 4-hour candle closes below 43,760, it signals a strong bearish move toward 43,350.
However, if the price stabilizes above 43,760, it is likely to consolidate between 44,080 and 43,760 until a breakout occurs.
A break above 44,080 would push the price higher toward 44,410.
Key Levels
Pivot Point: 44,020
Resistance Levels: 44,250, 44,410, 44,610
Support Levels: 43,760, 43,580, 43,350
Trend Outlook
🔹 Bullish above 44,080
🔹 Strong Bearish below 43,760
