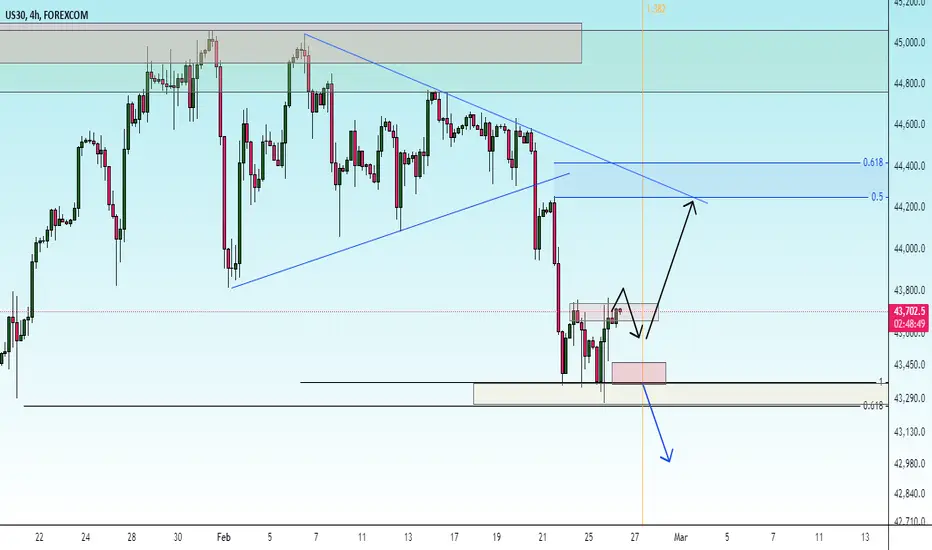
$US30 SHORTS UPDATERocky start, but we look like we could be on road now….
If this holds valid we will be melting straight into 43k flat.
From there, take partials roll stops and leave remains for Tp…
LFG GEES 🫠
DJ30 trade ideas

$US30 SHORTSLooking to get this rolling. Have long profile around to handle if we can get through.
LFG 👽

"US30 / DJI" Indices Market Bearish Heist Plan🌟Hi! Hola! Ola! Bonjour! Hallo!🌟
Dear Money Makers & Robbers, 🤑 💰🐱👤🐱🏍
Based on 🔥Thief Trading style technical and fundamental analysis🔥, here is our master plan to heist the "US30 / DJI" Indices Market. Please adhere to the strategy I've outlined in the chart, which emphasizes short entry. Our aim is the high-risk Green Zone. Risky level, oversold market, consolidation, trend reversal, trap at the level where traders and bullish thieves are getting stronger. 🏆💸Book Profits Be wealthy and safe trade.💪🏆🎉
Entry 📈 : "The vault is wide open! Swipe the Bearish loot at any price - the heist is on!
however I advise placing Sell limit orders within a 15 or 30 minute timeframe. Entry from the most recent or closest low or high level should be in retest.
Stop Loss 🛑: Thief SL placed at (44200) swing Trade Basis Using the 4H period, the recent / swing high or low level.
SL is based on your risk of the trade, lot size and how many multiple orders you have to take.
Target 🎯: 42200 (or) Escape Before the Target
🧲Scalpers, take note 👀 : only scalp on the Short side. If you have a lot of money, you can go straight away; if not, you can join swing traders and carry out the robbery plan. Use trailing SL to safeguard your money 💰.
📰🗞️Fundamental, Macro, COT, Sentimental Outlook:
"US30 / DJI" Indices Market is currently experiencing a Bearish trend., driven by several key factors.
🟣Fundamental Analysis
Earnings: Q4 2024 EPS growth strong (e.g., 16.9% for S&P 500 proxies)—bullish, but US30 firms face tariff uncertainty.
Rates: Fed at 3-3.5%, no cuts signaled—real yields ~1% (10-year Treasury 3.8%) pressure equities—bearish.
Inflation: PCE 2.6% (Jan 2025)—persistent inflation supports Fed stance, bearish for stocks.
Growth: U.S. consumer spending wanes (Schwab)—mixed, neutral impact.
Geopolitics: Trump tariffs (25% Mexico/Canada, 10% China)—short-term volatility, long-term bullish for U.S. firms.
🟤Macro Economics
Federal Reserve Policy: The Federal Reserve has been raising interest rates to combat inflation, which has led to a strengthening of the US dollar.
US Economy: The US economy has been showing signs of slowing down, with GDP growth rates decreasing.
Global Economy: The global economy has been experiencing a slowdown, with many countries experiencing recession.
⚪Commitments of Traders (COT) Data
Speculators: Net long ~55,000 contracts (down from 65,000)—cooling bullishness.
Hedgers: Net short ~60,000—stable, locking in gains.
Open Interest: ~125,000 contracts—steady global interest, neutral.
🔴Market Sentimental Analysis
Bullish Sentiment: Some analysts believe that the US30 will break above the resistance at 45,000 and continue rising.
Bearish Sentiment: Many investors expect a correction, with a potential target of 42200.
Risk Aversion: The market is experiencing risk aversion, with investors seeking safe-haven assets.
🔵Positioning Analysis
Long Positions: Some investors are holding long positions in US30, expecting a breakout above 45,000.
Short Positions: Many investors are holding short positions in US30, expecting a correction.
🟠Quantitative Analysis
Technical Indicators: The 14-day Relative Strength Index (RSI) is at 45, indicating a neutral sentiment.
Moving Averages: The 21-day Simple Moving Average (SMA) is at 44,404, providing resistance for US30 prices.
🟡Intermarket Analysis
DXY: 106.00—USD softness aids equities—bullish.
XAU/USD: 2910—gold rise signals risk-off, bearish for US30.
NDX: ~20,000, tech softening—correlated pressure on US30—bearish.
Bonds: U.S. 10-year 3.8%—yield stability neutral.
🟢News and Events Analysis
Federal Reserve Meeting: The Federal Reserve is scheduled to meet on March 15-16, with investors expecting a potential rate hike.
US Economic Data: The US economic data, including the Non-Farm Payrolls report, is being closely watched for its impact on US30 prices.
🟣Next Trend Move
Bullish Trend: Some analysts believe that the US30 will break above the resistance at 45,000 and continue rising.
Bearish Trend: Many investors expect a correction, with a potential target of 42,200.
🔴Overall Summary Outlook
Bullish Outlook: Some analysts believe that the US30 will break above the resistance at 45,000 and continue rising.
Bearish Outlook: Many investors expect a correction, with a potential target of 42,200.
📌Keep in mind that these factors can change rapidly, and it's essential to stay up-to-date with market developments and adjust your analysis accordingly.
⚠️Trading Alert : News Releases and Position Management 📰 🗞️ 🚫🚏
As a reminder, news releases can have a significant impact on market prices and volatility. To minimize potential losses and protect your running positions,
we recommend the following:
Avoid taking new trades during news releases
Use trailing stop-loss orders to protect your running positions and lock in profits
💖Supporting our robbery plan 💥Hit the Boost Button💥 will enable us to effortlessly make and steal money 💰💵. Boost the strength of our robbery team. Every day in this market make money with ease by using the Thief Trading Style.🏆💪🤝❤️🎉🚀
I'll see you soon with another heist plan, so stay tuned 🤑🐱👤🤗🤩

Dowjones Potential ShortRisk-off sentiment dominates the market amid tightening monetary policies and rising inflation, fueled by Trump's policies. For now, I see a bearish outlook, and this is a bearish setup on Dow Jones that I'm watching closely.

possibility of uptrendThe index is expected to consolidate above the resistance range, then a continuation of the uptrend is likely. If the support range is broken, a continuation of the downtrend and correction is likely.
Us30-Sell ScenarioSymmetrical Triangle Breakout and retest formation, Bearish flag formation, ABC retracement formation and Order Block

E3 markupHere I demonstrate the flowless look at the charts from a less cluttered view using the E3 strat.
Thanks for looking!

DJI Dow jones industrial avg 24hr potterboxDJI Dow jones industrial avg. 24hr potterbox. The Dow came down and bounce off of the 50 percent line or cost basis. $43,403.41 ish, Hopefully it will continue in this direction. An open and close above the 50 percent line means it will continue up. this box could be modified some, but it looks good right now. Happy Trading.

Weekly Forex Outlook Sun.Feb.23.2025 - Fri.Feb.28.2025Like and Comments would be appreciated :D Not Financial Advice, Just my outlook/opinion

only sellIt is still moving based on the analysis, when it hits the weekly floor, it is likely to move in the direction of the big arrow, maybe 47,000 will be available

US30 move down bearishus30 is short term correcting to the down side but right now it may need to move higher to 400 to 500 points to break the current support level any thoughts are welcomed

sell and buyFirst we continue with sell and then we go at the price of 42750 for buy for the purpose of the roof of the channel

Dow drops on inflation expectations of US consumersThe Dow (US30) index price action sentiment appears bullish, supported by the longer-term prevailing uptrend. However, since reaching an all-time high on 04th December 2024 the Dow index price action is consolidating in a sideways trading range.
The key trading level is at 42980, previous consolidation zone and the rising support trendline . A corrective pullback from the current levels and a bullish bounce back from the 42980 level could target the upside resistance at 43680 followed by the 44080 and 44540 levels over the longer timeframe.
Alternatively, a confirmed loss of 42980 support and a daily close below that level would negate the bullish outlook opening the way for a further retracement and a retest of 42520 support level followed by 41820 (200 Day Moving Average).
This communication is for informational purposes only and should not be viewed as any form of recommendation as to a particular course of action or as investment advice. It is not intended as an offer or solicitation for the purchase or sale of any financial instrument or as an official confirmation of any transaction. Opinions, estimates and assumptions expressed herein are made as of the date of this communication and are subject to change without notice. This communication has been prepared based upon information, including market prices, data and other information, believed to be reliable; however, Trade Nation does not warrant its completeness or accuracy. All market prices and market data contained in or attached to this communication are indicative and subject to change without notice.

FVG AND HOLC BUYI think we have hit the low for today and we have a big bearish FVG higher so i target the 50% of her and in 1min TF i entry in bullish FVG


DOW JONES Rectangle bottom formed. Bullish.Dow Jones hit today its MA200 (4h) and rebounded.
This has come too close to the bottom of the Rectangle pattern that dominates the price action in the past 3 weeks.
Trading Plan:
1. Buy on the current market price.
2. Buy again if the price closes above the Falling Resistance.
Targets:
1. 44450 (MA50 4h and Falling Resistance).
2. 45000 (top of Rectangle).
Tips:
1. The RSI (4h) got oversold and rebounded like on the February 3rd Low. Strong buy signal.
Please like, follow and comment!!


Dow30 buy Last week buyers aggressively rejected lower prices at this price levels
44195.7 & 44179.5
20th Feb we see a reaction to this oders with anticipation that buyers will successfully defend their buying interest

US30 (Dow Jones) H1 Analysis: Descending Resistance TestLooking at the H1 timeframe for the US30, we're seeing an interesting technical setup:
Market Structure:
Price trading beneath a clear descending resistance line
Consolidation pattern forming in recent sessions
Moving averages tightly grouped, indicating potential breakout setup
Recent lower highs respecting the descending trendline
Key Levels:
Major Resistance: 44,767 (Descending Trendline)
Current Price: ~44,518
Support Level: 44,153
Immediate Resistance: 44,592
Technical Indicators:
Volume showing decreased activity in recent consolidation
Momentum indicators showing neutral bias
Price compressing between moving averages
Lower timeframe structure indicates potential bearish continuation
Trading Considerations:
Watch for reaction at descending trendline
Volume increase needed for valid breakout
Key support at 44,153 needs to hold for bullish scenario
Potential for continuation of range-bound condition
s

US/30 bullishlooking for price to enter 0.71 fibb area for a buy to the upside,
i will be looking to enter this on a lower timeframe, with a possible scale in depending on market structure. alert set for the 0.71 fibb area.


US30 Liquidity We swept some liquidity.. i was looking for a short trade but first we should wipe out this liquidity

US30We can attempt to buy US30 from specified level as it make HL , also 0.618 FIB level intact indicate that it moves upward.
SL , TP mention in chart.
