Understanding the Crab's Potential Ascent Before the DescentCurrent market analysis suggests a potential temporary surge in the Nasdaq index, colloquially referred to as a "crab walk," possibly reaching a level of 20.4 before a significant correction.
While this upward movement may present short-term opportunities, it is crucial to recognize its potential transience.
USTEC trade ideas

NAS long idea Another idea on NAS100. The price is making bullish pattern, so if the price falls down to the key level and can't break it, highly likely to make bullish movement.
This is only my prediction, decision is all yours.

Hanzo : NAS100 15m: Breakout Zone Confirmed After Liquidity Trap🆚 Nas100 – Hanzo’s Strike Setup
🔥 Timeframe: 15-Minute (15M)
——————
💯 Main Focus: Bullish After Break at 19950
We are watching this zone closely.
💯 Main Focus: Bearish After Break at 19715
We are watching this zone closely.
———
👌 Market Signs (15M TF):
• Liquidity Grab + CHoCH at 19930
• Liquidity Grab + CHoCH at 19650
• Strong Rejections seen at:
➗ 19750 – Major support / Key level
➗ 20100 – Proven resistance


I'm selling NAS100, you should too!!Classic head and shoulder is forming, sometimes, it is that easy, dont overcomplicate it

NASDAQ (NDX) Market OutlookCurrently, the NASDAQ is trading around 19,723. We're anticipating a short-term pullback toward the 19,462 level, where a significant pool of liquidity awaits. This zone could act as a magnet for price in the near term. Once price reaches this area, we’ll closely monitor the lower timeframes for a potential bullish reaction or accumulation, which could signal the next leg higher.
Stay patient and let price confirm at key levels.

NAS100USD: Volatility Opens Door for Sell Setup in NY SessionGreetings Traders,
As we enter the New York session—a period known for heightened volatility—we note that NAS100USD remains in a broader bullish environment. However, current price action suggests the potential for a short-term reversal, prompting us to explore selling opportunities.
Key Observations:
1. Bearish Internal Structure Developing:
Despite the overall bullish trend, internal price action reveals a sequence of lower lows, indicating the formation of a bearish microstructure. This internal weakness is reflected in the way bearish arrays—such as mitigation blocks and fair value gaps (FVGs)—continue to act as resistance zones.
2. Mitigation Block & FVG Alignment:
Recently, price delivered a strong displacement to the downside, followed by a retracement into a mitigation block that aligns with a fair value gap. This confluence reinforces the bearish bias and suggests institutional selling may be active in this zone.
3. Downside Targets – Gap Fill & Liquidity Pools:
The first downside target is a nearby inefficiency (gap) in price action, which the market often seeks to fill. The second target lies below, where sell-side liquidity pools are likely resting.
Trading Plan:
Monitor price behavior within the current resistance zone. If confirmation of continued bearish momentum appears, short positions targeting the aforementioned levels may be viable.
Stay focused and wait for confirmation before committing to any positions.
Kind Regards,
The Architect

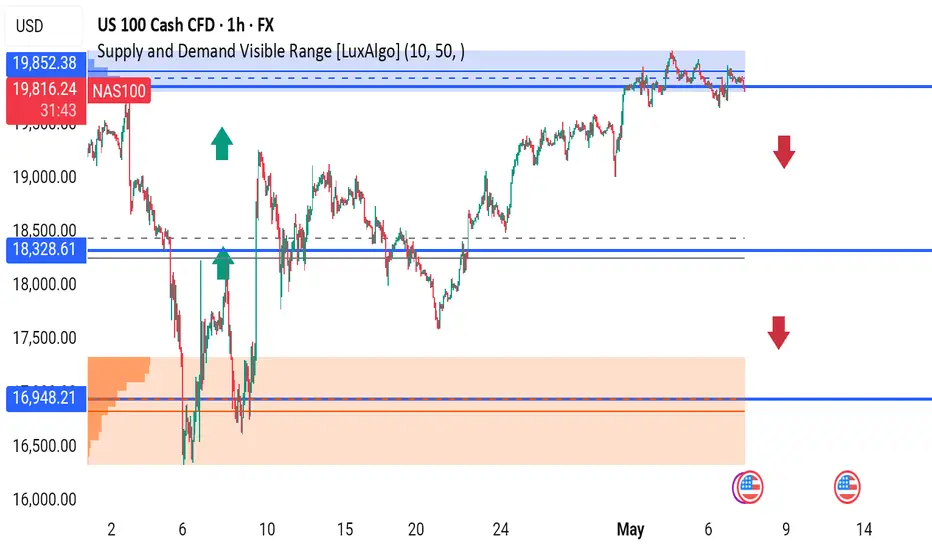
NAS100 1H | Major Rejection Zone – Time to Sell?NAS100 is trading inside a key supply zone, showing clear rejection signs near 19,825, with a potential downside move on the table.
Watch These Levels:
Resistance (Rejection Zone): 19,825
First Support: 18,328
Major Demand Zone: 16,948
Bearish Bias if price fails to break and close above 19,825.
A break below 18,328 could trigger a deeper drop toward 16,948.
Trade Plan:
Sell near 19,825 with SL above zone
Target 18,328 → 16,948
Bullish reversal only above clean breakout
What do you think—pullback or breakout?
#NAS100 #NASDAQ #Indices #PriceAction #SupplyAndDemand #SmartMoney #ForexTrading #TechnicalAnalysis #LuxAlgo #US100 #CFD
NSDQ100 INTRADAY awaits Fed Rate Decision Macro & Central Banks
The Federal Reserve is expected to keep interest rates unchanged. Officials say policy is well-positioned, despite political frustration.
China is adding stimulus: cutting rates, reducing bank reserve requirements, and increasing gold reserves for the sixth month in a row.
Markets
U.S. stock futures are higher.
The U.S. dollar is recovering after three days of declines.
The U.S. and China will restart trade talks — the first since the Trump-era tariff war.
Companies
Novo Nordisk shares are rising on expectations of less competition for its obesity drug Wegovy.
WeightWatchers has filed for bankruptcy.
Earnings reports this morning: Walt Disney, Uber, Barrick Gold.
Earnings reports this afternoon: Arm Holdings, Occidental Petroleum, Carvana, Flutter.
Key Support and Resistance Levels
Resistance Level 1: 20,190
Resistance Level 2: 20,510
Resistance Level 3: 20,930
Support Level 1: 19,330
Support Level 2: 19,020
Support Level 3: 18,570
This communication is for informational purposes only and should not be viewed as any form of recommendation as to a particular course of action or as investment advice. It is not intended as an offer or solicitation for the purchase or sale of any financial instrument or as an official confirmation of any transaction. Opinions, estimates and assumptions expressed herein are made as of the date of this communication and are subject to change without notice. This communication has been prepared based upon information, including market prices, data and other information, believed to be reliable; however, Trade Nation does not warrant its completeness or accuracy. All market prices and market data contained in or attached to this communication are indicative and subject to change without notice.

nasdaq us100 buy/longtarrifs
interest rates
use proper risk management
#interest rates
#fomc
#ppi
#cpi
#jerome powell

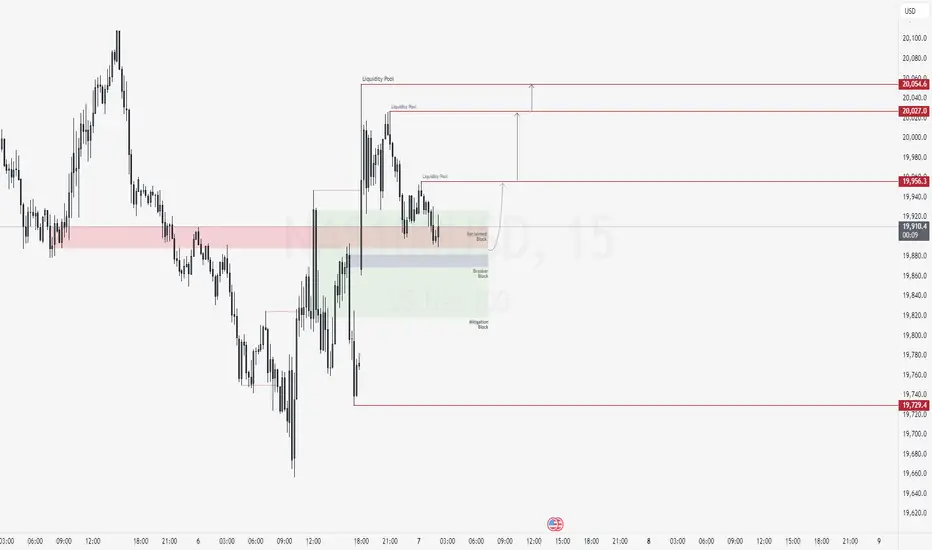
NAS100USD: Institutional Support Fuels Bullish MomentumGreetings Traders,
In today’s analysis of NAS100USD, we observe that institutional order flow remains bullish, and as such, we aim to align our trading opportunities with this directional bias.
Key Observations:
Institutional Support Zones:
Price has recently retraced into a significant institutional support area—a large mitigation block, where smart money typically mitigates previous sell orders and initiates new buy orders. This zone is further reinforced by the presence of a reclaimed order block, signaling an area where prior institutional buying occurred and may now be re-engaged.
Confluence of Bullish Arrays:
The alignment of the mitigation block, reclaimed order block, and an adjacent breaker block provides strong confluence. While price is currently showing signs of rejection at this zone, it is important to exercise patience and wait for confirmation before entering, especially given the size of the mitigation block.
Trading Strategy:
Upon confirmation, we will look to initiate long positions from these institutional support levels, targeting liquidity pools resting in premium pricing zones where buy-side liquidity is likely to reside.
Stay disciplined and let the market confirm your narrative.
Kind Regards,
The Architect
NASDAQ Weekly Outlook - Potential ShortsPrice pushed up on Friday 25 May into an area of imbalance at 20170 and closed.
Then we have Monday which pushed up through out the day and failed to break and close above Friday 25th Hi, ending the day inside of Fridays candle followed by Tuesday being bear and failing to break and close above Monday hi candle but managed to break and close below Mondays candle close.
By this creating the high of the week, on a weekly time frame, reason for the short is to fill the daily volume imbalance highlighted in yellow. As price always needs to fill gaps in the market left behind by inefficient price action.
Only then I assume one could start looking for longs, as all sell side liquidity has been cleared.

Technical Breakdown on US100 | 1H TimeframeHere’s a professional technical breakdown of the US100 Cash CFD (1H timeframe) using Volume Profile, Gann, and CVD + ADX indicators:
1. Key Observations (Volume, Gann & CVD + ADX Focused)
a) Volume Profile Insights:
Value Area High (VAH): 19,979.00
Value Area Low (VAL): 19,845.22
Point of Control (POC):
Recent POC: 19,979.52
Prior POC: 19,845.22
High-volume nodes: Clearly seen around 19,845 and 19,880–19,980, indicating buyer-seller equilibrium.
Low-volume gaps: Between 19,900–19,950 and below 19,800–19,700 — price can move fast through these zones.
b) Liquidity Zones:
Stops Likely Clustered:
Above 20,000 (psychological + prior swing high)
Below 19,800 (swing low and zone of previous rejection)
Absorption Zones:
Notable delta-based absorption occurred around 19,845 and 19,880 zones, indicating institutional activity.
c) Volume-Based Swing Highs/Lows:
Swing High (with spike): 19,980–20,000 (strong volume + reversal candle).
Swing Low (with spike): 19,845 zone, also aligns with historical POC, confirming strong defense.
d) CVD + ADX Indicator Analysis:
Trend Direction: Range-bound to Bearish bias
ADX Strength:
ADX is hovering near 20, not confirming a strong trend.
DI- > DI+ suggests slight downward pressure.
CVD Confirmation:
Flat to slightly falling CVD with price stalling = Supply is outweighing demand, slight bearish bias.
2. Support & Resistance Levels
a) Volume-Based Levels:
Support:
19,845.22 (POC + VAL)
19,800 (swing low and absorption)
Resistance:
19,979.52 (POC)
20,000 (psychological + rejection zone)
b) Gann-Based Levels:
Confirmed Swing High: 20,000
Confirmed Swing Low: 19,845
Key Retracements (From 19,845 to 20,000):
1/2: 19,922
1/3: 19,896
2/3: 19,969
3. Chart Patterns & Market Structure
a) Trend: Range-bound to Slightly Bearish
Price is stuck between 19,845–19,979 with no clear breakout or breakdown.
b) Notable Patterns:
Horizontal consolidation forming after a failed breakout near 20,000.
Bearish bias is developing with failure to hold above POC.
Watch for breakout from the descending triangle setup forming.
4. Trade Setup & Risk Management
a) Bullish Entry (Only if breakout above resistance):
Entry Zone: 19,985–20,000 (break + retest)
Targets:
T1: 20,100
T2: 20,300
Stop-Loss (SL): 19,940 (below breakout level)
RR: Minimum 1:2
b) Bearish Entry (If CVD + ADX confirm downtrend):
Entry Zone: 19,845–19,860 (retest of support failure)
Target:
T1: 19,700
Stop-Loss (SL): 19,980
RR: Minimum 1:2
c) Position Sizing: Risk 1–2% of capital per trade.

NQ: Prior to the FEDAs expected, NQ is consolidating.
Tomorrow is a big day in terms of looking forward. What should we expect from the FED?
1- FED Mandate is: Employment and Inflation
2- FED has always said: FED policy is data related.
The latest data on both Employment and Inflation were not sufficiently bad to rationalize the rate cuts and feed Trump's pressure.
Hence, I think the FED won't give any hint tomorrow about the rate cut on June. This will disappoint market and a Sell-off of stocks and equities will be massive. The start of Wave 3.
The other scenario will send stocks and equities up in a zigzag move: Down then up.
Gold as a lead indicator has resumed up its direction. This might be a sign of what is coming for equities.
Have a good evening/night!

Nasdaq - Printing The Obvious Bottom!Nasdaq ( TVC:NDQ ) already finished the correction:
Click chart above to see the detailed analysis👆🏻
After we witnessed a minor "crash" of about -25% over the past couple of weeks, the bottom might be in on the Nasdaq. We simply saw another very bullish all time high break and retest and depite the possibility of a second retest, I am (still) extremely bullish at these levels.
Levels to watch: $17.000
Keep your long term vision,
Philip (BasicTrading)

X2: NQ/US100/NAS100 Long - Day Trades 1:2X2:
Risking 1% to make 2%
NAS100, US100, NQ, NASDAQ Long for day trade, with my back testing of this strategy, it hits multiple possible take profits, manage your position accordingly.
Risking 1% to make 2%
Use proper risk management
Looks like good trade.
Lets monitor.
Use proper risk management.
Disclaimer: only idea, not advice

NASDAQ: Rebounding on the 4H MA50. New High for the Channel Up.Nasdaq is marginally bullish on its 1D technical outlook (RSI = 56.883, MACD = 127.320, ADX = 37.197) and is rebounding today on the 4H MA50, right before the HL of the Channel Up. This is a technical bottom that calls for a buy. We aim for a new +6% bullish wave (TP = 20,800).
## If you like our free content follow our profile to get more daily ideas. ##
## Comments and likes are greatly appreciated. ##

Hanzo | Nas100 15 min Bearish Break – Next Move is Confirmed 🆚 Nas100 – Hanzo’s Strike Setup
🔥 Timeframe: 15-Minute (15M)
——————
💯 Main Focus: Bearish Break at 19870
We are watching this zone closely.
———
Analysis
👌 Market Signs (15M TF):
• Liquidity Grab + CHoCH at 20030
• Liquidity Grab + CHoCH at 19750
• Strong Rejections seen at:
➗ 19890 – Major support / Key level
➗ 20050 – Proven resistance
🩸 Key Zones to Watch:
• 19950 – 🔥 Bullish breakout level X 7 Swing Retest
• 19980 – Strong resistance (tested 5 times)
• 19900 – Equal lows
• 19980 – Equal highs

Nasdaq 100 off lows on Bessent remarksUS stocks trimmed their earlier losses after the Trump administration delivered the latest dose of jawboning. This time it was trade secretary Scott Bessent, saying trade negotiations with several partners are going well and that there is a possibility of “substantial reduction” in tariffs on US goods. He added some deals could be announced as early as this week. That was enough to trigged dip-buying, causing major indices like the Nasdaq to bounce off their earlier lows.
The Nasdaq has found a bit of resistance in the last couple of days from the area shaded on the chart between 20,000 to around 20,150 where it had previously encountered support. See area shaded on the chart. A closing break above here is what the bulls would be eying this week, although for that to happen, some trade deals may well have to be announced first.
By Fawad Razaqzada market analysts with FOREX.com

The Nasdaq 100’s rally may be coming to an endThe Nasdaq 100 has staged an impressive rally over the past two weeks, climbing more than 12% since Monday 21 April to close at roughly 19,970 on Monday 5 May. However, if there were a point at which the advance might pause, it could be near current levels. The index has risen to a key area of technical resistance in the 19,900 to 20,200 range, which could prove challenging to break through, especially given the uncertain outlook.
One driver behind the Nasdaq 100’s rise has been the fall in implied volatility, as indicated by the VXN. While the better-known Vix measures expected volatility in the S&P 500 over the next month of trading, the VXN measures volatility on the Nasdaq 100. It has recently dropped to a reading of 25.7, down from more than 50 in April, as shown on the chart below. This decline in implied volatility probably triggered significant unwinding of put positions in the options market, allowing market-maker hedging flows to provide a tailwind for stocks. But with the VXN now back at levels last seen on 2 April, this tailwind may no longer be available to support the market.
Additionally, the Nasdaq 100 has returned to the 61.8% retracement level, a significant Fibonacci level that frequently acts as strong resistance and could help determine whether the recent rebound is genuine or merely a short-term blip. Just above this 61.8% retracement lies the 200-day moving average, another level that typically provides strong resistance. Furthermore, the 19,950 region has consistently acted as both support and resistance, dating back to June 2024. With these three resistance areas converging, it may be challenging for the tech-heavy index to sustain its upward momentum. Should stocks begin to reverse lower, initial support may be around 19,300, followed by a gap at 18,240.
That said, if the Nasdaq 100 somehow manages to overcome all these hurdles, it could rise to 21,100 – though such a move appears unlikely at this stage.
Written by Michael J. Kramer, founder of Mott Capital Management
Disclaimer: CMC Markets is an execution-only service provider. The material (whether or not it states any opinions) is for general information purposes only and does not take into account your personal circumstances or objectives. Nothing in this material is (or should be considered to be) financial, investment or other advice on which reliance should be placed.
No opinion given in the material constitutes a recommendation by CMC Markets or the author that any particular investment, security, transaction, or investment strategy is suitable for any specific person. The material has not been prepared in accordance with legal requirements designed to promote the independence of investment research. Although we are not specifically prevented from dealing before providing this material, we do not seek to take advantage of the material prior to its dissemination.

NAS - SLOWLY enter the long positionTeam, NAS time to buy slowly
We been waiting for the last two day
as we expect market will drop before RATE announcement
this is a good entry but buy slowly
if it drop to second box, double up.. the volume
Trade with confident.

NAS100 buy now more than 1-10RRNAS100 buy now more than 1-10RR. The Ideia I shared before is confirmed for me. Lets see

NQ: Consolidation phaseWhile market is waiting for a clear hint from the FED or a concluded deals on tariffs, NQ has entered in a consolidation phase.
