CRT analysis on US100there is a daily rejection from last week previous high, causing a turtle soup
using the h1 change in structure delivery I have marked a a valid CISD and we look to sell from that zone
USTEC trade ideas

XAUUSD /US 100 / BTCUSDT forecast 06/06/2025XAUUSD /US 100 / BTCUSDT Forecast | VSA & Trend Line Analysis | Gold Price Prediction
In this video, I share my detailed forecast for XAUUSD (Gold vs. USD) using Volume Spread Analysis (VSA) and trend line strategies. Watch as I break down the market structure, identify key levels, and explain the logic behind potential moves in gold/US 100 /BTCUSDT .

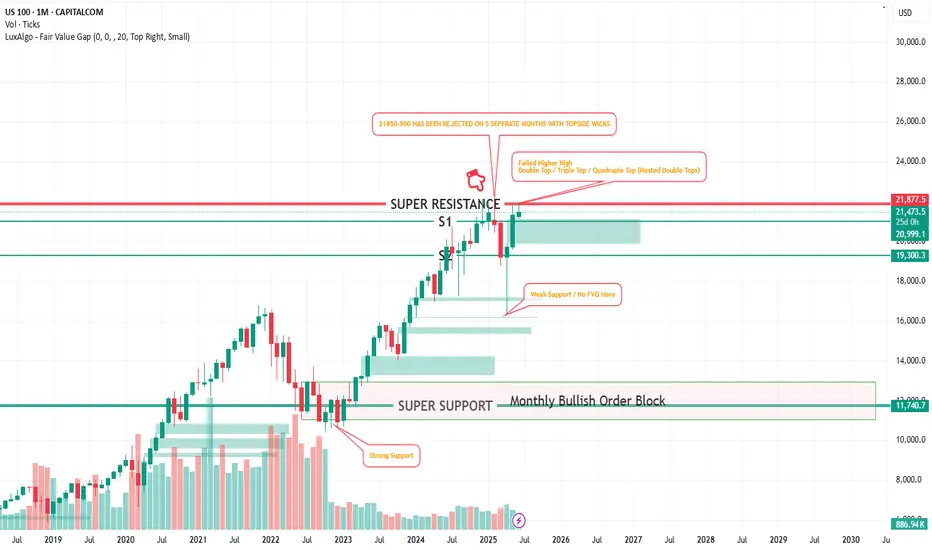
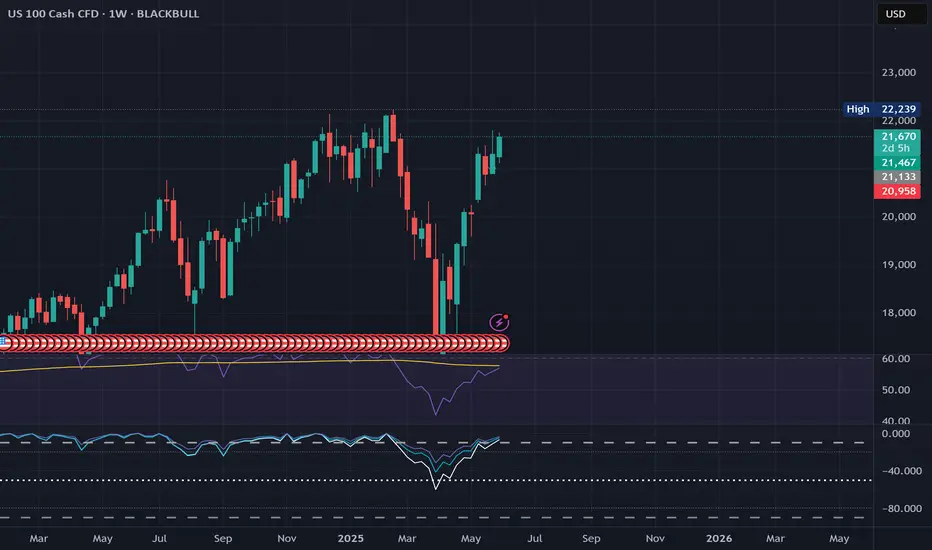
Down, Down Down, Down Down Down This idea tags onto my my other live idea on the Nasdaq (see my linked posts)
As we are still near the TOP as bullish euphoria is still present, I think now would be a good time to put my main POI's for the next 2 months out there:
21000
19300
11800
What are your POIs?
Clairfication of NDQ Elliott Wave PatternA request was made for clairification of my recent NDQ Elliott wave count.
This is a detailed count of NDQ - Minuette wave (iii).

A Nasdaq Black Hole - Unprecendented yes, Impossible no Before anyone says anything...yes Elliot Waves are completely subjective BUT IMHO i have drawn these correctly....
The NAS made a violent move from 22100 down 16300 in a very short space of time. So what? It will just make another ATH right?
Well, of course. It almost certainly will, the real question is when. If this pattern plays out, it won't be in 2025.
After every impulse on any timeframe, long or short, you'd naturally expect a pullback.
However, not all pullbacks are the same. Usually, the first significant pullback for a corrective wave is no more than 50%.
However, if you have a pullback that is 61.8% or more, it is usually considered an impulsive wave.
What the difference? Corrective waves have3 waves, ultimately trending in one direction, and impulsive waves have 5 waves trending in one direction.
If the Nasdaq falls beneath 20900, with increasing volume, this will signify confirmation to me at least, that we could be starting one of the most violent impulsive bearish waves in the history of financial markets.

nasdaq. a good time to sellIn my view, it’s time to sell the Nasdaq. We’ve reached new highs, and last month was the best May in over 30 years — statistically, this alone calls for caution.
Even though the economy appears strong on the surface, and market fears around DAS and Trump have faded, investors are ignoring the real issue: U.S. public debt. This is the elephant in the room.
With recent labor data pointing toward potential weakness, the risk of a major recession is increasing. If employment starts to deteriorate, the U.S. won’t be able to refinance its ever-growing debt. Trillions in interest payments are coming due soon — around $3 trillion, which is equivalent to the entire Italian public debt. The U.S. needs to roll over roughly a third of its debt, and fast.
Given all this, I don’t see any solid reason to be buying Nasdaq at current levels. It’s rallied extremely fast, and I see a retracement toward 20,000 as a realistic scenario — potentially even lower if upcoming economic data disappoints.

NASDAQ - SellsHey fellow traders - did you see the sells today on the US100?
Same as a few other pairs - had very good signal alerts to have take.
As per instructions - you always enter on the label print with SL above or below the signal bar - depending on buys or sells.
Hope you are enjoying the indicators we made available.

Stocks on the rise...The NASDAQ is on its way to print a new ATH. Shoutout to the lads still waiting on a 2008-style meltdown.
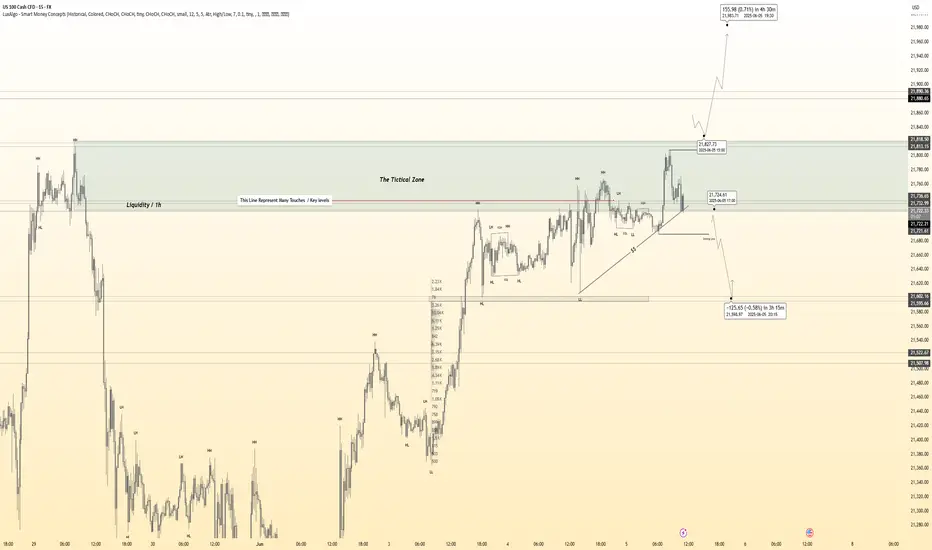
Hanzo / Nas100 15 Min Path ( Tactical Bearish Break Out Zone )🔥 Nas100 – 15 Min Scalping Analysis (Bearish Setup)
Bias: Waiting For Break Out
Time Frame: 15 Min
Entry Type: Confirmed Entry After Break Out
👌Bearish After Break : 21720
Price must break liquidity with high volume to confirm the move.
☄️ Hanzo Protocol: Dual-Direction Entry Intel
➕ Zone Activated: Strategic Reaction from Refined Liquidity Layer
Marked volatility from a high-precision supply/demand zone. System detects potential for both long and short operations.
🩸 Momentum Signature Detected:
Displacement candle confirms directional intent — AI pattern scan active.
— If upward: Bullish momentum burst.
— If downward: Aggressive bearish rejection.
NASDAQ at Weekly Supply Zone – Bearish Breakdown Ahead? (READ)By examining the #Nasdaq chart on the weekly timeframe, we can see that the price is currently trading within the supply zone around 21,400. If it manages to close and stabilize below 21,100, we can expect further downside for this index. The potential bearish targets are 21,000, 20,700, 20,200, and 19,150. The key supply zone ranges from 21,400 to 22,200.
Please support me with your likes and comments to motivate me to share more analysis with you and share your opinion about the possible trend of this chart with me !
Best Regards , Arman Shaban

Bearish Three DivesBearish pattern hit on the 15 minute. Expecting a drop to 21k. Still bullish on the larger timeframes

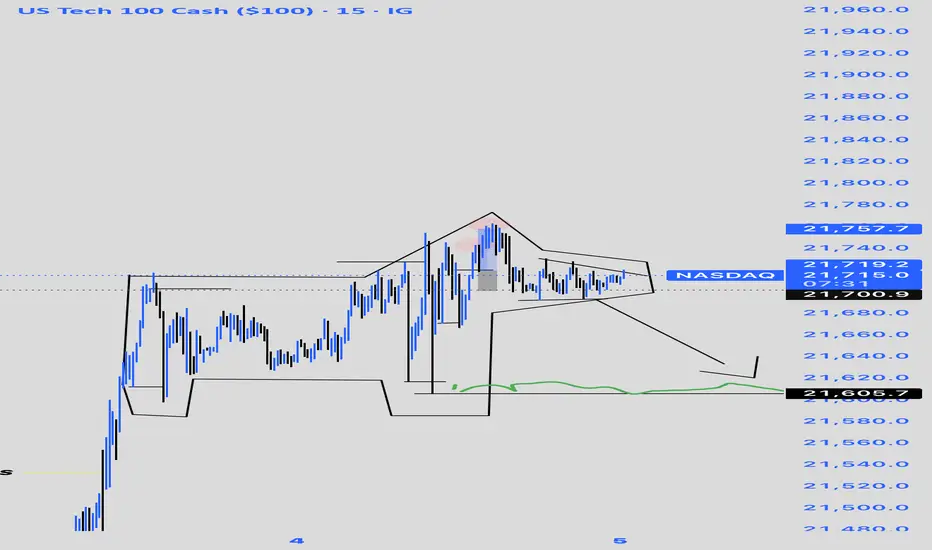
Why the Dinosaur Wants to Eat GrassHistorically, when price consolidates into a triangle (like the dino’s head here), it often signals compression before a significant move. In this case, the consolidation sits just below a key supply zone (21,750 area), forming a potential distribution top.
But why is our dinosaur looking to munch on that green grass down below (support around 21,605)?
• Similar formations during periods of exhaustion or after rapid rallies often result in sharp corrections.
• The green grass represents liquidity pools and prior demand where big players could reload.
• Note the sharp impulse up (the dinosaur’s neck) followed by a lack of momentum — a classic sign of weakening bulls.
So, just like in nature, when the top gets too dry and competitive, the dino (price) has to drop down to graze on safer, more nourishing grounds the unfilled orders lying at support
* NOT FINANCIAL ADVISE*
ALL GENERAL MARKETS at our close to May16 ExpirationsSeems Market makers have set up their Options to profit from a flat MARKET
Thoughts : ( Please comment you can just type in your number 1 or 2 )
1) Are the Market being held back from rallying higher ?
or
2) Are the Market being held back from Correcting deeper ?

Hedge funds are unusually bearish and here's why...We have a huge dealing range to short into and still remain bullish, it's basically free money on technical retracement/correction while not ruining the market.
The retailers have been buying since April but there is no institutional orderflow evidenced by no peak above average volume levels.
Technicals will reign supreme here. Trump is either trolling about the rate decrease or he has no idea about chart technicals 😮💨. I bet he's trolling, as he has cabinets on cabinets of market advisors who know fully how correction cycles work.

Nasdaq-100 H1 | Falling toward a pullback supportThe Nasdaq-100 (NAS100) is falling towards a pullback support and could potentially bounce off this level to climb higher.
Buy entry is at 21,516.72 which is a pullback support that aligns close to the 38.2% Fibonacci retracement.
Stop loss is at 21,340.00 which is a level that lies underneath an overlap support and the 50.0% Fibonacci retracement.
Take profit is at 21,803.01 which is a swing-high resistance.
High Risk Investment Warning
Trading Forex/CFDs on margin carries a high level of risk and may not be suitable for all investors. Leverage can work against you.
Stratos Markets Limited (tradu.com ):
CFDs are complex instruments and come with a high risk of losing money rapidly due to leverage. 63% of retail investor accounts lose money when trading CFDs with this provider. You should consider whether you understand how CFDs work and whether you can afford to take the high risk of losing your money.
Stratos Europe Ltd (tradu.com ):
CFDs are complex instruments and come with a high risk of losing money rapidly due to leverage. 63% of retail investor accounts lose money when trading CFDs with this provider. You should consider whether you understand how CFDs work and whether you can afford to take the high risk of losing your money.
Stratos Global LLC (tradu.com ):
Losses can exceed deposits.
Please be advised that the information presented on TradingView is provided to Tradu (‘Company’, ‘we’) by a third-party provider (‘TFA Global Pte Ltd’). Please be reminded that you are solely responsible for the trading decisions on your account. There is a very high degree of risk involved in trading. Any information and/or content is intended entirely for research, educational and informational purposes only and does not constitute investment or consultation advice or investment strategy. The information is not tailored to the investment needs of any specific person and therefore does not involve a consideration of any of the investment objectives, financial situation or needs of any viewer that may receive it. Kindly also note that past performance is not a reliable indicator of future results. Actual results may differ materially from those anticipated in forward-looking or past performance statements. We assume no liability as to the accuracy or completeness of any of the information and/or content provided herein and the Company cannot be held responsible for any omission, mistake nor for any loss or damage including without limitation to any loss of profit which may arise from reliance on any information supplied by TFA Global Pte Ltd.
The speaker(s) is neither an employee, agent nor representative of Tradu and is therefore acting independently. The opinions given are their own, constitute general market commentary, and do not constitute the opinion or advice of Tradu or any form of personal or investment advice. Tradu neither endorses nor guarantees offerings of third-party speakers, nor is Tradu responsible for the content, veracity or opinions of third-party speakers, presenters or participants.

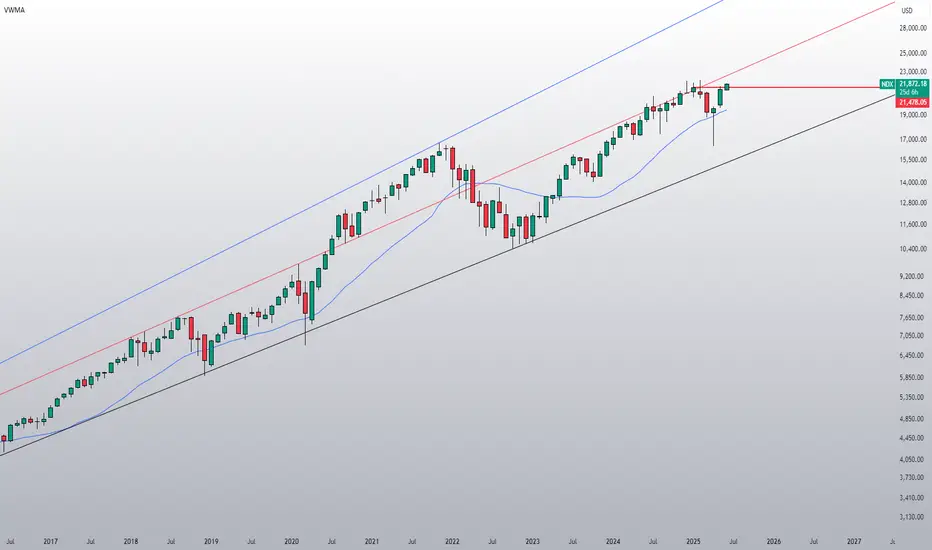
Nasdaq 100 - Bearish Elliott Wave CountThe Nasdaq 100 (NDQ) has a completed extended Elliott five wave Impulse pattern from the 04/07/25 bottom.
Three - hour Stochastic is in the overbought zone and on the verge of a bearish cross.
RSI and MACD have bearish divergences.
A break below the rising trendline could be an important sell signal.

Nas100 1. Determine the Higher Timeframe Bias
Look at Daily & 4H charts.
Identify: Is market forming higher highs/lows (bullish) or lower highs/lows (bearish)?
2. Mark Liquidity Pools
Find equal highs/lows – where smart money will draw price to.
These often act as targets.
3. Find Displacement & Fair Value Gaps
If price made a strong move away from a level (displacement), look for a FVG on 1H/4H/Daily to see if price might retrace before continuing.
4. Use Premium/Discount Tool
From the recent swing high to low (or vice versa), divide the range.
Price in discount = buy zone; in premium = sell zone.
5. Mark Key Session Times
Focus on New York Open (8:30–11:00 am EST) – high-probability moves.

Nasdaq - The final bullrun breakout!Nasdaq - TVC:NDQ - might break above all structure:
(click chart above to see the in depth analysis👆🏻)
It is quite incredible how volatile stocks have been lately, especially considering that fact that the Nasdaq is about to create new all time highs again. Consequently, we are about to witness a significant structure breakout, which would ultimately lead to another rally of about +30%.
Levels to watch: $21.000
Keep your long term vision!
Philip (BasicTrading)

Hanzo / Nas100 15 Min Path ( Tactical Break Out Zones )🔥 Nas100 – 15 Min Scalping Analysis (Bearish Setup)
Bias: Waiting For Break Out
Time Frame: 15 Min
Entry Type: Confirmed Entry After Break Out
👌Bullish After Break : 21740
Price must break liquidity with high volume to confirm the move.
👌Bearish After Break : 21590
Price must break liquidity with high volume to confirm the move.
☄️ Hanzo Protocol: Dual-Direction Entry Intel
➕ Zone Activated: Strategic Reaction from Refined Liquidity Layer
Marked volatility from a high-precision supply/demand zone. System detects potential for both long and short operations.
🩸 Momentum Signature Detected:
Displacement candle confirms directional intent — AI pattern scan active.
— If upward: Bullish momentum burst.
— If downward: Aggressive bearish rejection.

Beautiful Market Maker on the Nasdaq this early morning.This will be an entire move downward that no one is picking up on right now. With price in the perfect sell position, we're looking to collect on the spread between greed and far like a true market maker
SELL NAS 100! TRADE WHAT YOU SEE NOT WHAT YOU FEELSell confirmations on 1 HR TF
1. Fair Value Gap retracement
2. Double top aligned with Fair Value Gap
3. If TL broken, another confirmation of a sell.
Basic trading, no stress, no complications - trade what you see and not what you feel.
Take Profit level - I am holding until Friday, but you can take profit if the money makes you smile.

SELLING NAS100 TODAY!Sell confirmations on 1 HR TF
1. Fair Value Gap retracement
2. Double top aligned with Fair Value Gap
3. If TL broken, another confirmation of a sell.
Basic trading, no stress, no complications - trade what you see and not what you feel.
Take Profit level - I am holding until Friday, but you can take profit if the money makes you smile.

