USTEC trade ideas
NQ: Upcoming Weekly analysis!FA Analysis:
1- Tariff On/Off: The noise will continue this week as well. Europe will be the target this week.
Uncertainty OR Eternity pause? Market might tend towards Eternity pause which is positive for stocks and equities.
2- New Earnings season: This will be on the driver seat for the next few weeks. Positive earnings for major stocks will impact positively NQ and vice-versa.
3- Macroeconomic data:
CPI and PPI will be relevant for July rate cut. Lower and inline inflation will be very good for July Rate cut; hence very good for Equities. Higher inflation data will be bad.
Also, Consumer sentiment and Inflation expectations, later in the week, will be very relevant.
So from FA Analysis, US equities might go either direction based on data outcomes.
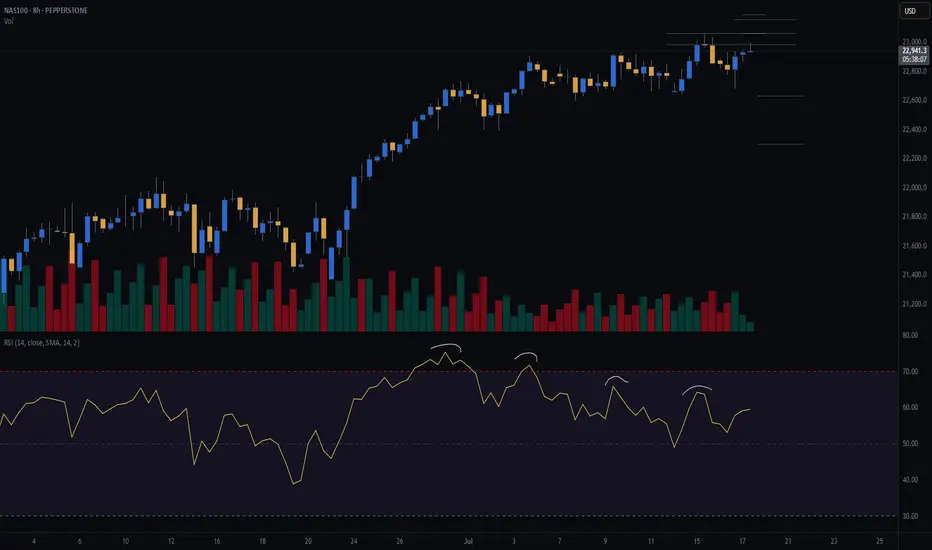
TA Analysis:
Weekly TF: Direction is Buy!
The weekly close was irrelevant; it was inside the bullish green candle. Price must break and close below or above the master weekly candle to establish clear direction.
So nothing to trade from weekly perspective.
Daily TF: Direction is Neutral!
Same as weekly TF, we got an irrelevant daily close, inside the previous daily green candle (red dotted lines).
Price must break and close either below or above the dotted red lines for a clear direction.
Hourly TF: Direction is Neutral!
Based on the Weekly and Daily TF, clearly price is consolidating and looking for FA data to make decision on the next move.
Price is making LL-LH-HL-HH... and switching from one side to another reinforcing the consolidation.
Here are two scenarios:
Scenario 1: Good earnings, macroeconomic data and lower inflation will trigger a new ATH.
Scenario 2: Bad earnings, macroeconomic data and higher inflation will trigger a retrace.
Happy green week!

NAS100 formed a bullish Flag Wait for Breakout NAS100 has recently formed a Flag pattern and price is currently consolidating in the flag channel(box) pattern and wait for the breakout can easily take the price to 23500-23600.

NAS100/US100 Short Swing Trade for week Risking 1% to make 2%PEPPERSTONE:NAS100 / CAPITALCOM:US100 Short trade for week - its swing trade, with my back testing of this strategy, it hits multiple possible take profits, manage your position accordingly.
This is good trade, don't overload your risk like greedy, be disciplined trader, this is good trade.
Use proper risk management
Looks like good trade.
Lets monitor.
Use proper risk management.
Disclaimer: only idea, not advice

#NDQ - Weekly Targets 23197.39 or 21886.08 ?Date: 03-07-2025
#NDQ - Current Price: 22641.89
Pivot Point: 22541.74 Support: 22335.83 Resistance: 22748.58
#NDQ Upside Targets:
Target 1: 22832.49
Target 2: 22916.40
Target 3: 23056.89
Target 4: 23197.39
#NDQ Downside Targets:
Target 1: 22251.45
Target 2: 22167.08
Target 3: 22026.58
Target 4: 21886.08

NAS100 (Cash100) Double Top H8Potential short on NAS100.
Risk/reward = 5.4.
Entry = 22 956
Stop loss = 23 059
TP level 1 = 22 473 (50% of position)
T level 2 = 22 303 (50% of position)
RSI divergence.
Waiting for closure of current H8 candle to close in range.
Looking for lower volume on H8 closure, however, will make exception id higher since top 1 was on Thursday the 3rd and markets closed early.

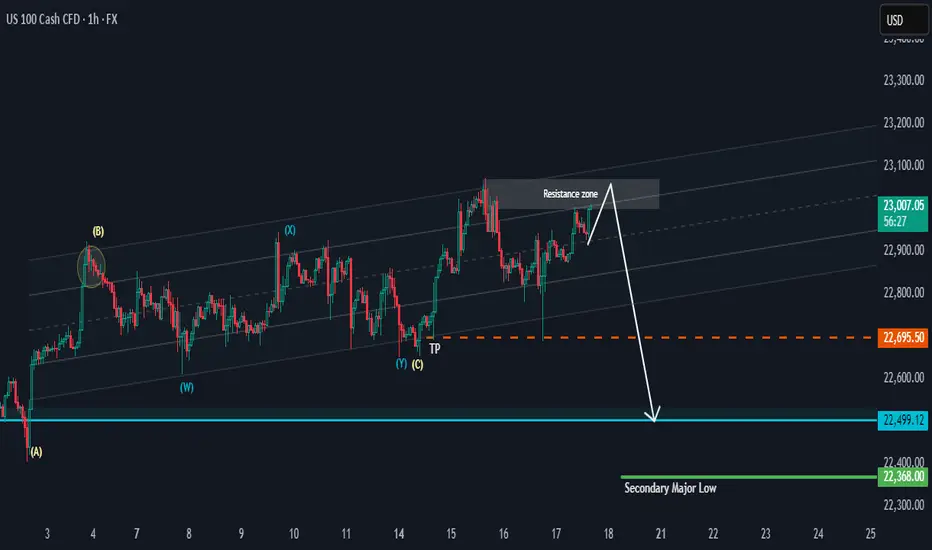
NAS 100 Potential PullbackHi there,
NAS100 has the potential to drop as it keeps testing the resistance zone in the range of 23100. This looks more like bull exhaustion than a reversal. The 22695.50 is the target for a bias of 22499.12
The overall bigger trend is bullish, with price highs aiming as far as 23717.44, 24837.28, and 26222.31, making this a potentially massive bullish trend, and it will take time to reach those highs.
Happy Trading, 🌟
K.
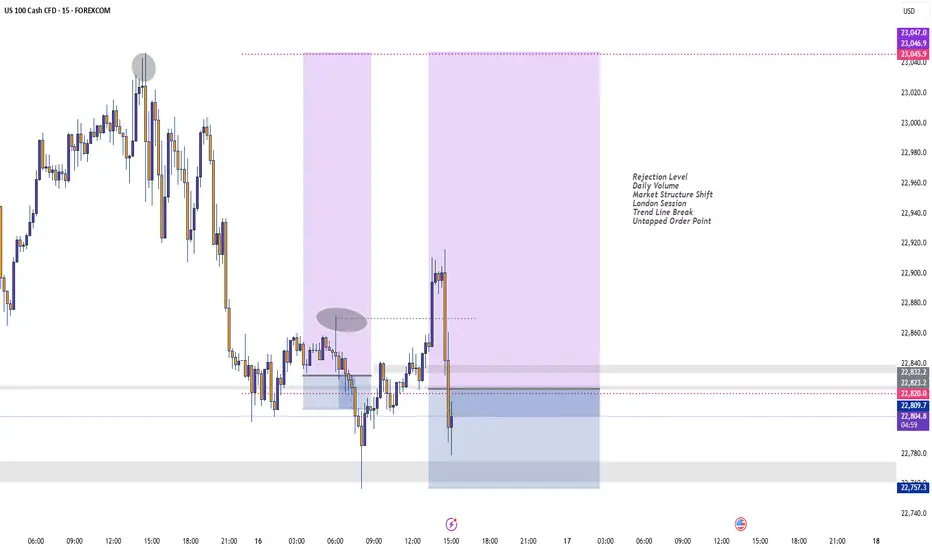
BuyRejection Level
Daily Volume
Market Structure Shift
London Session
Trend Line Break
Untapped Order Point
US100 Market Open BuyLooking for a liquidity buy on US100 at market open. Allow the price to open a push a little down towards the trigger line at 22700. Target will be a +150 pip move up to 22850.

Weekly Close High to HOLD?As expected Nas100 will end in a weekly high after hitting a nice fresh record due to TSMI stock among other things like Trump walking back on firing Jermone Powell.
Technicals tell me that this is extremely overbought and I wonder if this will continue I cannot believe this rally. AS LONG as it holds the 23100 to 23150 range then it could break out again and set another high but I would be cautiously optimistic. Somebody's got to take the profit!
NASDAQ 100: AI Momentum and Resilient Earnings Drive New HighsThe NASDAQ 100 continues its strong uptrend 📈, recently breaking to new highs after a period of consolidation. The rally is broad-based but remains led by heavyweight tech names and AI-related stocks 🤖.
Key Fundamental Drivers:
AI & Tech Growth 🤖💡: The biggest catalyst is the ongoing boom in artificial intelligence and digital transformation. Companies in the index, especially the “Magnificent Seven” (like NVIDIA, Microsoft, Apple), are seeing robust earnings growth and strong investor demand for AI exposure. Global IT spending is projected to grow by over 9% in 2025, with AI spending up nearly 30% year-on-year.
Earnings Resilience 💪💰: Despite high interest rates and inflation, tech companies have adapted well, maintaining strong margins and growth. The sector is expected to remain a top performer through 2025.
Fed Policy & Rate Expectations 🏦🔮: Markets are increasingly pricing in a pause or even cuts in US interest rates later in 2025, which is bullish for growth stocks and tech-heavy indices like the NASDAQ 100.
Geopolitical & Macro Factors:
Reduced Uncertainty 🌏🕊️: The market has absorbed major geopolitical shocks (such as the Israel-Iran conflict and US-China trade tensions), and the resolution or de-escalation of these risks has reduced uncertainty, supporting risk assets.
US Election & Policy 🇺🇸🗳️: The outcome of the US election and expectations for stable or pro-business policies have also contributed to positive sentiment.
Global Supply Chains & Resilience 🌐🔗: While some risks remain (e.g., cyber threats, regulatory changes, and supply chain disruptions), the tech sector’s global reach and adaptability have helped it weather these challenges.
Why is it rallying now?
AI optimism and strong tech earnings are the main drivers 🤖💹.
Expectations of easier Fed policy and a resilient US economy are fueling risk appetite 🏦📈.
Geopolitical risks have eased or are being priced in, allowing investors to focus on growth 🌍🕊️.
Summary:
The NASDAQ 100’s rally is powered by AI-driven tech growth 🤖, resilient earnings 💪, and easing macro/geopolitical risks 🌏. The index remains a global leader as investors bet on the next wave of technology and digital innovation 🚀.

NAS100 (CASH100) SHORT - Double Top H8Risk/reward = 4.6
Entry price = 23 063
Stop loss price = 23 190
Take profit level 1 (50%) = 22 635
Take profit level 2 (50%) = 22 303
Still waiting for confirmation on some variables.
For example, need H8 candle to close in range and volume to validate, amongst other variables.
"NASDAQ 100: THE TECH ROBBERY! – Quick Profits Before Reversal?"🔥 "The NDX NASDAQ 100 INDEX Heist: Bullish Loot & Escape Before the Trap!" 🔥
🌟 Hi! Hola! Ola! Bonjour! Hallo! Marhaba! 🌟
Dear Money Makers & Market Robbers, 🤑💰💸✈️
Based on the 🔥Thief Trading Style🔥 (technical + fundamental analysis), here’s our master plan to heist the NDX - NASDAQ 100 INDEX. Follow the strategy on the chart—long entry is the play! Aim to escape near the high-risk RED Zone (overbought, consolidation, potential reversal). The bears are lurking, so take profits and treat yourself—you’ve earned it! 💪🏆🎉
🚀Entry (The Vault is Open!)
"Swipe the bullish loot at any price!"
For precision, place buy limit orders within 15-30min timeframe (recent swing lows/highs).
Set alerts! Don’t miss the heist.
🛑 Stop Loss (Safety Net)
Thief-style SL at nearest swing low (4H timeframe) → 21,770.00 (adjust based on risk/lot size).
🏴☠️ Target 🎯: 22,800.00
Bullish momentum is fueling this heist—ride the wave but exit before the trap!
📰 Fundamental Backing (Why This Heist Works)
Macroeconomic trends, COT data, geopolitics, and sentiment align for bullish moves.
Full analysis? Check 👉🔗🌎
⚠️ Trading Alerts (News & Risk Mgmt)
Avoid new trades during high-impact news (volatility = danger).
Use trailing stops to lock profits and dodge sudden reversals.
💥 Boost This Heist!
Hit 👍 (Boost Button) to strengthen our robbery squad!
More heists = More profits—stay tuned for the next steal! 🚀🤑
See you soon, fellow thieves! 🤝🎉

Upward momentum of Nasdaq paused by consolidationUpward momentum of Nasdaq paused by consolidation. Now resting on support of trendline. It may continue its upward momentum next week.

Trade, Fed, and Policy Developments Impacting NASDAQ 100Tariff Expansion Threat:
Donald Trump signaled upcoming tariffs on pharmaceuticals and semiconductors, two sectors heavily represented in the NASDAQ 100. These measures could:
Raise consumer costs.
Disrupt tech and healthcare supply chains.
Add margin pressure on multinational firms.
Corporate Impact:
Rio Tinto revealed $300M in losses from US aluminum tariffs on Canadian output.
Canada-US trade talks will intensify, but tariffs appear likely to remain, adding to cost overhang for manufacturers and downstream users.
Fed Leadership Uncertainty:
Kevin Hassett is emerging as the frontrunner to replace Fed Chair Jerome Powell in 2026.
Trump is critical of Powell, even citing Fed building renovation costs as a potential fireable offense.
This adds uncertainty to monetary policy continuity, especially as inflation rises and rate path expectations diverge.
401(k) and Private Equity Access:
The administration is finalizing an executive order allowing 401(k) plans to invest in private equity, a move that could:
Increase alternative asset exposure.
Boost private market valuations.
Signal a policy tilt toward financial market liberalization, which may help sustain risk sentiment in the medium term.
Conclusion for NASDAQ 100 (NSDQ100) Trading
The near-term risk for NASDAQ 100 is tilted negative due to the tariff threats on semiconductors and pharma, both major index components.
Fed leadership uncertainty could inject volatility into rate expectations, pressuring tech valuations sensitive to discount rate changes.
However, the longer-term policy shift toward broader 401(k) access to private markets could support overall market sentiment and capital flows.
Bias: Cautiously Bearish in the short term due to trade and Fed risks; neutral to slightly bullish medium term if private capital access reforms proceed and trade escalation is contained.
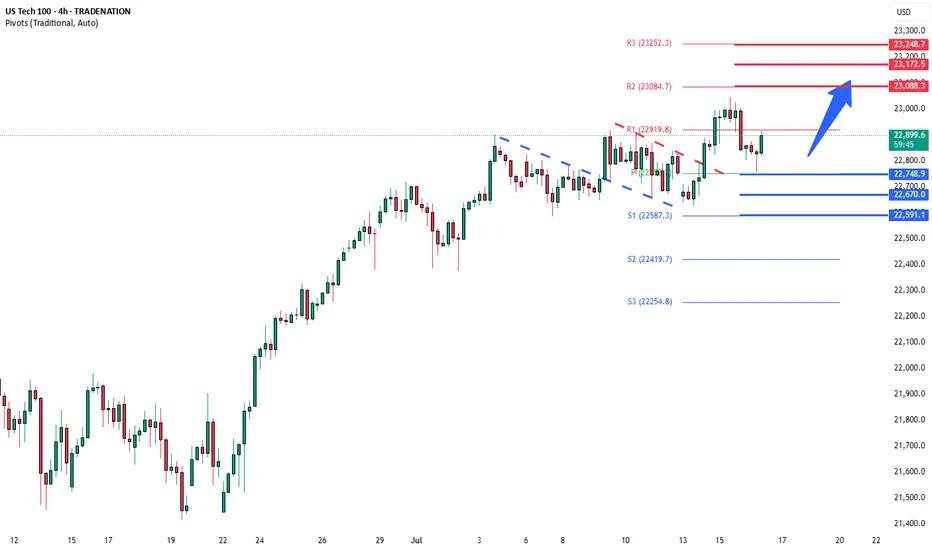
Key Support and Resistance Levels
Resistance Level 1: 23080
Resistance Level 2: 23170
Resistance Level 3: 23250
Support Level 1: 22750
Support Level 2: 22670
Support Level 3: 22590
This communication is for informational purposes only and should not be viewed as any form of recommendation as to a particular course of action or as investment advice. It is not intended as an offer or solicitation for the purchase or sale of any financial instrument or as an official confirmation of any transaction. Opinions, estimates and assumptions expressed herein are made as of the date of this communication and are subject to change without notice. This communication has been prepared based upon information, including market prices, data and other information, believed to be reliable; however, Trade Nation does not warrant its completeness or accuracy. All market prices and market data contained in or attached to this communication are indicative and subject to change without notice.
BUYRejection Level
Daily Volume
Market Structure Shift
London Session
Trend Line Break
Untapped Order Point

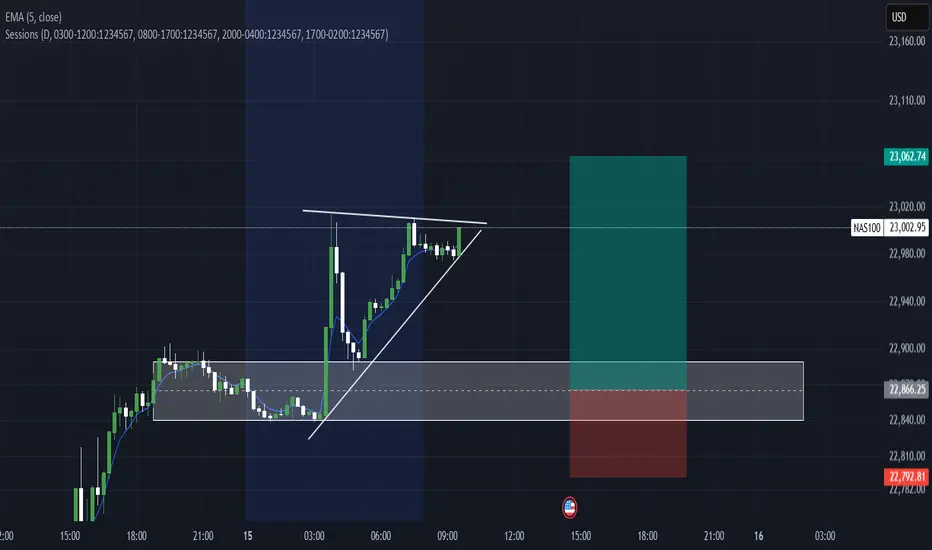
Nas100 Long We Currently Have an Ascending triangle (bullish continuation pattern) Forming After Asian Session & Price is consolidating just below the resistance level, forming higher lows.
We Have a Clearly defined demand zone below current price (gray box), Which also marks out our Bullish Order Block Formed Yesterday Which Price Should Come Retest Before Continuing Upwards.
Pro Tip for CPI Events
Expect increased volatility and fakeouts within the first few minutes.
Wait for a 5–15 min candle close for confirmation before entry.
Use lower timeframes (1m–5m) for entries, but keep higher timeframe structure in mind.
Remember To Like & Subscribe For More A+ Setups✅
NasdaqNon-commercials (hedge funds, asset managers, etc.) are adding significant long exposure.
This usually reflects confidence in continued upside, often in line with strong tech earnings, soft landing narratives, or a dovish Fed.
Bias: Bullish
Large speculators significantly increased long exposure on Nasdaq futures, showing strong confidence in continued upside momentum. This aligns with recent tech-led rallies and soft-landing expectations.

Double TopSet up forming on the hourly chart on the Dow. When or if we close bellow the 15:00 bar and if we don't trade above the recent highs in the meantime, it will be our trigger for selling short. Because its a big bar I believe there will be a price engineering from the big boys, therefore I will place a sell limit order a 50% retracement in relation to the 15:00 bar from yesterday in order to get in a optimum level.

Nasdaq Surges to New Highs – 23,200 and 24,000 in Sight? (READ)By analyzing the Nasdaq chart on the weekly timeframe, we can see that the index is currently trading around the 22,700 zone and has followed the main analysis perfectly so far — continuing to print new all-time highs.
According to the original outlook, as long as the index holds above 22,150, we can expect further bullish continuation toward the next targets at 23,200 and 24,000.
Please support me with your likes and comments to motivate me to share more analysis with you and share your opinion about the possible trend of this chart with me !
Best Regards , Arman Shaban

Nasdaq 100 Index 2-Hour Chart Analysis2-hour candlestick chart for the Nasdaq 100 Index (NDX) on the NASDAQ exchange. The chart spans from May to August, showcasing a significant upward trend with notable fluctuations. Key indicators include a recent price of 22,861.53, representing a 0.72% increase. The chart features technical analysis elements such as support and resistance levels, highlighted by green and red boxes, and a downward arrow suggesting a potential price movement.

NASDAQ 100 – Is Upside Momentum Still Evident?Tough talk on tariffs at the back end of last week and over the weekend from President Trump ahead of his 90 day pause deadline, which is due to end tomorrow (July 9th), helped to put a small dent in trader sentiment, slightly undermining the recent strong upside momentum seen in the US 100 index.
This led to a sell off from fresh all time highs of 22908 registered on July 3rd to a low of 22600 yesterday evening, as the letters sent by the US administration outlining import tariffs of 25% sent to Japan, South Korea and another 12 nations were unveiled.
However, the moves have been relatively muted since then as traders remain optimistic that there is still time for negotiation to agree trade deals given that the new tariffs won’t go into effect until August 1st, providing a potential further 3 weeks to move things along.
Looking forward, in a relatively quiet week for data and central bank speakers, the next moves in the US 100 index towards the Friday close may be dictated by updates on trade deals between the US and EU, and the US and India, both of which have been reported as moving closer to agreement. Technical trends could also be an important factor.
Technical Update: Is Upside Momentum Still Evident?
Future tariff news has the potential to continue to be a very important sentiment driver for global equities, particularly within the tech sector, which the US 100 index reflects within its constituents.
As a result, it can be useful to assess potential support and resistance levels within the US 100 index that traders may be focusing on to gauge the next possible direction for prices.
Possible Resistance Levels:
Since posting the April 2025 low at 16290, the US 100 index has rallied by over 40% in only a 13-week period. While this has reflected positive sentiment during this time, traders may well now be questioning if this upside momentum can continue, or if it might stall, even leading to price weakness.
As such, being aware of potential resistance levels against which to judge current price strength that might be able to hold and possibly reverse this latest activity back to the downside, may prove important.
Having previously been strong enough to hold recent price strength, the 22908 July 3rd all-time high, may now represent an area where sellers can be found again, and as such, this marks a potential first resistance focus.
However, closing breaks above 22908 might suggest a more extended phase of price strength, with traders then possibly looking to 23429, the upper weekly Bollinger band and on breaks above this, even towards 24482, which is equal to the 38.2% Fibonacci extension of the February to April 2025 price decline, as the next resistance levels.
Possible Support Levels:
Of course, just because a 40% advance in prices has been seen, doesn’t guarantee it will continue and traders may be trying to focus on support levels that if broken on a closing basis over the coming days, might suggest risks of a more extended decline in price.
Looking at the daily chart above, it might be suggested that the first support is currently represented by 22201, the level of the rising Bollinger mid-average. Closing breaks below 22201 could in turn lead to further price declines to test 22053, the 38.2% Fibonacci retracement of May 23rd to July 3rd price strength, even 21787, the deeper 50% retracement.
The material provided here has not been prepared accordance with legal requirements designed to promote the independence of investment research and as such is considered to be a marketing communication. Whilst it is not subject to any prohibition on dealing ahead of the dissemination of investment research, we will not seek to take any advantage before providing it to our clients.
Pepperstone doesn’t represent that the material provided here is accurate, current or complete, and therefore shouldn’t be relied upon as such. The information, whether from a third party or not, isn’t to be considered as a recommendation; or an offer to buy or sell; or the solicitation of an offer to buy or sell any security, financial product or instrument; or to participate in any particular trading strategy. It does not take into account readers’ financial situation or investment objectives. We advise any readers of this content to seek their own advice. Without the approval of Pepperstone, reproduction or redistribution of this information isn’t permitted.

Nasdaq Analysis 07-Jul-25In this video we are discussing the main fundamental reason behind Nasdaq bullish momentum.
In addition to area if interest with possible scenarios.
Disclaimer: easyMarkets Account on TradingView allows you to combine easyMarkets industry leading conditions, regulated trading and tight fixed spreads with TradingView's powerful social network for traders, advanced charting and analytics. Access no slippage on limit orders, tight fixed spreads, negative balance protection, no hidden fees or commission, and seamless integration.
Any opinions, news, research, analyses, prices, other information, or links to third-party sites contained on this website are provided on an "as-is" basis, are intended only to be informative, is not an advice nor a recommendation, nor research, or a record of our trading prices, or an offer of, or solicitation for a transaction in any financial instrument and thus should not be treated as such. The information provided does not involve any specific investment objectives, financial situation and needs of any specific person who may receive it. Please be aware, that past performance is not a reliable indicator of future performance and/or results. Past Performance or Forward-looking scenarios based upon the reasonable beliefs of the third-party provider are not a guarantee of future performance. Actual results may differ materially from those anticipated in forward-looking or past performance statements. easyMarkets makes no representation or warranty and assumes no liability as to the accuracy or completeness of the information provided, nor any loss arising from any investment based on a recommendation, forecast or any information supplied by any third-party.
