NASDAQ going to 23500 by August.Nasdaq (NDX) is trading above the previous All Time High (ATH) Resistance, staging a very structured uptrend that has recently gotten out of a 1D Golden Cross.
As long as the 1D MA50 (blue trend-line) continues to support, we might get a repeat of the November - December 2024 rally that peaked on the 1.382 Fibonacci extension level from he August 2024 Low.
That whole July - October 2024 pattern is quite similar to the February - June 2025 of today. A quick pull-back is possible at this stage but by the end of August, we expect the index to test at least the 23500 level.
-------------------------------------------------------------------------------
** Please LIKE 👍, FOLLOW ✅, SHARE 🙌 and COMMENT ✍ if you enjoy this idea! Also share your ideas and charts in the comments section below! This is best way to keep it relevant, support us, keep the content here free and allow the idea to reach as many people as possible. **
-------------------------------------------------------------------------------
Disclosure: I am part of Trade Nation's Influencer program and receive a monthly fee for using their TradingView charts in my analysis.
💸💸💸💸💸💸
👇 👇 👇 👇 👇 👇
USTEC trade ideas

X1: NAS100/NQ/US100 Short Trade Risking 1% to make 1.35%PEPPERSTONE:NAS100 / CAPITALCOM:US100 Short Trades
PEPPERSTONE:NAS100 / CAPITALCOM:US100 Short for week, with my back testing of this strategy, it hits multiple possible take profits, manage your position accordingly.
Risking 1% to make 1.35%
Note: Manage your risk yourself, its risky trade, see how much your can risk yourself on this trade.
TP-1 is high probability TP but don't overload your risk like greedy, be disciplined trader.
Use proper risk management
Looks like good trade.
Lets monitor.
Use proper risk management.
Disclaimer: only idea, not advice

NAS100 - Bearish Triangle Breakdown Forming!NAS100 - Bearish Triangle Breakdown Forming!
A symmetrical triangle pattern has formed on the NAS100 30-min chart, signaling potential volatility ahead. We’re nearing the apex of the triangle, and price action suggests a possible bearish breakout.
🎯 Entry: 22,750.00
🎯Target: 22,400.40
⛔ Stop Out: 22,850.88
The risk/reward setup is favorable if the breakout follows through. Keep a close eye on volume confirmation as price exits the triangle.
What do you think about this triangle formation? Will the breakdown hold, or could bulls trap the shorts again?
💬 Share your opinion below and let’s discuss the setup!
🙏 If you find this helpful, please give it a like and follow for more technical ideas!

US NAS 100Preferably suitable for scalping and accurate as long as you watch carefully the price action with the drawn areas.
With your likes and comments, you give me enough energy to provide the best analysis on an ongoing basis.
And if you needed any analysis that was not on the page, you can ask me with a comment or a personal message.
Enjoy Trading ;)

NAS100 SELLTake trade on your own risk!
still moving on the downtrend to the next supply & demand zone, no sign of reversal.
Set TP: 22,755

BUYAsian Session
Trend Line Break
Order Point
Previous Week Bullish
Divergence
New day..., Action backed decision

NSDQ100 Bullish Flag continuation pattern developing Metals Market Volatility
Trump’s proposed 50% tariff on copper imports triggered a sharp drop in London copper prices (~2%), with risks of falling below $9,000/ton. While U.S. prices spiked on supply concerns, the global move reflects industrial demand fears—potentially weighing on manufacturing and cyclical stocks.
Trade Negotiations Intensify
Asian trade delegates have logged over 350,000 air miles traveling to Washington as tariff timelines remain unclear. Ongoing uncertainty is capping broader risk appetite, though delayed duties and active talks are offering short-term relief to markets.
Fed Under Pressure
Trump ramped up criticism of Fed Chair Jerome Powell, calling him “terrible,” and may consider replacing him with top adviser Kevin Hassett. This raises questions about central bank independence and future rate policy, a potential headwind for investor confidence.
Market Snapshot
U.S. stock futures: Slightly higher
Oil: Up, on Red Sea conflict
Gold: Down, as risk appetite stabilizes
Conclusion – Nasdaq 100 Trading Outlook
Near-term view: Mildly bullish, supported by easing trade tension and tech sector strength.
Caution warranted: Watch for headline risks from new tariff announcements or Fed-related developments.
Key Support and Resistance Levels
Resistance Level 1: 22940
Resistance Level 2: 23060
Resistance Level 3: 23180
Support Level 1: 22410
Support Level 2: 22300
Support Level 3: 22130
This communication is for informational purposes only and should not be viewed as any form of recommendation as to a particular course of action or as investment advice. It is not intended as an offer or solicitation for the purchase or sale of any financial instrument or as an official confirmation of any transaction. Opinions, estimates and assumptions expressed herein are made as of the date of this communication and are subject to change without notice. This communication has been prepared based upon information, including market prices, data and other information, believed to be reliable; however, Trade Nation does not warrant its completeness or accuracy. All market prices and market data contained in or attached to this communication are indicative and subject to change without notice.

NASDAQ Potential DownsidesHey Traders, in today's trading session we are monitoring NAS100 for a selling opportunity around 22,750 zone, NASDAQ is trading in a downtrend and currently is in a correction phase in which it is approaching the trend at 22,750 support and resistance area.
Trade safe, Joe.

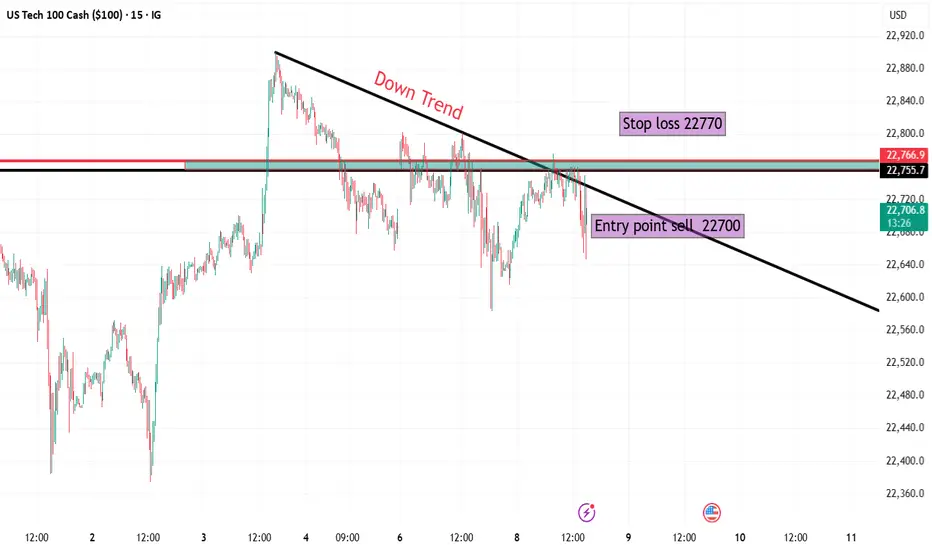
NASDAQ 🔍 Market Overview:
Instrument: US Tech 100 (NASDAQ 100)
Timeframe: 15 Minutes
Current Trend: Short-term downtrend, indicated by the descending trendline connecting recent lower highs.
📉 Trade Setup (Short Position):
Entry Point: 22,700
Price has broken below the trendline and a horizontal resistance zone around 22,750–22,770, confirming bearish pressure.
Stop Loss: 22,770
Placed just above the previous resistance and trendline. A break above this level would invalidate the downtrend structure.
Target: 22,070
This level aligns with a previously tested demand/support zone, offering a logical take-profit area.
📊 Risk/Reward Analysis:
Risk: ~100 points
Reward: ~640 points
Risk-to-Reward Ratio: 1:6, which is excellent and indicates a high potential reward relative to the risk.
📌 Technical Observations:
Trendline: Clearly established downtrend with lower highs.
Breakout Confirmation: Price rejected from trendline + horizontal resistance = confluence zone.
Volume & Momentum (not shown but advisable to check): Traders should confirm the breakout with increased selling volume or bearish momentum indicators (e.g., RSI dropping below 50 or MACD crossing down).
✅ Conclusion:
This is a well-structured short (sell) setup with:
Clear trendline rejection,
Defined entry, stop loss, and target,
A favorable risk-to-reward ratio.
NAS100 sell setup15 min supply zone engineering during market open yesterday will be the key trigger for todays sell off

US100 Resistance Cluster Above!
HI,Traders !
#US100 made a bearish
Breakout of the support
Cluster of the rising and
Horizontal support levels
Which is now a resistance
Cluster round 22703.9 then
Went down and made a local
Pullback on Monday but we are bearish
Biased mid-term so we
Will be expecting a further
Bearish move down this week !
Comment and subscribe to help us grow !

NASDAQ After the Fireworks: Bearish Setup LoadedAfter the classic 4th of July rally, I stepped in on the short side of Nasdaq, targeting 22,000 and 21,400 zones. The market structure shows exhaustion, and with the cloud retest failing to hold new highs, I positioned accordingly.
Technical:
• Price stalled at prior expansion highs with tight compression near 23,000.
• Daily FibCloud offered resistance confirmation.
• Bearish risk-reward skew forms after extended rally and thin retraces.
• Volume divergence spotted.
Fundamentals:
Multiple overlapping uncertainties:
• Trump confirmed tariffs will take effect on August 1, threatening a 10% surcharge on BRICS-aligned nations.
• Treasury Secretary Bessent anticipates several trade deal announcements within 48h—but stresses quality over quantity.
• Bank of America maintains its base case of 0 rate cuts in 2025, citing strong economic data and sticky inflation risks.
The combination of tariff escalation, hawkish monetary expectations, and global trade friction creates a perfect backdrop for volatility and correction—especially in overextended tech indices like the Nasdaq.
Note: Please remember to adjust this trade idea according to your individual trading conditions, including position size, broker-specific price variations, and any relevant external factors. Every trader’s situation is unique, so it’s crucial to tailor your approach to your own risk tolerance and market environment.

Technical Analysis – NAS100 (15min)Chart Overview Date: July 7, 2025
Market: NAS100 (US Tech 100 Index)
Timeframe: 15-Minute
Chart Context: Clean with Price Action Focus
🧠 Market Structure
Overall uptrend structure since June 21st – higher highs and higher lows.
Key resistance zone: 22,900 – price was rejected here multiple times.
Support area: 22,500 – formed after bullish impulsive move and retest.
🎯 Entry Scenario
Currently in a sideways consolidation between 22,700 – 22,900.
A break above 22,900 with strong volume can lead to a bullish continuation.
Alternatively, a rejection near 22,900 with bearish engulfing candle may offer a short scalp back toward 22,700.
📈 Bias & Confirmation
Trend Bias: Bullish
Wait for:
Breakout and close above resistance for long.
Rejection and bearish signal at resistance for short.
📌 Plan
Type Trigger SL TP Target 1 TP Target 2
Long Break & close >22,900 <22,800 23,050 23,150
Short Rejection @22,900 >22,950 22,720 22,600
"📊 Clean and structured technical analysis on NAS100 – Currently consolidating after a strong uptrend. Watching key levels around 22,900 for breakout or rejection scenario.
Trade safe. 📈 #ALIPFX #TechnicalAnalysis #NAS100"

USNAS100 Bullish Ahead of NVIDIA Milestone – 23010 in SightUSNAS100 – Outlook
The index continues its bullish momentum, supported by strong tech performance — notably NVIDIA surpassing a $4 trillion market cap.
As long as the price holds above 22880, the trend remains bullish toward:
23010 Then extended targets near 23170
However, a 1H close below 22815 would signal weakness, potentially opening the way for a retracement toward: 22705 And 22615, especially if tariff tensions escalate.
Resistance: 23010, 23170
Support: 22815, 22705, 22615

Bollinger Bands: How to Stop Being a Slave to the Markets.Bollinger Bands are a technical analysis indicator widely used in trading to assess the volatility of a financial asset and anticipate price movements. Created in the 1980s by John Bollinger, they consist of three lines superimposed on the price chart:
The middle band: a simple moving average, generally calculated over 20 periods.
The upper band: the moving average to which two standard deviations are added.
The lower band: the moving average to which two standard deviations are subtracted.
These bands form a dynamic channel around the price, which widens during periods of high volatility and narrows when the market is calm. When a price touches or exceeds a band, it can signal an overbought or oversold situation, or a potential trend reversal or continuation, depending on the market context.
What are Bollinger Bands used for?
Measuring volatility: The wider the bands, the higher the volatility.
Identify dynamic support and resistance zones.
Detect market excesses: A price touching the upper or lower band may indicate a temporary excess.
Anticipate reversals or consolidations: A tightening of the bands often heralds an upcoming burst of volatility.
Why is the 2-hour time frame so widely used and relevant?
The 2-hour (H2) time frame (TU) is particularly popular with many traders for several reasons:
Perfect balance between noise and relevance: The H2 offers a compromise between very short time frames (often too noisy, generating many false signals) and long time frames (slower to react). This allows you to capture significant movements without being overwhelmed by minor fluctuations.
Suitable for swing trading and intraday trading: This TU allows you to hold a position for several hours or days, while maintaining good responsiveness to take advantage of intermediate trends.
Clearer reading of chart patterns: Technical patterns (triangles, double tops, Wolfe waves, etc.) are often clearer and more reliable on H2 than on shorter time frames, making decision-making easier.
Less stress, better time management: On H2, there's no need to constantly monitor screens. Monitoring every two hours is sufficient, which is ideal for active traders who don't want to be slaves to the market.
Statistical relevance: Numerous backtests show that technical signals (such as those from Bollinger Bands) are more robust and less prone to false signals on this intermediate time frame.
In summary, the 2-hour time frame is often considered "amazing" because it combines the precision of intraday trading with the reliability of swing trading, thus providing superior signals for most technical strategies, particularly those using Bollinger Bands.
To summarize
Bollinger Bands measure volatility and help identify overbought/oversold areas or potential reversals.
The 2-hour timeframe is highly valued because it filters out market noise while remaining sufficiently responsive, making it particularly useful for technical analysis and trading decision-making.

NASDAQ 100: Breakout Confirmed — Targeting 23,023Market Overview:
The NASDAQ 100 is showing strong bullish momentum within its ascending channel. After forming an ABCD pattern and breaking above the buy level at 22,745, the price accelerated upward and is approaching the target resistance zone at 23,023.
Technical Signals & Formations:
— ABCD pattern in play
— EMA supports bullish momentum
— Breakout above buy zone at 22,745
— Target is the upper channel boundary and resistance at 23,023
Key Levels:
Support: 22,681, 22,620
Resistance/Target: 23,023
Scenario:
Primary: If the price holds above 22,745, the bullish continuation toward 23,023 remains the main scenario.
Alternative: A drop below 22,681 may lead to a correction toward 22,620 and increase bearish pressure.

NAS100 LONG TRADE PLANThe instrument has broken above the descending trend line. This is an indication of the bullish rally.
Please do your own analysis before placing any trades.
Cheers and Happy Trading !!!

US100 – Trendline Break Signals Potential RallyUS100 breaks above descending trendline.
🎯 Targets: 22799 → 22877
⚠️ Invalidation if price drops below 22702

USNAS100 Consolidates Between 22815–22705 | Breakout Will DefineUSNAS100 – Technical Outlook
The NASDAQ remains under pressure amid ongoing tariff uncertainty, with traders closely watching for any progress in negotiations or signs of escalation.
Currently, the price is consolidating between 22815 and 22705, awaiting a breakout to define the next directional move.
A 1H candle close below 22705 would confirm bearish continuation, targeting 22600, with further downside potential toward 22420.
A break above 22815 would shift momentum bullish, opening the way to 22880, followed by 23010.
Key Levels:
Support: 22600 / 22420
Resistance: 22815 / 22880 / 23010

Nas100 is Still Correcting Nasdaq is Correcting
Long Term we are still Bullish
Remember that markets hunt liquidity
The short term trend is Lower Highs and Lower Lows
Price is still in Premium For Sells
Looking for a retest of previous short term high and my TP would be around 22580
The only way I would get into a buy trade if price would retest the current support and hold with very bullish price action. No little candles etc.

Long position idea on Nasdaq Simple and precise idea of Nasdaq. Bullish momentum in full swing. Nasdaq recently broke out of the previous High/Resistance and shows that the bulls are still in power. Take profit is at 25.000.00 because Nasdaq usually moves around 10.000 pips after a market crash so when doing my calculations from previous Low of 16300, my estimation is around 25000 which equals to 9,000 - 10,000 pips.

Pullback before next leg up
NASDAQ’s looking weak short term. We’ve seen multiple rejections from the highs, an M pattern forming on the daily, and RSI divergence creeping in on the daily — momentum is clearly fading. I already took profit around 21980. And a few small swings between the range since 3rd of June.
The rally off the tariff drop was sharp, but it feels mechanical. Bulls look tired here. You can see price is stalling — pushing into the same highs but getting nowhere. Classic signs of distribution.
That said, this isn’t the start of a full-blown bear market. The long-term trend remains bullish. AI investment is still piling into the U.S., tech’s still leading globally, and structurally we haven’t broken down yet. Some weakness is starting to show though.
But short term, I think we see a pullback. The Fed’s still sitting on the fence with rate cuts, which is creating uncertainty. Add that to the current geopolitical tensions, and there’s enough on the table to justify a temporary risk-off move.
If price breaks and closes above 21,860, I’ll reassess and potentially shift back to a bullish bias. Until then, I’m leaning short and letting price action do the talking.
My key downside levels:
TP1: 21,483 — scale out and protect.
TP2: 21,322 — potential bounce from this area.
TP3: 21,145 — structure starts to weaken.
TP4: 20,894 — bears starting to control and a deeper flush, I’ll reassess bias at this level.
SL @ 21850 on my second entry short
Short term: pullback likely.
Big picture: still bullish — but bulls need to reset before any next leg up.
Bear signalsLooking for 22500 Im thinking. Banks trade the round numbers and the round numbers for nas are 125 point increments
