Mastering Volatile Markets: Why the Trend is Your Best Friend█ Mastering Volatile Markets Part 4: Why the Trend is Your Best Friend
In Part 1 , we covered reducing position size.
In Part 2 , we explored liquidity and execution strategies.
In Part 3 , we discussed the power of patience over FOMO.
Now,we're diving into one of the most important principles of all — especially in volatile, fast-moving markets: Follow the Trend. Trust the Trend. Trade With the Trend.
In wild markets like these, everything changes quickly. Indicators print overbought or oversold conditions well before the market even thinks about reversing.
Divergences can keep stacking up while the price continues trending for another 300, 500, or even 1000 points. Why? Volatility + Liquidity conditions = Extended trending behavior.
When liquidity is thin, and volatility is high, strong trends tend to last longer than usual:
Breakouts run further.
Breakdowns fall deeper.
And counter-trend trades? They're often a fast ticket to losses.
█ What Pro Traders Know Better Than Anyone:
In volatile markets, trend-following isn't optional — it's survival.
But wait, it is obvious that trends aren't perfect straight lines. So how can one even realistically “follow” a trend, especially in volatile markets.
Well, the key is to expect the unexpected. Experienced traders trade logically, we expect pullbacks, fakeouts, stop hunts, snapbacks and/or channel breaks. In fact, we prepare for them.
It is detrimental to assume the trend is over just because of these moves. Most of these are liquidity traps, not real reversals.
█ Here's What Pro Traders Do Differently:
⚪ They Identify the Core Trend Direction
Pro traders use price structure, trendlines, moving averages, VWAP , or higher timeframe levels to identify the trend direction. Once identified, every trade respects the trend.
Let me explain with an example.
→ Uptrend Identification:
Say you notice that the price of Gold (XAUUSD) has been consistently making higher highs and higher lows. What should you do?
You use the 100-period moving average (MA) and see that price is staying above it, indicating an uptrend. You wait for price to pull back to the MA, giving you a low-risk entry to join the uptrend rather than chasing the trend.
→ Downtrend Identification:
In a downtrend, USD/JPY keeps making lower highs and lower lows. You observe the 100-period moving average pointing down. This is your cue to look for short entries , avoiding countertrend buys that could trap you.
⚪ They ONLY Look for Entries at Key Trend Channel Levels
Professional traders don’t chase the price or try to catch every move. Instead, they patiently wait for price to return to key areas within a well-defined trend channel , either the upper boundary (in a downtrend) or the lower boundary (in an uptrend).
→ In an uptrend:
Pro traders draw a trend channel based on the price move. When price pulls back to the lower boundary of the channel (often aligning with demand zones), they start looking for long entries, aiming to trade with the trend and target a new high.
→ In a downtrend:
The same logic applies, but in reverse. Price pulls back to the upper boundary of the channel (supply area), offering a clean short opportunity to continue with the trend and target a new low.
But here’s what separates pros from amateurs:
→ They expect fakeouts, spikes , and temporary breaks beyond the trend channel — especially in volatile conditions.
→ They don’t panic when the price briefly moves outside the channel. Instead, they wait for confirmation signals (like a rejection candle, break of structure, or momentum shift) before entering.
→ This gives them both a logical entry point and a favorable risk-reward setup — aligning with the larger trend direction while staying protected if the trend fails.
⚪ They Treat Countertrend Moves as Opportunities to Enter WITH the Trend
When a countertrend move happens, pro traders see it as an opportunity to enter with the prevailing trend, rather than trying to catch a reversal.
→ Counter-Trend Move in an Uptrend:
Let's say S&P 500 is in a strong uptrend, and it experiences a sharp pullback of 5%.
While many retail traders panic and try to short the market, pro traders see this as a buying opportunity at a lower price, anticipating the trend will continue after the correction.
→ Counter-Trend Move in a Downtrend:
For Gold (XAU/USD) , if the price falls sharply from $1,900 to $1,850 and then retraces back to $1,875 (a previous support-turned-resistance level), pros see this as an opportunity to sell into the trend rather than buying into what could be a false recovery.
⚪ They Accept That Trends Can Look "Overbought" or "Oversold" for a Long Time
In volatile, trending conditions, RSI can stay above 70 for hours or even days, and divergences can build for a long time without price reacting.
→ RSI Above 70 in an Uptrend:
Bitcoin (BTC/USD) rallies from $40,000 to $60,000. Despite RSI being above 70 for a few days, pro traders don't fight the trend because momentum is strong. Instead, they look for a pullback to the 100-period MA for a safer entry.
→ Divergence in Downtrend:
The EUR/USD shows a bearish trend , but the RSI starts to build a divergence as the price keeps making lower lows. Pro traders ignore the divergence because the trend is still strong. They wait for a clear break of the trendline or confirmation that price has reversed before considering a long trade.
█ Summary of Part 4 — Trend is Your Best Friend
You can't control how far a trend will run…but you can control whether you're with or fighting against it.
And trust me, fighting a strong trend in a volatile market is a battle retail traders rarely win.
Here’s what you should take away from this article:
Volatile markets = Extended trends
Indicators can lie — trend structure tells the truth
Fakeouts & pullbacks are normal
Don't fight the trend — trade with it
Use counter-moves to enter the trend
Patience & trend-following = Survival + Profit
█ What We Covered:
Part 1: Reduce Position Size
Part 2: Liquidity Makes or Breaks Your Trades
Part 3: Patience Over FOMO
Part 4: Trend is Your Best Friend
That's it! You've now completed the Mastering Volatile Markets series.
Stay calm, adapt quickly, and trade smarter — that's how you survive (and thrive) in volatile markets.
-----------------
Disclaimer
The content provided in my scripts, indicators, ideas, algorithms, and systems is for educational and informational purposes only. It does not constitute financial advice, investment recommendations, or a solicitation to buy or sell any financial instruments. I will not accept liability for any loss or damage, including without limitation any loss of profit, which may arise directly or indirectly from the use of or reliance on such information.
All investments involve risk, and the past performance of a security, industry, sector, market, financial product, trading strategy, backtest, or individual's trading does not guarantee future results or returns. Investors are fully responsible for any investment decisions they make. Such decisions should be based solely on an evaluation of their financial circumstances, investment objectives, risk tolerance, and liquidity needs.
USTEC trade ideas

bullish for nas100I'm back again with nice setup of nass100 up we go no looking back, break and retest the support level and the third touch on trendline.

Price Action: Nasdaq NDX Monday 4/14/2025In this video, we will be looking at the Nasdaq (NDX) on the daily chart and its potential Movement throughout Monday 4/14/2025.

Does the Nasdaq keep dropping after approaching the nearby high?I have 2 zone that are coded as a "no close above" that should have held no issue
The reason why I am short mainly is because we haven't visit 50% of the New Week Opening Gap and we have rejected from 50% of the bearish gap above the range. As well as volumetric divergence after the rally.
I want to see this gap at least partially filled before anything else this week can happen.

Short position on nas100Market opened with a gap of +310points
it's safe to say we've reached this week's high as we'll be entering a trade war

US100 Don't be too greedy!!NO FINANCIAL ADVICE!
Looks like smart money wants to grab the stops of the retails... In these times... stay patient and wait for the moment! Trade safe! :)

Hanzo | Nas100 15 min Breaks – Will Confirm the Next Move🆚 Nas100
The Path of Precision – Hanzo’s Market Strike
🔥 Key Levels & Breakout Strategy – 15M TF
🔥 Deep market insight – no random moves, only calculated execution.
☄️ Bullish Setup After Break Out – 19150 Zone
Price must break liquidity with high volume to confirm the move.
☄️ Bearish Setup After Break Out – 18820 Zone
Price must break liquidity with high volume to confirm the move.
🩸 15M Time Frame Confluence
————
CHoCH & Liquidity Grab @ 19200
Key Level / Equal lows Formation - 18820
Strong Rejection from 19300 – The Ultimate Pivot
Strong Rejection from 17800 – The Ultimate Pivot
Strong Rejection from 19100 – The Ultimate Pivot
🔥 1H Time Frame Confirmation
Twin Wicks @ 18820 – Liquidity Engineered
Twin Wicks @ 18500 – Liquidity Engineered
Twin Wicks @ 17800 zone – Liquidity Engineered
☄️ 4H Historical Market Memory
——
💯 18 jan 2024 – Bearish Retest 16900
💯 11 jan 2024 – Bearish Retest 16900
💯 18 jan 2024 – Bullish Run After Break That level
Hanzo | Nas100 15 min Breaks – Will Confirm the Next Move

NAS100 ICT Smart Money Concept Analysis | April 14, 2025🔍 Overview:
This chart breaks down the NAS100 (US100 Cash CFD) price action using ICT and SMC principles. We've identified a clear market structure shift and multiple order blocks (OB), fair value gaps (FVG), and imbalance zones.
📌 Key Highlights:
4H
15MIN Order Block (OB): Price retraced to the 15-minute OB before showing bullish momentum.
Market Structure Shift (MSS): MSS confirmed after price broke above the internal structure.
Liquidity Sweep: Previous equal highs taken out, indicating a liquidity grab before potential reversal.
Premium vs. Discount Zones: Price currently trading in a premium zone, close to a 15MIN supply OB.
Confluence Zone: Multiple SMC elements align (OB + FVG + MSS), suggesting high probability setup.
📈 Expectations: Price may react to the current 15MIN supply zone and give a short opportunity targeting lower imbalance or internal structure lows. If broken cleanly, we could see continuation toward higher HTF targets.
💬 Feel free to comment your thoughts or questions below. Let's grow together, traders!
#ICT #SMC #NAS100 #OrderBlocks #FVG #Liquidity #PriceAction #SmartMoney #TradingView #LasinsRaj #MarketStructure

NASDAQ Trump's 2 TRADE WARS are identical! What you need to knowNASDAQ (NDX) had a massive bullish reversal 1W candle last week as, despite a Lower Low opening, the intra-week rebound surpassed the opening of the previous week. The sell-off reached almost as low as the 1W MA200 (orange trend-line) , which has been the Support level of the late 2022 Inflation Crisis bottom and has been untouched for more than 2 year.
This is not the first time we see this pattern. In an interesting twist of events, we saw the exact same formation during Trump's 1st Trade War, which bottomed on the week of December 24 2018, near the 1W MA200 as well and exactly on the 0.382 Fibonacci retracement level from the Top.
The similarities don't stop there as both Trade War periods were manifested within Megaphone patterns. Their sell-off/ Bearish Leg was -25% (now) and -23% (2018) respectively, while the set-up leading to those Megaphones was a +103.50% and +113.50% Bull Cycle respectively. Also both sell-offs got an oversold (30.00 or lower) 1W RSI bottom.
So, since NDX has currently completed a -25% correction near the 1W MA200 and the 0.382 Fib with the 1W RSI bouncing off the oversold barrier, it is very likely that we've formed the pattern's bottom, especially if the global fundamentals point towards trade deals.
If this Low remains intact, we expect a similar +35% short-term Top at 22500 within a 3-4 month period and then long-term rally near the -0.382 Fibonacci extension at 29000.
-------------------------------------------------------------------------------
** Please LIKE 👍, FOLLOW ✅, SHARE 🙌 and COMMENT ✍ if you enjoy this idea! Also share your ideas and charts in the comments section below! This is best way to keep it relevant, support us, keep the content here free and allow the idea to reach as many people as possible. **
-------------------------------------------------------------------------------
💸💸💸💸💸💸
👇 👇 👇 👇 👇 👇

Why the current section is important
Hello, traders.
If you "Follow", you can always get new information quickly.
Please click "Boost" as well.
Have a nice day today.
-------------------------------------
It is not easy to explain everything with just chart analysis.
Therefore, it is true that interpretation of various issues is necessary.
However, I am only explaining the chart.
The reason is that interpretation of various issues other than the chart is not easy for individual investors.
-
(NAS100USD 1W chart)
In order to continue the uptrend, the price must be maintained above the M-Signal indicator of the 1M chart.
If not, there is a high possibility of continuing the downtrend.
Therefore, if the price is maintained above 18693.7, I think it is highly likely that the uptrend will continue.
However, this is a medium- to long-term perspective.
-
(1D chart)
In the short term, the price should be maintained above the M-Signal indicator on the 1D chart.
In that sense, we can see that the current price position is an important section.
However, in order to continue the short-term upward trend, it should rise above the M-Signal indicator on the 1W chart.
In that sense, the support around 19848.3 is an important key point.
-
Currently, the StochRSI indicator has entered the overbought section.
Therefore, even if it continues to rise further, it is expected to show a downward trend in the end.
Therefore, if it is not supported near 19848.3, I think you should prepare for a decline.
At this time, you should check whether it can be supported near 18428.8 and rise.
The reason is that the HA-Low indicator of the 1D chart is formed.
-
The HA-Low and HA-High indicators are indicators created for trading on the Heikin Ashi chart.
The fact that the HA-Low indicator was created means that it rose from the low point section.
Therefore, if it is supported near the HA-Low indicator, then that is the time to buy.
If it falls without being supported by the HA-Low indicator, there is a possibility of a stepwise decline, so you should think about a countermeasure for this.
However, there is a difference between a downward trend following the HA-Low indicator and a simple downward trend.
A stepwise decline following the HA-Low indicator is likely to eventually form a bottom section.
The next volatility period is expected to be around April 29th.
-
Thank you for reading to the end.
I hope you have a successful trading.
--------------------------------------------------

USTEC,NAS100USTEC is still in a downtrend. The price has a chance to test the resistance zone 19588-19875. If the price cannot break through the 19876 level, it is expected that the price will drop. Consider selling in the red zone.
🔥Trading futures, forex, CFDs and stocks carries a risk of loss.
Please consider carefully whether such trading is suitable for you.
>>GooD Luck 😊
❤️ Like and subscribe to never miss a new idea!

Nasdaq 100 Opens with Bullish GapTrump Exempts Electronics from Tariffs; Nasdaq 100 Opens with Bullish Gap
Despite the weekend, the news flow remained intense amid the escalating trade war. According to media reports:
→ Certain tech products, including those made by Apple, have been exempted from Trump’s tariffs.
→ Trump announced he would make a significant statement regarding semiconductor tariffs on Monday, 14 April.
Stock Indices React to Trump’s Tariff Moves
These announcements were taken positively by the markets. As shown on the chart of the Nasdaq 100 index (US Tech 100 mini on FXOpen), the new week opened with a bullish gap exceeding 1.5% – a stronger performance than the S&P 500 (US SPX 500 mini on FXOpen), which also saw a bullish gap.
This may suggest that market participants are cautiously optimistic that the sweeping tariff measures might be eased through exemptions, delays, or negotiation concessions. Nevertheless, the CNN Business Fear & Greed Index remains in "extreme fear" territory, despite inching higher compared to last week.
As of this morning, the Nasdaq 100 (US Tech 100 mini on FXOpen) has recovered approximately 15% from its 2025 low.
Technical Analysis: Nasdaq 100 (US Tech 100 mini on FXOpen)
Seven days ago, we plotted an ascending blue channel and suggested that its lower boundary could act as support – which has indeed played out.
With the latest data in hand, there is reason to believe that bulls may now be aiming to push the price up toward the channel’s median line. However, as indicated by the arrows on the chart, this median appears to have shifted from acting as support to acting as resistance.
Bulls may also face headwinds from the wide bearish candle to the left, which was formed in reaction to Trump's tariff announcements. According to Smart Money Concept methodology, this area – marked by a bearish Fair Value Gap (highlighted with a rectangle) – may now serve as resistance.
This article represents the opinion of the Companies operating under the FXOpen brand only. It is not to be construed as an offer, solicitation, or recommendation with respect to products and services provided by the Companies operating under the FXOpen brand, nor is it to be considered financial advice.

Nasdaq market analysis: 14-APRIL-2025Good morning! Happy New Week! Here's your daily Nasdaq market analysis. Learn, grow, and trade wisely.

Trade the Structure: NAS100 Possible Retrace & Buy OpportunityThe NAS 100 recently broke its market structure after a twist in trade policy—with Donald Trump delaying tariffs by 90 days—which sparked a robust rally. On the 4‑hour chart, we're looking for a bullish setup where the initial surge might be followed by a pullback into a sideways accumulation zone. This consolidation is expected to form a "spring" pattern—a brief retest that could trap sellers—followed by a clear break of market structure that signals a renewed upward move. The entry is ideally on the breakout, backed by supportive volume, while risk management is maintained with a stop-loss positioned just below the range if/when price retraces into support. 🚀📈💰

Tactical US100 Trading: Converting 1W Trend into 30m Opportunity📈 The US100 index is currently exhibiting a bearish trend pattern on the weekly timeframe. We can observe a notable rally followed by a retracement into equilibrium when analyzed against the previous price wing range.
🔎 Currently, the index is positioned at a premium level, creating an environment where short sellers might be building positions in anticipation of further downward movement. However, market dynamics remain highly sensitive to external influences, particularly unexpected statements and social media announcements from influential figures like Donald Trump.
🌊 With such market unpredictability in play, focusing on shorter timeframes provides more actionable intelligence. Price action signals offer clearer guidance in this volatile environment.
⚡ Trade Opportunity: The 30-minute chart reveals a defined trading range worth monitoring. A definitive break above this range could present an opportunity to enter long positions, while a breakdown below support might signal a favorable short entry point.
🎯 This breakout strategy enables traders to respond to actual market movements rather than attempting to forecast the broader market direction—a particularly valuable approach given the current unpredictable market landscape.
⚠️ DISCLAIMER: This analysis is provided for informational purposes only and does not constitute financial advice. Trading carries significant risk of capital loss and may not be appropriate for all investors. Historical performance does not guarantee future outcomes. Always perform independent research and consider your personal financial circumstances before executing any trades. Market conditions are subject to rapid changes, and no trading methodology ensures profits. The information presented should be used as one of many inputs in your decision-making process.

NAS100 Update - Potential TargetsDear Fellow Traders,
How I see it:
NASDAQ Stocks will remain in a sell off phase this quarter.
My "BEARISH" targets in case "DAILY TREND RESISTANCE" holds -
* TP1 & TP2 as indicated.
My "BULLISH" targets in case "DAILY TREND RESISTANCE" is breached -
* TP1 & TP2 as indicated.
KEYNOTE:
Bullish TP 2 = 78.60% FIB retracement from ATH
Feel free to ask if anything is unclear.
Thank you for taking the time to study my analysis.

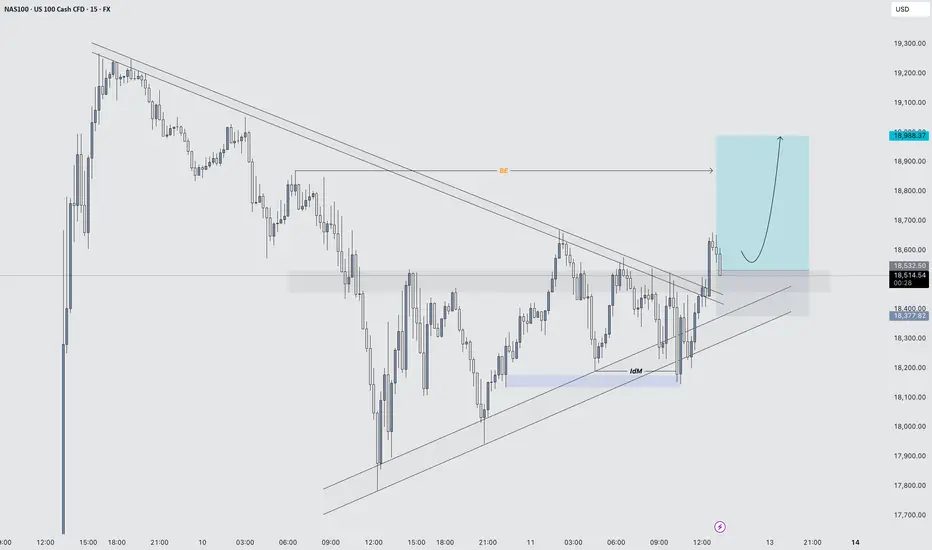
NAS100 (15min) – Bullish Entry Activated1. Symmetrical Triangle Formation
Price was compressing inside a symmetrical triangle, with a series of lower highs and higher lows, indicating indecision and buildup of pressure.
2. Downside Fake-out (False Breakout)
Price briefly broke below the lower trendline, suggesting a potential bearish breakout.
However, there was no strong follow-through; instead, price quickly reclaimed the trendline and pushed back inside the structure.
This is a classic fake-out, often trapping late sellers and providing liquidity for buyers.
The rejection from the lows resulted in a long wick, signalling strong buying interest and failure to break down.
3. Aggressive Bullish Reaction
After reclaiming the triangle support, price moved rapidly back to the top of the triangle.
The next key move was a strong breakout above the upper trendline, confirming bullish intent.
4. Break and Retest
Price action followed through with a clean breakout above resistance, followed by a minor pullback and retest of the broken trendline, which held as support.
This retest offered a textbook entry point based on price action principles.
5. Bullish Structure Confirmation
Post breakout, price formed a higher low and continued to make a higher high, confirming a trend shift.
This structural change strengthens the bullish outlook.
Nasdaq Buy Now This trade is Based on ICt concept
Used only 1% Risk
Book 50% Trade after 20 pips Profit

Nas tariff trade idea Looking for nas sells with escalations in tariff war. I will make sure global equities push lower alon with oil pushing lower and recession fears coming back in the market
looking for buys on nas if de escalations happen and we can see oil above 60 and global markets pushing up

NAS100 Stuck in Limbo – Breakout Brewing or Breakdown Coming?The NAS100 is caught in a see-saw of indecision, dancing between trendline resistance above and support below. No need to guess the outcome—momentum will tip its hand soon. We're planning to straddle the move with a one-cancels-the-other (OCO) setup and let the market choose the direction. Stay patient, stay ready.

Nasdaq downtrend prevails till it breaks 19200 ResistanceNasdaq downtrend prevails till it breaks 19200 Resistance.

The Nasdaq 100 is exhibiting a strong short-term bearish trend. 📉 Technical Analysis (Short-Term):
The Nasdaq 100 is exhibiting a strong short-term bearish trend.
CentralCharts
The index is trading below its 200-day moving average, indicating potential market weakness and possibly the start of a downtrend.
Business Insider
Key resistance levels are around $20,275–$20,382; a breakout above this range could signal a bullish reversal.
TradingView
Support is observed near $18,872; a break below this level may lead to further declines.
TradingView
🧠 Fundamental Analysis:
The Nasdaq 100 concluded Q1 2025 with a loss of 8.6%, reflecting a challenging start to the year.
Seeking Alpha
Upcoming Q1 earnings reports from major tech companies, including Netflix and TSMC, are anticipated to influence market direction.
FX Leaders
Persistent inflation above the Federal Reserve's target and signs of a weakening job market are contributing to economic uncertainty.
Business Insider
💬 Sentiment Analysis:
Investor sentiment is currently bearish, with the Nasdaq 100 having fallen over 8% in March, marking the worst monthly performance since late 2022.
MarketWatch
Concerns over trade tensions, inflation, and potential stagflation are weighing on market confidence.
Business Insider
Despite the downturn, April's historical performance as a strong month for U.S. stocks may offer buying opportunities amidst volatility.

NAS100 Playbook For The Week Friday closed around 18,783, likely in the midst of wrapping up Wave 5 on the 1H timeframe ⚠️
However, the daily Wave 5 still looks incomplete — my upside target remains around 19,732.
Notably, price hasn’t tapped the Wave 3 daily high at 19,258, so there’s still room for one more push 📈
What I’m Watching:
🔻 Short-term pullback likely.
Here are the zones I’m eyeing for potential shorts:
🔹 1H Wave 2 FVG zone → 18,098
🔹 Daily FVG / Wave 2 bottom → 17,573
I’ll be looking to short into one of those levels IF structure confirms, then potentially flip long once we see a solid move on the daily 💥
—
Trading structure over signals — let the wave tell the story 🌊
#NAS100 #ElliottWave #MarketStructure #kushstratedFX
