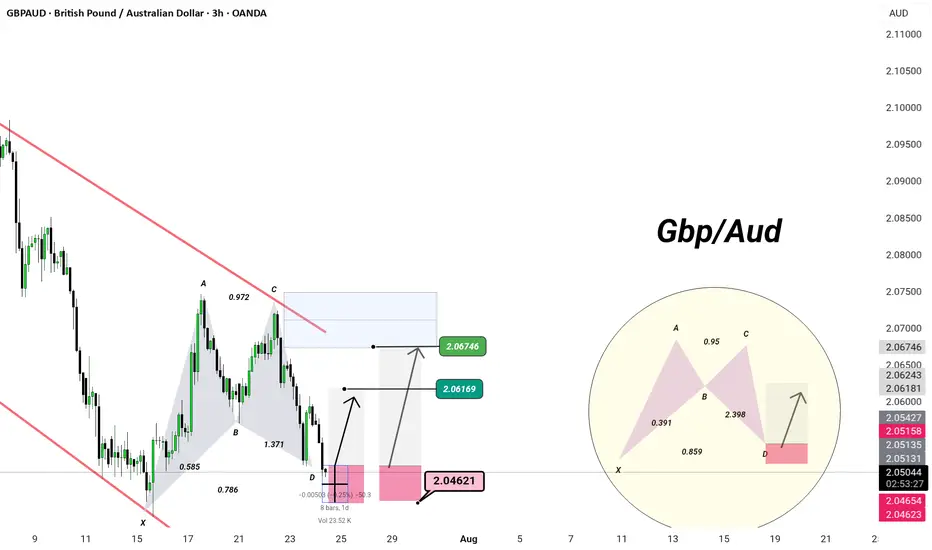
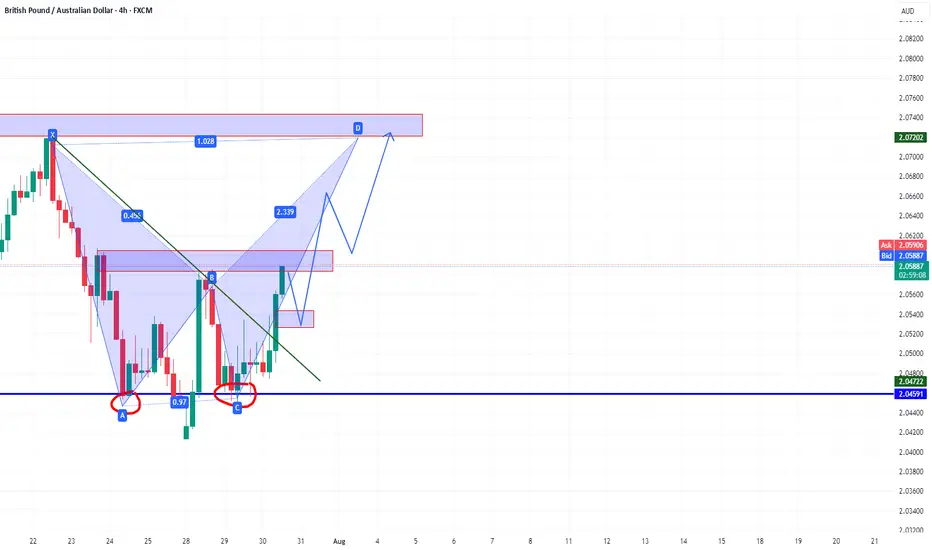
IGBPAUD | 3H Chart | Precision Setup –
🦋 Bullish Harmonic Activation – Deep Zone Precision
When elegance meets geometry — we trade like a Monaco man.
🔺 Pattern: Potential Bullish Bat/Alt Bat
XA → AB → BC → CD
Ideal D-point completion at 2.0462
88.6% XA retracement + 2.0+ BC extension = high-probability reaction zone
🛡️ Demand Zone:
Price is testing the PRZ (Potential Reversal Zone) at 2.0462
Reaction expected → projected targets:
🎯 TP1: 2.0616
🎯 TP2: 2.0674
⚙️ Entry Plan:
Long from 2.0462–2.0465
Invalidation below structure low
Maintain composure. Let the setup mature — precision > prediction
💡 Bias: Tactical long within channel, targeting liquidity above C
🎩
GBPAUD trade ideas
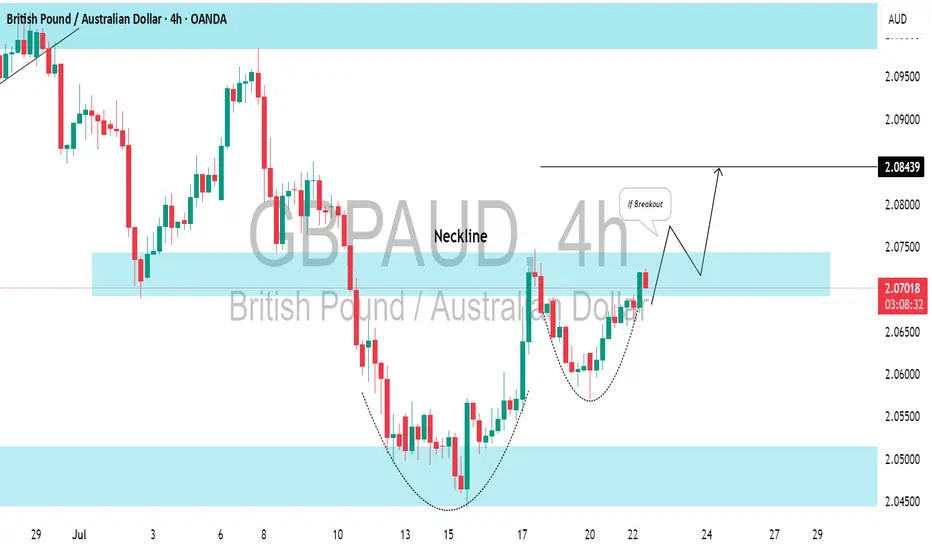
GBPAUD: Bullish Movement Continues 🇬🇧🇦🇺
GBPAUD is going to rise more, following a confirmed intraday bullish reversal:
first, the price violated a resistance line of a falling channel.
It started to consolidate within an inverted head & shoulders pattern then.
Its neckline violation is another strong bullish signal.
Next resistance - 2.0685
❤️Please, support my work with like, thank you!❤️
I am part of Trade Nation's Influencer program and receive a monthly fee for using their TradingView charts in my analysis.

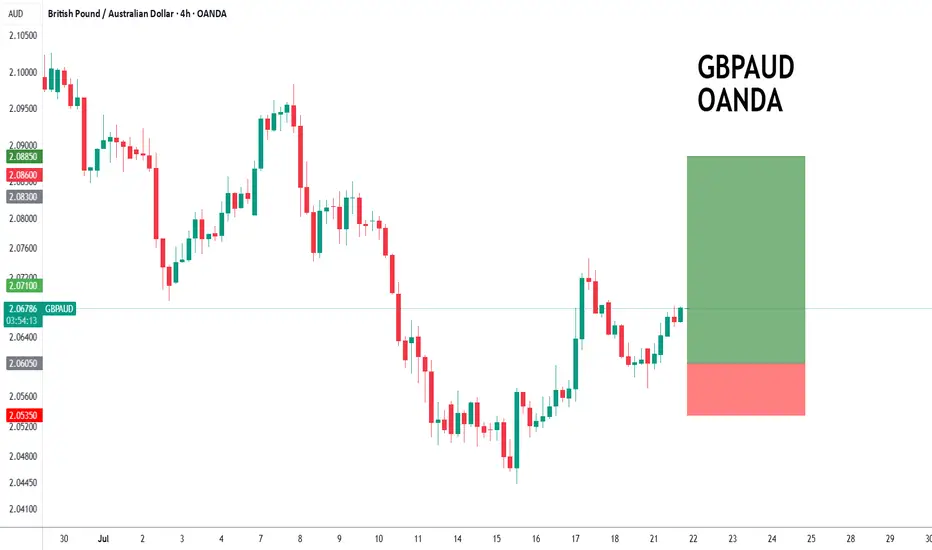
GBPAUD: Another Bullish Pattern⚠️GBPAUD has adhered to a horizontal support level on the intraday chart and has bounced back from it, revealing a strong bullish pattern.
The price has formed a cup and handle pattern and is currently testing its neckline.
Look for a breakout confirmation; a 4-hour candle closing above the 2.0750 level will validate this breakout, leading to an anticipated bullish continuation.
GBPAUD: Liquidity Grab and Fair Value Gap RejectionPrice recently swept liquidity above a key level, grabbing stops resting above that range. Following that, it quickly reversed and left behind a clean Fair Value Gap , suggesting a possible shift in intent.
We are now watching price retrace into the FVG zone. If price reacts from there with a strong bearish confirmation candle like a bearish engulfing or another sign of rejection, we could see a continuation move lower. Our short-term target would be the previous day’s low.
This setup reflects how important it is to wait for confirmation and not chase the first reaction. Let price come to you and show its hand. Patience leads to clarity and better entries.
A trade without confirmation is just a guess. A trade with structure, confluence, and patience is a plan. Stay sharp.

GBPAUD to find buyers at current support?GBPAUD - 24h expiry
The primary trend remains bullish.
Price action looks to be forming a bottom.
We look for a temporary move lower.
Preferred trade is to buy on dips.
Bespoke support is located at 2.0605.
We look to Buy at 2.0605 (stop at 2.0535)
Our profit targets will be 2.0885 and 2.0950
Resistance: 2.0750 / 2.0800 / 2.0970
Support: 2.0600 / 2.0520 / 2.0450
Risk Disclaimer
The trade ideas beyond this page are for informational purposes only and do not constitute investment advice or a solicitation to trade. This information is provided by Signal Centre, a third-party unaffiliated with OANDA, and is intended for general circulation only. OANDA does not guarantee the accuracy of this information and assumes no responsibilities for the information provided by the third party. The information does not take into account the specific investment objectives, financial situation, or particular needs of any particular person. You should take into account your specific investment objectives, financial situation, and particular needs before making a commitment to trade, including seeking advice from an independent financial adviser regarding the suitability of the investment, under a separate engagement, as you deem fit.
You accept that you assume all risks in independently viewing the contents and selecting a chosen strategy.
Where the research is distributed in Singapore to a person who is not an Accredited Investor, Expert Investor or an Institutional Investor, Oanda Asia Pacific Pte Ltd (“OAP“) accepts legal responsibility for the contents of the report to such persons only to the extent required by law. Singapore customers should contact OAP at 6579 8289 for matters arising from, or in connection with, the information/research distributed.
Short GBPAUD Trendline break outSell: $2.05825
Set up: Trend line break out to the downside
Sl: $2.08021
TP:2.02641

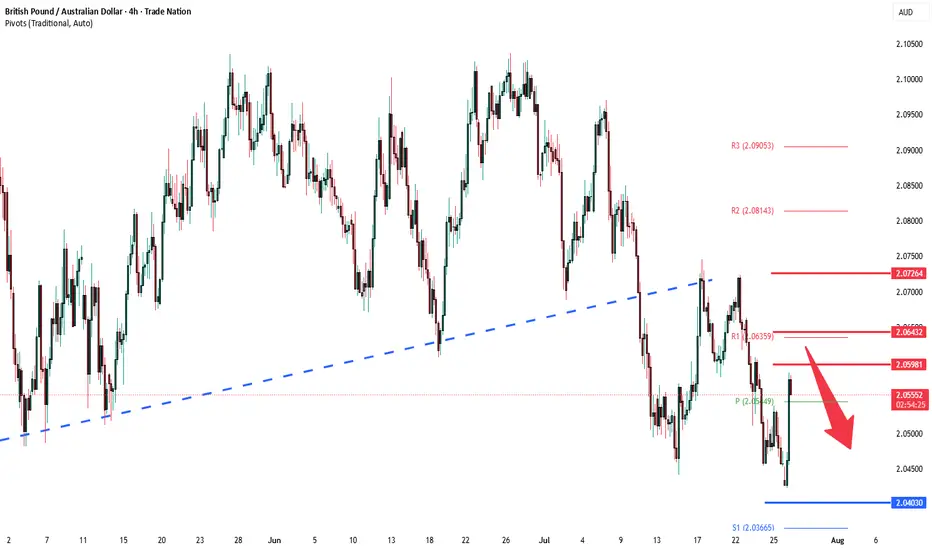
GBPAUD oversold bounceback capped at 2.0710The GBPAUD pair is currently trading with a bearish bias, aligned with the broader downward trend. Recent price action shows a retest of the previous support zone, suggesting a temporary relief rally within the downtrend.
Key resistance is located at 2.0660, a prior consolidation zone. This level will be critical in determining the next directional move.
A bearish rejection from 2.0660 could confirm the resumption of the downtrend, targeting the next support levels at 2.0480, followed by 2.0410 and 2.0350 over a longer timeframe.
Conversely, a decisive breakout and daily close above 2.0660 would invalidate the current bearish setup, shifting sentiment to bullish and potentially triggering a move towards 2.0710, then 2.0750.
Conclusion:
The short-term outlook remains bearish unless the pair breaks and holds above 2.0660. Traders should watch for price action signals around this key level to confirm direction. A rejection favours fresh downside continuation, while a breakout signals a potential trend reversal or deeper correction.
This communication is for informational purposes only and should not be viewed as any form of recommendation as to a particular course of action or as investment advice. It is not intended as an offer or solicitation for the purchase or sale of any financial instrument or as an official confirmation of any transaction. Opinions, estimates and assumptions expressed herein are made as of the date of this communication and are subject to change without notice. This communication has been prepared based upon information, including market prices, data and other information, believed to be reliable; however, Trade Nation does not warrant its completeness or accuracy. All market prices and market data contained in or attached to this communication are indicative and subject to change without notice.
21.07.25 Morning ForecastPairs on Watch -
FX:GBPAUD
FX:EURUSD
FX:AUDUSD
OANDA:XAUUSD
A short overview of the instruments I am looking at for today, multi-timeframe analysis down to what I will be looking at for an entry. Enjoy!

GBPAUDin an up trend I identify this range as a Wycoff pattern and think I should take a long from here.

GBPAUD Bullish BiasPrice has entered the weekly demand zone and formed an inverse head and shoulders.
Price also shows bullish divergence on the RSI indicator.
Recent fundamental news of AUD showed increase in unemployment and father rate cuts are expected in the near future.

GBP-AUD Growth Ahead! Buy!
Hello,Traders!
GBP-AUD made a retest
Of the horizontal support
Of 2.0420 and we are
Already seeing a bullish
Rebound so we will be
Expecting a further
Bullish move up
Buy!
Comment and subscribe to help us grow!
Check out other forecasts below too!
Disclosure: I am part of Trade Nation's Influencer program and receive a monthly fee for using their TradingView charts in my analysis.

GBPAUDSometimes you have to look beyond profit and loss. My previous bias on this trade still stands ,I got stopped out, it happens. But this setup looks solid, and it doesn’t hurt to take another shot.RISK TO REWARD, this will potentially cover the previous trade.

GBPAUD bullish potentialGBPAUD is showing bullish potential after forming a double bottom around the key support zone at 2.0459. A bullish harmonic pattern is unfolding, with a potential move toward the 2.0720–2.0740 resistance zone. The break of the downtrend line adds confirmation, and a pullback to 2.0530–2.0550 could offer a good re-entry area. As long as price stays above 2.0450, the bullish setup remains valid. The key target is the harmonic D completion zone.
GBPAUD looks promising individuallybut EURAUD seems to be the leader alone
everyone else is lag behind by far degree
there must be something with eur group

GBPAUD Break of trendline resistance GBPAUD recent broke the trendline resistance and is likely to go up.

GBPAUD Is Going Up! Long!
Here is our detailed technical review for GBPAUD.
Time Frame: 6h
Current Trend: Bullish
Sentiment: Oversold (based on 7-period RSI)
Forecast: Bullish
The market is on a crucial zone of demand 2.055.
The oversold market condition in a combination with key structure gives us a relatively strong bullish signal with goal 2.070 level.
P.S
Please, note that an oversold/overbought condition can last for a long time, and therefore being oversold/overbought doesn't mean a price rally will come soon, or at all.
Disclosure: I am part of Trade Nation's Influencer program and receive a monthly fee for using their TradingView charts in my analysis.
Like and subscribe and comment my ideas if you enjoy them!

GBPAUD oversold rally capped at 2.0600 resistanceThe GBPAUD pair is currently trading with a bearish bias, aligned with the broader downward trend. Recent price action shows a retest of the resistance, suggesting a temporary relief rally within the downtrend.
Key resistance is located at 2.0600, a prior consolidation zone. This level will be critical in determining the next directional move.
A bearish rejection from 2.0600 could confirm the resumption of the downtrend, targeting the next support levels at 2.0400, followed by 2.0350 and 2.0290 over a longer timeframe.
Conversely, a decisive breakout and daily close above 2.0600 would invalidate the current bearish setup, shifting sentiment to bullish and potentially triggering a move towards 2.0645, then 2.0730.
Conclusion:
The short-term outlook remains bearish unless the pair breaks and holds above 2.0600. Traders should watch for price action signals around this key level to confirm direction. A rejection favours fresh downside continuation, while a breakout signals a potential trend reversal or deeper correction.
This communication is for informational purposes only and should not be viewed as any form of recommendation as to a particular course of action or as investment advice. It is not intended as an offer or solicitation for the purchase or sale of any financial instrument or as an official confirmation of any transaction. Opinions, estimates and assumptions expressed herein are made as of the date of this communication and are subject to change without notice. This communication has been prepared based upon information, including market prices, data and other information, believed to be reliable; however, Trade Nation does not warrant its completeness or accuracy. All market prices and market data contained in or attached to this communication are indicative and subject to change without notice.
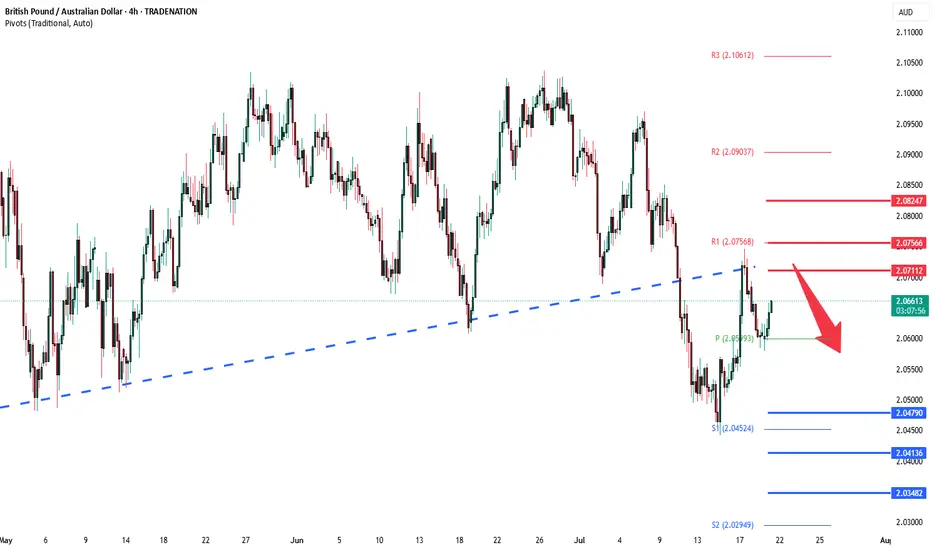
GBPAUD LONG trend : bearish
divergence : bullish
continuation : n/a
reversal : n/a
harmonics : n/a
sentiments : neutral

GBPAUD--SHORT--27_07_25--breaking of ascending trendline
--move towards monthly resistance around 2.026 ( bold dashed horizantal line)

High-Stakes GBP/AUD Short Plan – Grab the Bag & Escape Early!💥🔥GBP/AUD HEIST OPERATION: The Pound vs Aussie Bear Trap Masterplan 🔥💥
(Thief Trader Exclusive TradingView Drop – Smash Boost If You’re Ready To Rob The Market!)
🌍 Hi! Hola! Ola! Bonjour! Hallo! Marhaba! 🌍
Welcome, Money Makers & Market Robbers! 🤑💰✈️
This isn't just analysis — it's a high-stakes forex heist, engineered using Thief Trading Style's elite blend of technical, macro, sentiment, and quantitative insights. We're cracking the GBP/AUD vault with sharp bearish setups targeting a major liquidity zone — aka the Police Barricade Support Area! 🚨🔫
📉 Plan of Attack – Short Entry Setup
This isn’t your typical chart — this is blueprint-grade precision. Here's the GBP/AUD short strategy for Day & Swing Traders:
🚪 ENTRY ZONE
Initiate bearish positions at or near recent highs (wick level).
Use limit orders stacked (layering/DCA style) on the 15m or 30m retest zones for sniper entries.
Look for wicks with rejection — that’s where the fake bullish robbers get trapped!
🛑 STOP LOSS
Place SL just above recent 4H swing highs (2.06100 as a reference).
Adjust according to position size and the number of orders you’re layering.
🎯 TARGET ZONE
Aim for 2.02500, or book partial profits earlier if the heist gets heat.
Escape before the alarms ring! Secure the bag and vanish like a pro.
🔍Fundamental & Sentiment Heist Intel 📚
This bearish pressure on GBP/AUD isn’t random — it’s triggered by a perfect storm:
COT Positioning flips 📊
Aussie strength from commodities & RBA commentary 📈
GBP uncertainty from macro tightening & economic data ⚖️
Sentiment exhaustion at highs + false bullish trap 📉
Consolidation zone breakdown = smart money move! 💼
Wanna go deep? 🧠
Tap into COT, Macro Trends, Intermarket Analysis & Thief’s proprietary scoreboardsss 📡🔗
⚠️ News & Position Management Alert 🚧
📰 Avoid entry around key news drops
🔒 Lock in profits with trailing SL
💼 Secure capital > Chase greed
🔥 SHOW SOME LOVE 🔥
💖 Smash that ❤️ BOOST button — it powers our next big heist!
Together, we rob the market with style, skill, and precision.
See you on the next breakout robbery mission, legends!
Stay dangerous. Stay profitable. Stay Thief. 🐱👤💵🚀

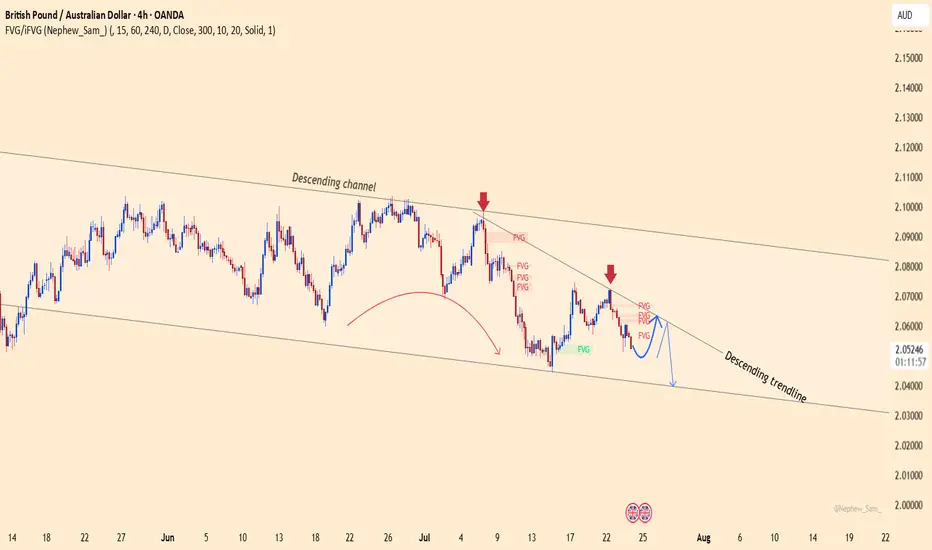
GBPAUD – False breakout or the next sharp drop?The GBPAUD pair continues to trade within a well-defined descending channel, with every bullish attempt being firmly rejected by the descending trendline. Recent candlesticks show a clear sell signal right at the FVG resistance zone.
Market-moving news:
Australia’s manufacturing PMI surprised to the upside → strong support for AUD
GBP remains under pressure after dovish comments from the BoE, diminishing hopes of further rate hikes.
If the price fails to break above the 2.0640 zone — creating yet another fake top — a sharp drop toward 2.0400 is highly likely.
Strategy: Look to SELL near the trendline and FVG zone, targeting 2.0400.

GBPAUD 1H LongBearish Trend
Price is testing 1D TF trendline.
Bullish Divergence
Double bottom Pattern
RR 1:1
Price can fall if its break its last LL (Critical Point)
