Short Position on GBP/AUD GooD Risk/Reward SetupShort setup on GBP/AUD with risk/reward above 1:3. Entry at 2.0200, stop at 2.0308, target at 1.9815. Good luck!
GBPAUD trade ideas

GBP/AUD "Pound-Swiss" Forex Market Bullish Heist Plan🌟Hi! Hola! Ola! Bonjour! Hallo!🌟
Dear Money Makers & Robbers, 🤑 💰
Based on 🔥Thief Trading style technical and fundamental analysis🔥, here is our master plan to heist the GBP/CHF "Pound-Swiss" Forex market. Please adhere to the strategy I've outlined in the chart, which emphasizes long entry. Our aim is the high-risk Red Zone. Risky level, overbought market, consolidation, trend reversal, trap at the level where traders and bearish robbers are stronger. 👀 So Be Careful, wealthy and safe trade.💪🏆🎉
Entry 📈 : You can enter a Bull trade at any point,
however I advise placing Buy limit orders within a 15 or 30 minute timeframe. Entry from the most recent or closest low or high level should be in retest.
Stop Loss 🛑: Using the 1H period, the recent / nearest low or high level.
Goal 🎯: 2.05500
Scalpers, take note : only scalp on the Long side. If you have a lot of money, you can go straight away; if not, you can join swing traders and carry out the robbery plan. Use trailing SL to safeguard your money 💰.
📰 Based on the fundamental analysis 🗞️, I would conclude that the GBP/AUD pair is: Bullish
Reasons:
Interest rate differential: The Bank of England's (BoE) interest rate (3.5%) is higher than the Reserve Bank of Australia's (RBA) interest rate (2.85%), making the GBP more attractive to investors.
Economic growth: The UK's GDP growth (1.1%) is relatively stable, while Australia's growth (1.7%) is more dependent on external factors, such as China's economic growth.
Trade balance: The UK's trade deficit is a concern, but Australia's trade surplus is largely dependent on commodity exports, which are subject to price volatility.
Commodity prices: Australia's economy is heavily reliant on commodity exports, and a decline in commodity prices could negatively impact the AUD.
However, it's essential to consider the following risks:
Brexit uncertainty: The ongoing Brexit process could lead to GBP volatility and impact the pair.
Global economic slowdown: Weakening economic growth in Europe, China, and other regions could impact the UK's exports and growth.
RBA's monetary policy: The RBA's dovish stance and potential interest rate cuts could support the AUD.
Bullish Scenario:
Stronger UK economic data, such as GDP growth and inflation, supports the GBP
Commodity prices decline, negatively impacting the AUD
Warning⚠️ : Our heist strategy is incompatible with Fundamental Analysis news 📰 🗞️. We'll wreck our plan by smashing the Stop Loss 🚫🚏. Avoid entering the market right after the news release.
Take advantage of the target and get away 🎯 Swing Traders Please reserve the half amount of money and watch for the next dynamic level or order block breakout. Once it is resolved, we can go on to the next new target in our heist plan.
💖Supporting our robbery plan will enable us to effortlessly make and steal money 💰💵 Tell your friends, Colleagues and family to follow, like, and share. Boost the strength of our robbery team. Every day in this market make money with ease by using the Thief Trading Style.🏆💪🤝❤️🎉🚀
I'll see you soon with another heist plan, so stay tuned 🫂

GBPAUD Wave Structure Analysis with Multiple Timeframes- 4H swing is bearish => Currently is pullback.
- M15 swing is bullish.
We can look for buying opportunities up to the supply zone of the 4 hour frame. Then if the 15 minute frame gives a bearish reversal signal we can sell down.


Pound Aussie shortBeautiful price action from the Pound Aussie signifies a potential short trade for a long period to take out previous lows.

GBPAUD Forecast: Bullish Momentum Ahead!I'm excited to share my analysis for the GBPAUD pair, where I see a promising bullish trend emerging. As per the EASY Trading AI strategy, my current recommendation is to enter a buy at 2.01259, with a take profit set at 2.01560333 and a stop loss at 2.00769333.
The rationale behind this forecast is based on several influencing factors. Recent market behavior indicates a strong bullish sentiment, driven by positive economic indicators from the UK and steady performance from Australia. We've also seen increased buying pressure around our entry point, which aligns with historical support levels.
Additionally, technical analysis from the EASY Trading AI shows a favorable trend pattern developing, suggesting that we could see an upward movement in the near future. The confluence of these factors supports my conviction for a buy strategy.
To maximize your potential, consider leveraging signals available through our Telegram bots or employing the automated trading robots designed to work with the EASY Trading AI strategy.
Always remember, while opportunities abound, thoughtful risk management is key to long-term success in trading. Happy trading!

GBPAUD SELL signal. Don't forget about stop-loss.
Write in the comments all your questions and instruments analysis of which you want to see.
Friends, push the like button, write a comment, and share with your mates - that would be the best THANK YOU.
P.S. I personally will open entry if the price will show it according to my strategy.
Always make your analysis before a trade

The Bullish Surge of GBPAUD: Riding the Wave with EASY Trading AWith the recent insights from our EASY Trading AI strategy, I'm spotlighting a promising Buy opportunity on the GBPAUD pair. Current market dynamics and historical patterns suggest an entry price at 2.00683, aiming for a take-profit at 2.01501, while safeguarding positions with a stop-loss at 1.99966.
What fuels this bullish sentiment? Several factors come into play. First, the strategy expertly leverages historical data to pinpoint moments where market psychology aligns with key support levels, providing a robust foundation for this forecast. The AI-driven analysis examines market trends every second, enhancing the strategy's capacity to adapt swiftly to evolving conditions.
Moreover, broader economic indicators point towards potential GBP strength against the AUD, tied to monetary policies and economic outputs from the UK and Australia. This backdrop, combined with the precise entry and exit points offered by the strategy, renders this plan both strategic and evidence-driven.
As always, while the market is ripe with opportunities, cautious risk management remains paramount. Investors can further explore automated options like the EASY Bots or receive trade signals directly via Telegram for seamless integration into their trading workflow. Embark on this trading journey with us, calibrated for precision and success. 🌟

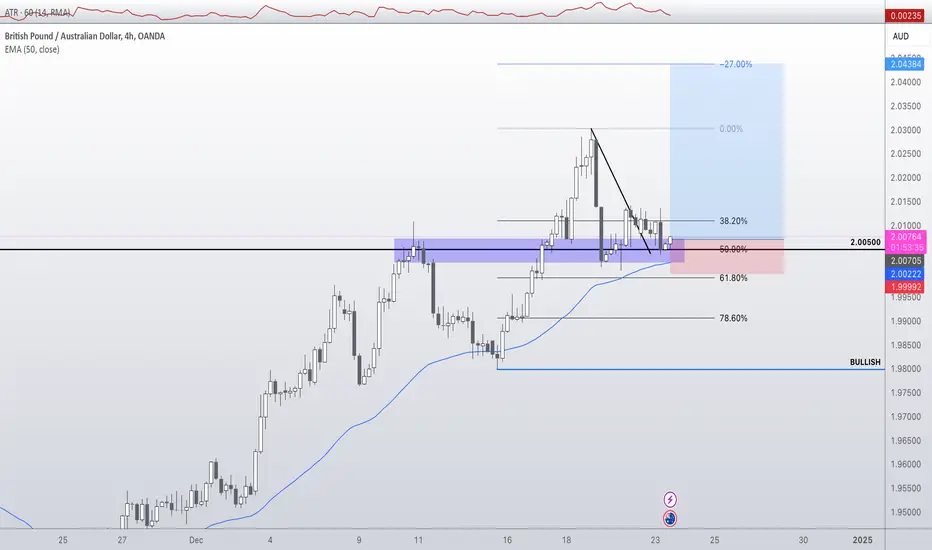
Risky LongsBecause we are closer to EOY, trading is generally more risky. But looking at longs on GBPAUD now.
Confluences:
- 2.00500
- 50 fib
- H4 SNR
- H1 Double bottom & retest on neckline
GBP/AUD Analysis – Wyckoff Method (2-Day Timeframe)GBP/AUD pair is currently in a strong key area. According to the Wyckoff method, close monitoring is essential as the price could provide a good setup for either a buy or sell opportunity.
A return into the green range could signal a selling opportunity, especially considering the December 18 candle, which showed strong selling pressure but lacked continuation. On the other hand, if the price closes outside the ascending channel, it may indicate a potential buying opportunity.
Traders should carefully observe the price action, candle structure, and volume dynamics to confirm their strategy. This setup aligns with Wyckoff's principles of accumulation, distribution, and trend reversals, making it relevant for those following volume-based trading or price action methods.
This is my personal analysis and opinion, not a recommendation to buy or sell.

GBPAUDTHE British pounds sterling's on weekly chart broke out of descending trendline opening a buy position for British pounds. the December meeting by BOE monitory committee team ,the kept interest rate at 4.75% ,its Interest Rate Differentials will give The Bank of England (BoE) a statistical advantage over Reserve Bank of Australia (RBA) monitory polices. This interest rate differential makes GBP-denominated assets more attractive to investors, leading to increased demand for the pound sterling.
Economic Performance: The UK economy has shown signs of strength, which has bolstered confidence in the pounds. In contrast, the Australian economy has faced challenges, including slower growth and concerns about its reliance on China, which has been experiencing economic difficulties .
the future of commodities will affect Australian dollar as the economy rely heavily on commodities.

GBPAUD: Bears Will Push Lower
Balance of buyers and sellers on the GBPAUD pair, that is best felt when all the timeframes are analyzed properly is shifting in favor of the sellers, therefore is it only natural that we go short on the pair.
❤️ Please, support our work with like & comment! ❤️

GBPAUD-SELL strategy Daily chartThe pair tried higher once again and failed. The regression channel shows potential to a medium-term return back to 1.9375 area. This will not be a one way move, but overtime this is the potential I feel.
Strategy SELL @ 2.0080-2.0130 and take profit near 1.9675 at first.

GBPAUD potential sell setup & updateAs per our last analysis on GBPAUD we are still Bullish on the pair, however, we are keen to see price break below the 4h low to look for buy opportunities, currently I am waiting for price to push up to my area of interest so I can look for selling opportunities to continue price lower where we will eventually be looking for buying opportunities.
Remember, Clear charts better vision

GBP_AUD BULLISH BIAS|LONG|
✅GBP_AUD is trading along the rising support line
And as the pair is going up now
After the retest of the line
I am expecting the price to keep growing
To retest the supply levels above at 2.0250
LONG🚀
✅Like and subscribe to never miss a new idea!✅

GBPAUD TO 2.0000!!!!We are targetting a round pscyholgical numbers which tend to work cause other traders also see them and makes it self fulfilling. trend analysis + fibonacci

GBPAUD buy setupHere at Burnt Candle, we are Bullish on a long term basis. On this particular chart, we are waiting for price to drop first into our area of interest to look for buy opportunities to continue the anticipated Bullish momentum.
Remember, clear charts better vision

British Pound/ Australian Dollar Buy. Looking forward to buy at that zone 2.00004 using 20pips SL with 1:10R as Take profit level.
Thought : Using the previous week Friday Low as the liquidity hence expecting upward price movement after clearing that zone. If it didn't hold ;
I'll be looking forward to buy from 1.99414 because it's within the Imbalance created last week and also within the discounted zone of the current 4hr range.
I'm anticipating the weekly candle to close bearish while Tuesday or Wednesday is the high of the week.
What's your thoughts on this? 🫴
Let's share Ideas 💡
#HallowAdept.

GBPAUD 23.12.2024Price mitigated Weekly POI, give us bos to downside on 4H. Price hasn't mitigated 50 fib level of bearish move. I consider new HH as a liquidity to be taken out before price will go to mitigate Daily and Weekly FVG.

GBPAUD sell signal. Don't forget about stop-loss.
Write in the comments all your questions and instruments analysis of which you want to see.
Friends, push the like button, write a comment, and share with your mates - that would be the best THANK YOU.
P.S. I personally will open entry if the price will show it according to my strategy.
Always make your analysis before a trade

GBP/Aud Simple trendline with resistance I've noticed a break out from a ranging market still respecting a bullish trendline up to the next resistance is my target.

GBP-AUD Potential Long! Buy!
Hello,Traders!
GBP-AUD is trading in an
Uptrend along the rising
Support so after the retest
We will be expecting a
A bullish rebound
And a move up
Buy!
Comment and subscribe to help us grow!
Check out other forecasts below too!

Watching and Waiting for a Trend line break on GBPAUDWatching and waiting for this pair to break this trend line on the H4 time frame.
Reasons I think price will break through:
- RSI was overbought on H4
- Bearish RSI Divergence on H4
- Bullish candles are getting smaller
What do you think?
*Also please remember these are trading ideas and not trading signals. Thank you.
