GBPAUD Will Go Lower From Resistance! Sell!
Please, check our technical outlook for GBPAUD.
Time Frame: 2h
Current Trend: Bearish
Sentiment: Overbought (based on 7-period RSI)
Forecast: Bearish
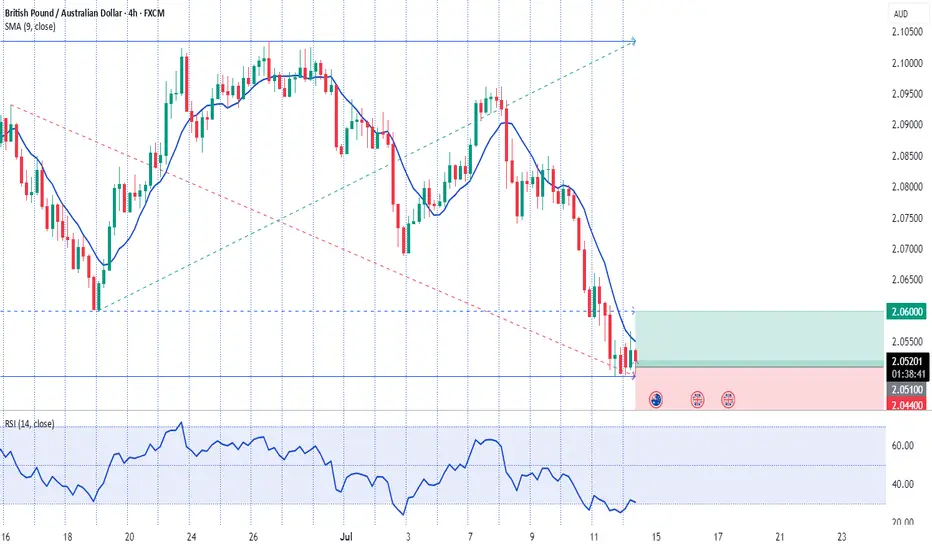
The price is testing a key resistance 2.071.
Taking into consideration the current market trend & overbought RSI, chances will be high to see a bearish movement to the downside at least to 2.058 level.
P.S
We determine oversold/overbought condition with RSI indicator.
When it drops below 30 - the market is considered to be oversold.
When it bounces above 70 - the market is considered to be overbought.
Disclosure: I am part of Trade Nation's Influencer program and receive a monthly fee for using their TradingView charts in my analysis.
Like and subscribe and comment my ideas if you enjoy them!
GBPAUD trade ideas

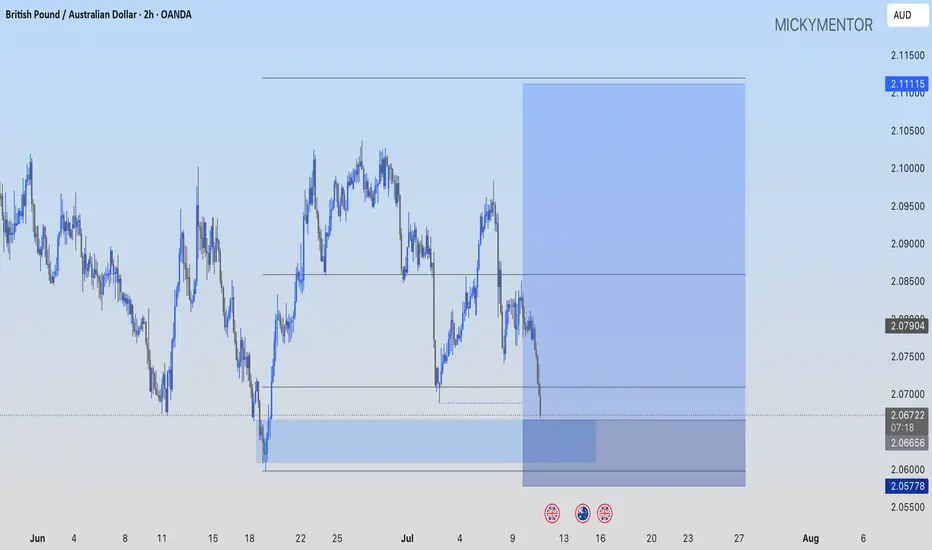
GBPAUD BUY LOW OF THE RANGE (BLSHS)Price is in 3 month trading range, price attempted breakout in either direction but failed multiple times.
In a Trading Range we Buy Low Sell High Scalp (BLSHS).
- Upper Range is at (2.10379 - 2.09843).
- Low of the Range at (2.05636 - 2.04819) where price is currently at.
- Price formed a new higher low at 2.07375 showing buyers coming.
- Price was rejected strongly at the low of the range and formed RSI Divergence at the level signaling a reversal the upside.
- AUD employment data released today at 4:30AM if negative price will breakout strongly
Stop loss below the new higher low at 2.07375 or below the setup at 2.04423.
Take profit at 2.07045 or at the top of the range at (2.10379 - 2.09843).

GBPAUD Swing Trade Idea 15-07-2025Hello Traders
Here's a breakdown on GBPAUD: Daily Timeframe
1. Overall trend is bullish; price has been consistently forming HH & respecting HL.
2. Current price is in corrective phase, meaning we should be focusing on sells until we reach our discounted level, and price will be following bearish order flow (Forming LL & respecting LH)
3. Using the identified swing high and swing low, we can place our Fibonacci to identify discounted prices where we can look for possible longs again.
4. Until then we can identify internal swing low and swing high using the H4 timeframe, and we can identify premium levels to look for potential short positions (Counter trend trade) as illustrated.

GBP/AUD: Familiar support holds as global growth fears biteThe bearish unwind in GBP/AUD stalled in familiar territory, bouncing from 2.0500 in Asian trade, continuing the pattern seen since April when Donald Trump first unveiled reciprocal tariff rates on U.S. trading partners. Now, like then, the bounce likely reflects concern about the outlook for the global economy following the unveiling of 30% tariff rates on E.U. imports entering the United States from August 1. The headline-driven nature of the move overrides the deeply bearish message coming from momentum indicators like RSI (14) and MACD.
If the pair were to move towards 2.0500 again, it would create a decent long setup where positions could be established above the level with a stop beneath for protection. 2.0600 and 2.0700 screen as possible targets, although the most appealing target would be 2.0800 from a risk-reward perspective—that level has seen plenty of work either side of it over recent months and has the 50-day moving average located just above.
If the pair were to reverse back through 2.0500 and close there, the bullish setup would be invalidated, opening the door for bearish trades to be set targeting support at 2.0300.
Good luck!
DS

Will This Breakout Unlock the Money Run? GBP/AUD Heist Begins!💼The Pound Heist: GBP/AUD Break-In Blueprint🔐
“The vault’s half open… Are you in or watching from the cameras?”
🌍 Hey crew! 💬 Hola, Ola, Bonjour, Hallo, Marhaba! 🌟
Welcome to another sneaky setup from the Thief Trading Syndicate™ 🕵️♂️💸
We're setting our sights on GBP/AUD — and the market's flashing green for a bold long entry mission. Read the plan carefully before suiting up. 🎯
🧠 Mission Brief:
The “Pound vs Aussie” market is now playing around a key resistance wall – it’s hot, it’s risky, and it’s primed for a breakout 🎇.
🟢 Entry:
Break & Close Above 2.10500 = 🚨 Green Light
🎯 Set a Buy Stop above the resistance zone —
OR
Sneak in with a Buy Limit during a clean pullback to recent high/low on the 15m or 30m timeframes 🔍.
⏰ Set an alert, don’t miss the moment the vault cracks open.
🛡️ Stop Loss Plan – Lock Your Exit:
🛑 For Buy Stops:
➡️ Wait till the breakout confirms — don’t rush your SL like a rookie 🐣
📍 Suggested SL at swing low (2.08700) based on the 3H timeframe
💡 Always size your SL based on your risk tolerance, not just the setup.
🎯 The Escape Plan – Target:
🏁 First Checkpoint: 2.13000
📤 Or slip out early if you sense heavy guards (resistance) on duty.
Use Trailing SL to lock your loot while staying in the run.
🧲 Scalper's Note:
Only rob the bullish side! If you’re packing heavy funds, hit fast — else join the swing crew and move with caution. 🎒
Lock in profits with trailing exits to avoid being caught in the chop 🌀.
📊 Why This Heist Works – Market Fuel:
🔥 Bullish sentiment fueled by:
Technical setup (Resistance > Breakout > Momentum Surge)
Risk zone analysis
Macro & COT outlooks
Sentiment + Intermarket Alignment
Stay informed — read the full macro game plan, news, and positioning tools. Knowledge = clean escape. 🧠💼
📰 News Alert:
⚠️ Avoid new entries during high-volatility events
✅ Use trailing SLs to protect any active trades
🔐 Stay safe, stay sharp — the market’s watching too 👁️
🆙 Support the Crew:
Smash the 💥 Boost Button 💥 if you ride with the Thief Style Traders 🐱👤💸
Let’s continue bagging pips & stacking gold, one chart at a time.
🚀 Next mission drops soon. Stay sharp. Stay sneaky. Stay paid.
#ThiefTrading #ForexHeist #GBPAUDPlan

GBPAUD Pre-Market Analysis📉 GBPAUD Pre-Market Analysis – Weekly Outlook
Date: July 13, 2025
Session: Pre-London Open
Analyst: Papalui | Sub Saharan Technicals
🕵️♂️ Macro Outlook
The British Pound / Australian Dollar (GBPAUD) is currently showing signs of trend exhaustion after reaching major highs around the 2.14932 zone (Marked MHH – Most Recent Higher High). A strong bearish reaction is emerging from this area, suggesting potential for long-term downside retracement or even a reversal.
🔍 Technical Structure Breakdown (1W)
MHH (Major Higher High): 2.14932
WHH (Weekly Higher High): 2.06088
Current Price: 2.05049
Fib 50% Level: Aligned around recent resistance and acting as a pivot zone.
BOS (Break of Structure): Occurred in early 2022, later invalidated by strong bullish rally.
MLL (Major Lower Low Target Zone): Projected zone around 1.59109 - 1.57752
📉 Bearish Scenario: Reversal Play
🔽 Bias: Bearish Reversal
Context: Price has formed a new high but is rejecting near the 50% Fibonacci retracement and supply zone.
Plan: Watch for lower timeframe confirmations (e.g., D1 or H4 structure breaks) below 2.04859 to initiate short positions.
Target Zones:
TP1: 1.86584
TP2: 1.81327
TP3: 1.59109 – aligning with weekly demand and structural lows
🔧 Invalidation: A sustained weekly close above 2.14932 would invalidate this bearish scenario and signal bullish continuation.
🔁 Trade Management Zones
Zone Type Action
2.06088 - 2.14932 Supply/Resistance Monitor for rejections or confirmations of reversal
1.86584 - 1.81327 Intermediate Support Partial TP or structure reassessment
1.59109 Major Demand Full TP / Trend reversal opportunity
🧠 Sentiment & Strategy
This pair has rallied over the past year, but the bearish impulse from the recent high suggests large players may be unloading positions. With key Fibonacci confluence and price action showing weakness, the current zone is a strong sell interest region. Traders should:
Stay alert for weekly or daily lower lows
Use smaller timeframes to refine entries
Avoid premature entries before price confirms lower timeframe structure breaks
📌 Summary
Bias Key Resistance POI Bearish Target
Bearish 2.14932 2.04859 1.59109
Risk Disclosure:
All trading involves risk. This analysis is for educational purposes only and should not be taken as financial advice. Always manage risk appropriately.

GBP_AUD LONG FROM SUPPORT|
✅GBP_AUD fell down sharply
But a strong support level was hit at 2.0500
Thus I am expecting a rebound
And a move up towards the target of 2.0580
LONG🚀
✅Like and subscribe to never miss a new idea!✅
Disclosure: I am part of Trade Nation's Influencer program and receive a monthly fee for using their TradingView charts in my analysis.

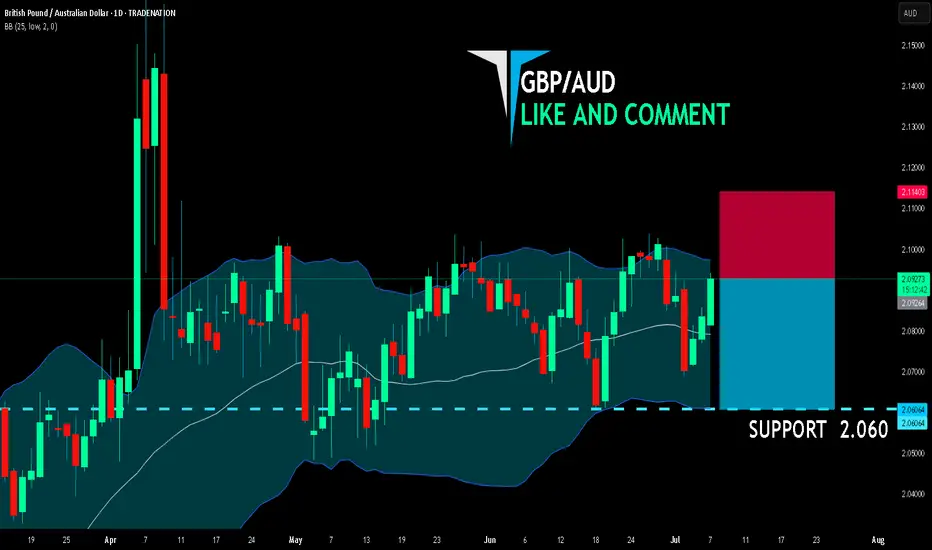
GBP/AUD BEARS ARE STRONG HERE|SHORT
GBP/AUD SIGNAL
Trade Direction: short
Entry Level: 2.092
Target Level: 2.060
Stop Loss: 2.114
RISK PROFILE
Risk level: medium
Suggested risk: 1%
Timeframe: 1D
Disclosure: I am part of Trade Nation's Influencer program and receive a monthly fee for using their TradingView charts in my analysis.
✅LIKE AND COMMENT MY IDEAS✅
GBPAUD Buy opportunity! It is time to buy GBPAUD . Nice trendline support and rejection and bounced back from a strong support area as well. 1:2 risk rewards. You can take first tp @ 1:1 position and last one is @1:2. do not risk more than 1% from the account.

Is the currency GBPAUD depreciating?
Hi dears
I think that if the colored trend line is broken, the downtrend will probably continue until it reaches the target.
Thank you for supporting me by liking, commenting, and subscribing.

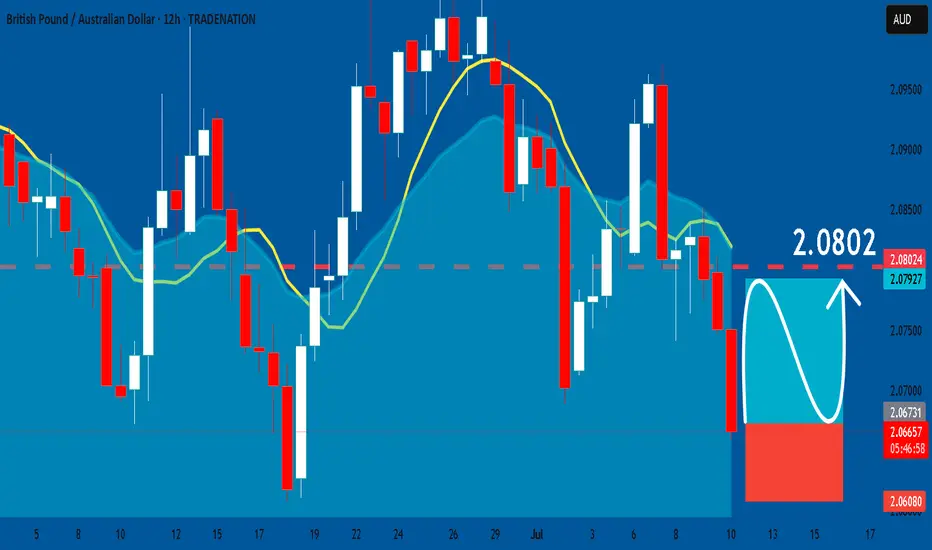
GBPAUD: Long Trade Explained
GBPAUD
- Classic bullish formation
- Our team expects growth
SUGGESTED TRADE:
Swing Trade
Buy GBPAUD
Entry Level - 2.0672
Sl - 2.0608
Tp - 2.0802
Our Risk - 1%
Start protection of your profits from lower levels
Disclosure: I am part of Trade Nation's Influencer program and receive a monthly fee for using their TradingView charts in my analysis.
❤️ Please, support our work with like & comment! ❤️
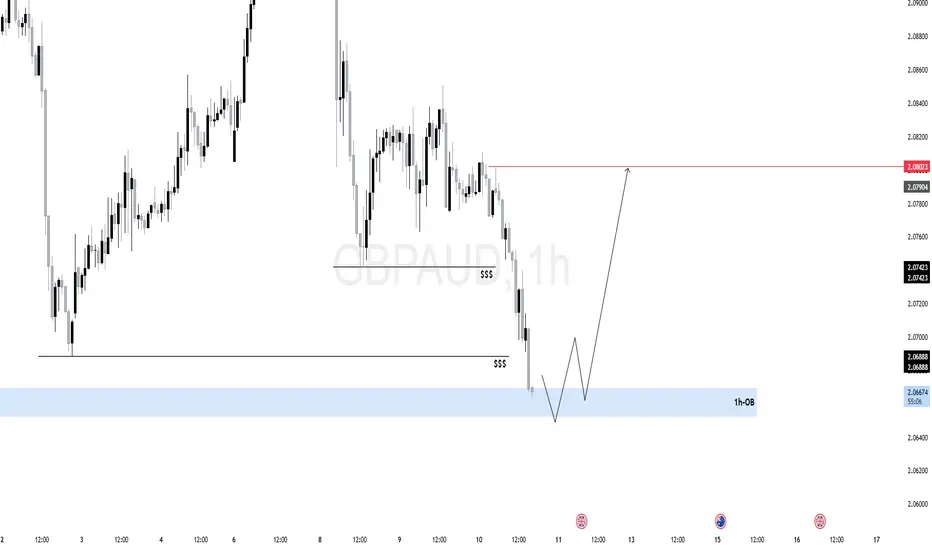
$GA (GBPAUD) 1HIf price holds and reacts from the OB, expect a short-term bullish leg toward:
Internal liquidity first (2.07400), Then external buy-side liquidity above 2.08000.
Price has been in a clear bearish structure, printing lower highs and lower lows.
Recently, price swept multiple layers of internal liquidity (marked as $$$) before tapping into a key Order Block (OB) just above the 2.06500 zone.
The OB zone aligns with a higher timeframe demand area, suggesting this could be a reaccumulation phase.
The OB zone has previously led to strong expansions, making it a valid area for institutional re-entry.
The current liquidity grab beneath the previous lows appears intentional — a trap for breakout sellers.
Smart money often waits for such sweeps to absorb sell-side liquidity before shifting the structure.
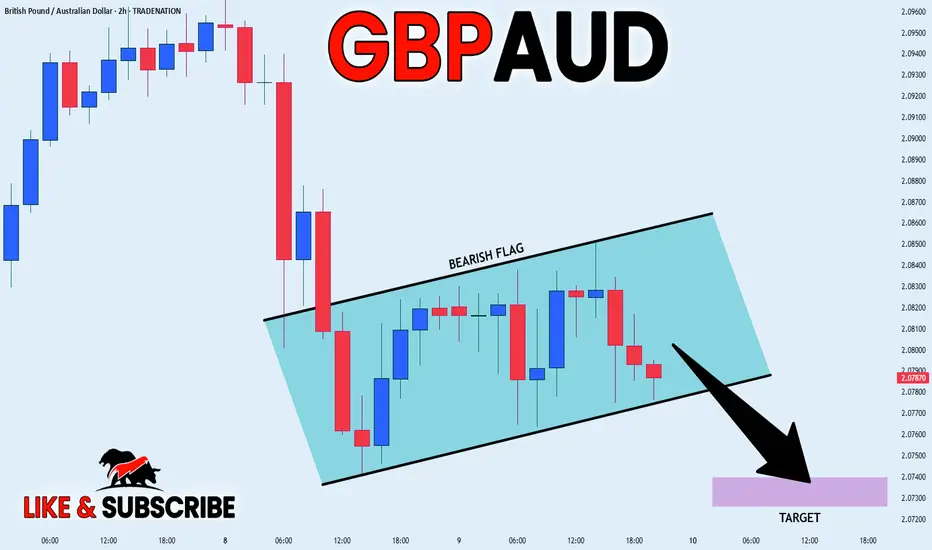
GBP/AUD - Bearish Flag (10.07.2025)The GBP/AUD Pair on the M30 timeframe presents a Potential Selling Opportunity due to a recent Formation of a Bearish Flag Pattern. This suggests a shift in momentum towards the downside in the coming hours.
Possible Short Trade:
Entry: Consider Entering A Short Position around Trendline Of The Pattern.
Target Levels:
1st Support – 2.0671
2nd Support – 2.0607
🎁 Please hit the like button and
🎁 Leave a comment to support for My Post !
Your likes and comments are incredibly motivating and will encourage me to share more analysis with you.
Best Regards, KABHI_TA_TRADING
Thank you.
Disclosure: I am part of Trade Nation's Influencer program and receive a monthly fee for using their TradingView charts in my analysis.

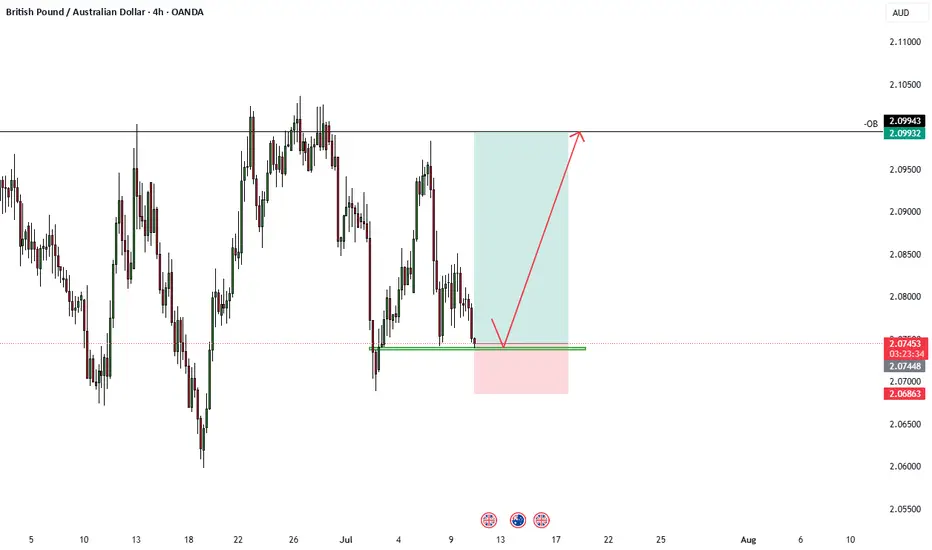
GBPAUD 1:4.25 Trade Idea - ICT1:4.25 Trade Idea on GBPAUD, bullish on the pair looking good to re-test the -OB on the daily.
GBPAUD: Bounce-and-Fill into 2.0830
Price just tagged 2.0731 the former ceiling that’s now acting as intraday support, and printed a clean rejection wick. If that level holds, I’m looking for bulls to squeeze us back toward the 2.0810-2.0830 supply zone . From there, I’ll watch for fresh sell signals. Bias flips only if 2.0731 breaks convincingly.

GBP_AUD BEARISH FLAG|SHORT|
✅GBP_AUD is going down now
And the pair has formed
A bearish flag pattern
Which makes me bearish biased
And after the breakout
I believe we will see bearish continuation
SHORT🔥
✅Like and subscribe to never miss a new idea!✅
Disclosure: I am part of Trade Nation's Influencer program and receive a monthly fee for using their TradingView charts in my analysis.
GBPAUD neutral - 9th July 2025This is my detailed multi-timeframe analysis for GBPAUD, based on the prevailing market structure, key liquidity zones, and candlestick behaviour.
Quarterly Timeframe:
On the three-month timeframe, price recently reached a significant liquidity region around 2.1600. From this level, the market has attracted substantial bearish orders, as evidenced by the recent quarterly candlestick, which closed relatively bearish. This suggests that bullish momentum has weakened considerably at these highs. Consequently, I expect that additional bearish orders may continue to enter the market, leading to a moderate retracement in the coming quarters.
Monthly Timeframe:
On the monthly chart, while price rejected the major liquidity region at 2.1600, the subsequent monthly candles have shown some signs of bullish intent, as indicated by wicks forming higher highs and higher lows. However, the candlestick bodies reveal an overall lack of follow-through, implying indecision in the market.
June’s monthly candle closed relatively bearish and indecisive, which may suggest that price is currently accumulating orders to fuel its next significant move. My current intuition leans towards a potential continuation higher, provided that price action confirms this bias. Notably, June’s candle could be interpreted as a potential order block, suggesting the possibility of price filling orders for a bullish move.
Nevertheless, the presence of a textbook ‘W’ formation must be acknowledged. The bearish close in June may imply a retest of the neckline around the 2.0300 level. Should bearish confirmations appear, this scenario could unfold in the medium term.
Weekly Timeframe:
The weekly timeframe indicates that price has been consolidating for the past five weeks. This choppy, indecisive price action makes the structure more challenging to interpret with conviction. The base of this consolidation zone sits around 2.0825; a clear weekly close below this level could present a case for bearish continuation, contingent on supporting confluences. At present, my bias on the weekly timeframe remains neutral given the lack of a clear directional signal.
Daily Timeframe:
On the daily chart, the market showed notable bearish activity in the previous session, closing below the key 2.0880 region. The next significant liquidity area to watch lies around 2.0700. My short-term bias for the day is bearish, and I anticipate that price may move towards this region. However, I do not regard this as a high-probability setup, so caution is warranted.
4-Hour Timeframe:
The 4-hour timeframe offers little additional clarity beyond the observation that price absorbed considerable bearish orders around the 2.0950 level. If price closes above the 2.0838 level, I will consider a short-term long position targeting the daily liquidity region at 2.0880. Overall, my stance on the 4-hour chart is largely neutral until more decisive price action emerges.
Disclaimer:
This analysis is intended for informational and educational purposes only. It does not constitute financial advice. Please conduct your own research and apply sound risk management before entering any trades.

Tap and goWe might see this guy tapping on that POI after taking out that previous low, then push up

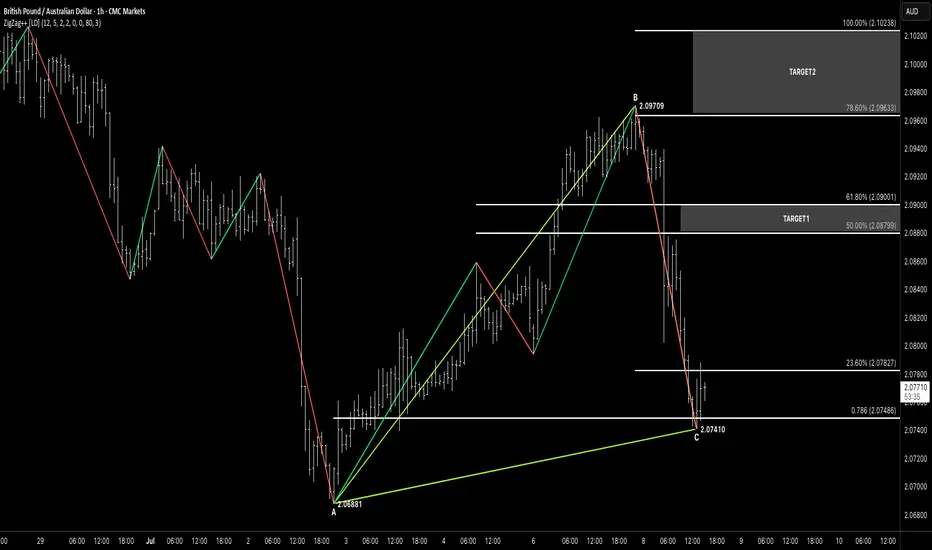
ABCHey traders, hope you’re crushing it this week! 🚀
Just spotted a clean ABC Bullish setup on the GBP/AUD 1-Hour chart. Here’s the breakdown:
🧠 Pattern Breakdown
A→B (Impulse Up): 2.06881 → 2.09709
B→C (Retrace Down): 2.09709 → 2.07410
Point C landed right on our rising A→C trendline and just under the 78.6% Fib of A→B (~2.07486)—double confluence!
✅ Why This Works
ABC Structure: Clear impulse then corrective leg into support
Trendline Support: A→C line guiding our C pivot
Fib Confluence: C sits in the 23.6%–78.6% zone of A→B (2.07827–2.07486)
⚔️ Trade Plan
Entry: Long after an hourly close above 2.07827 (23.6% level), ideally within 2.07827–2.07410 (PCZ)
Stop-Loss: Just below point C at 2.07410 (e.g. 2.07380)
Size: Keep risk sensible—1–2% of your account
🎯 Profit Targets
T1: 50% retrace of B→C → 2.08799 (take partial)
T2: 61.8% retrace → 2.09001
T3: 78.6% retrace → 2.09633–2.10238
🔍 Confirmation & Invalidation
Confirm: Look for a bullish pin-bar or engulfing candle closing above 2.07827 before entering
Invalidate: If price dips below 2.07410 (point C), scrap the idea—this setup needs that level to hold
💡 Keep It Simple:
ABC → PCZ → 23.6% close → Trigger → Ride.
Let the chart guide you, not your emotions, and watch for any GBP/AUD news for extra context.
Here’s to tight stops, smart entries, and smooth profits! ✌️
GBP/AUD Trade Setup – Short Bias📉 GBP/AUD Trade Setup – Short Bias
🕒 Timeframe: 1H
📍 Entry Zone: 2.09300–2.09400
🎯 Target Zone: 2.08400
🔍 Analysis:
Price is rejecting a key supply zone after a strong impulsive move. I'm anticipating a return to the previous demand area around 2.08400.
📌 Arrows indicate possible retracement entries within the supply zone for optimal short execution. Watch for bearish confirmation on LTF.
📲
#GBP #FXTrade #GBPUSD #SupplyAndDemand #PriceAction #ForexSignals #SellSetup

GBPAUD SHORTMarket structure bearish on HTFs DH
Entry at both Daily and Weekly Rejection
Weekly Rejection at AOi
Daily Rejection At AOi
Previous Structure point Daily
Around Psychological Level 2.09000
H4 Candlestick rejection
Rejection from Previous structure
Levels 4.22
Entry 95%
REMEMBER : Trading is a Game Of Probability
: Manage Your Risk
: Be Patient
: Every Moment Is Unique
: Rinse, Wash, Repeat!
: Christ is King.
