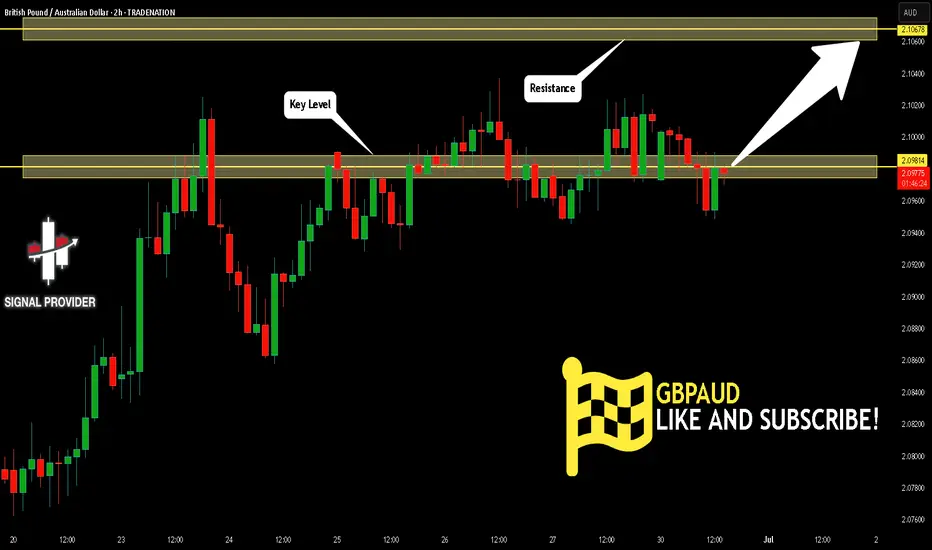
GBPAUD - Trading The Range!Hello TradingView Family / Fellow Traders. This is Richard, also known as theSignalyst.
📈GA has been hovering within a big range.
This week, GA is retesting the upper bound of the range acting as a resistance.
As long as the resistance holds, we will be looking for shorts on lower timeframes, targeting the lower bound of the range.
📚 Always follow your trading plan regarding entry, risk management, and trade management.
Good luck!
All Strategies Are Good; If Managed Properly!
~Rich
Disclosure: I am part of Trade Nation's Influencer program and receive a monthly fee for using their TradingView charts in my analysis.
GBPAUD trade ideas

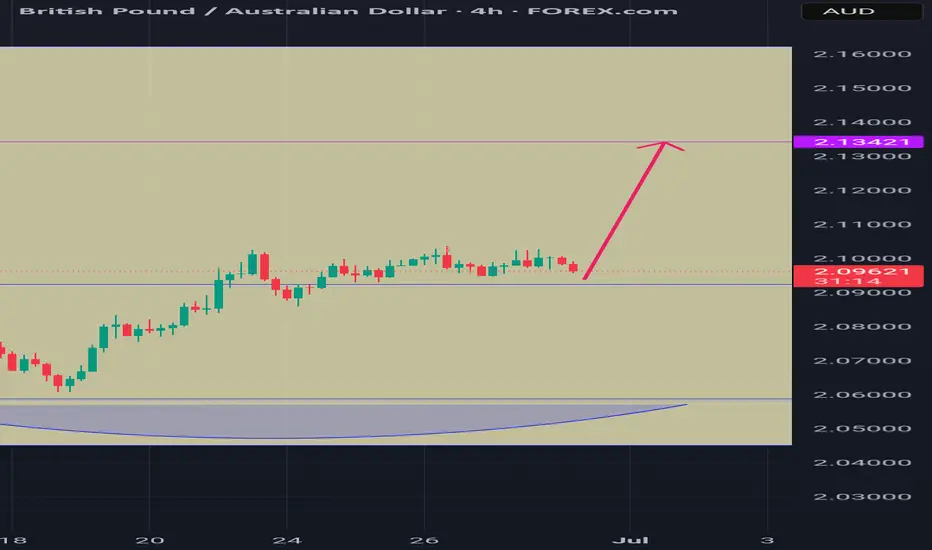
GBPAUD TRADE IDEA We've been tapped into the trade on GBPAUD
We should be making our movement to the upside anytime soon.
The market might possibly slow down based on the holidays tomorrow (July 4th)

GBP/AUD 1H technical and fundamental analysisGBP/AUD 1H technical and fundamental analysis
GBP/AUD has drifted slightly lower over the past week (≈ –0.47%) and month (≈ –0.18%), despite being up roughly +9% YTD. The pair remains under bearish pressure in the short term, primarily due to weaker-than-expected UK GDP data and dovish signals from the Bank of England, which have raised concerns over a potential economic slowdown and future rate cuts.
These fundamentals are weighing on the British Pound, while the Australian Dollar remains relatively stable due to commodity support and neutral RBA guidance.
Technical Outlook (1-Hour Timeframe):
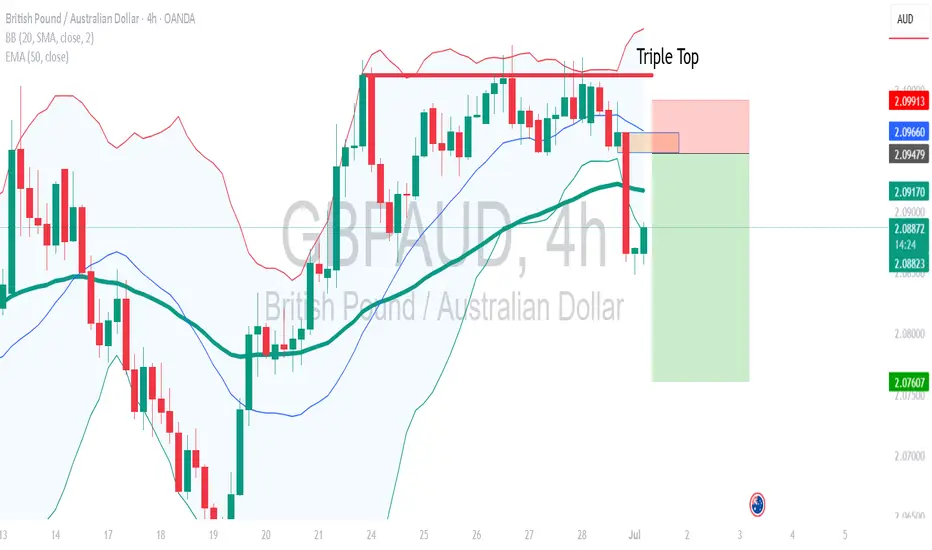
GBP/AUD recently formed a triple top pattern at the upper range, signaling strong seller dominance. Price has since rejected and is heading lower, currently testing the 2.0850–2.0760 minor support zone.
After this zone was broken, price began accumulating sell positions, suggesting institutional interest in driving the pair toward a liquidity zone. We are now seeing a potential stop-loss hunt near 2.0740, which aligns with a smart money sell setup.
Once the market breaks below and closes a bearish candle under key support, it will confirm further downside continuation.
📊 Trade Setup
📍 Area of Interest (AOI): 2.07420 (Sell Limit after candle close below key level)
🛡 Stop-Loss: 2.08120 (Just above the liquidity zone, if clear manipulation is confirmed)
🎯 Take Profit: 2.05980 (Next minor key support / ~1:2 RR)

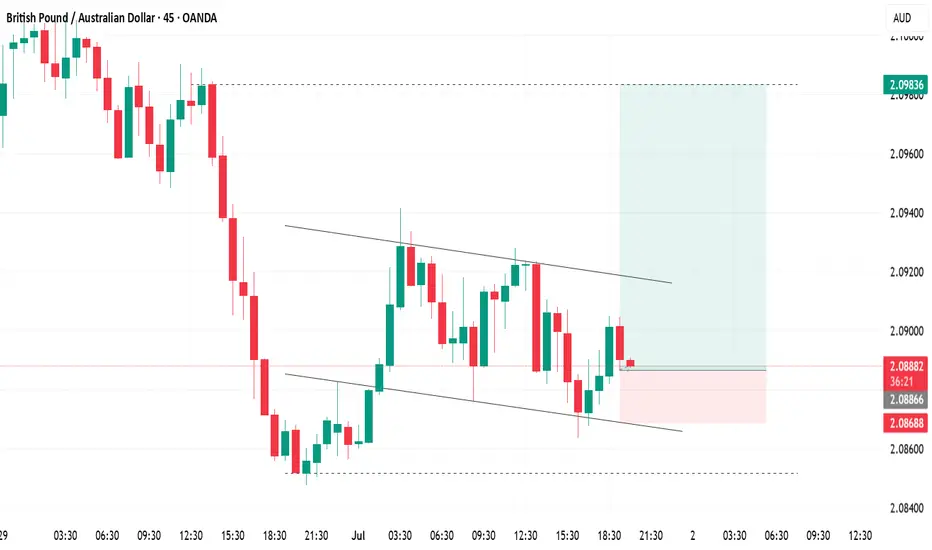
We hit. We failed. Now we drop.OANDA:GBPAUD
Inside this price channel, the market is forming a flag in an attempt to break out.
But given the market cycle and three failed breakout attempts,
I believe it's time for sellers to take control.
📉 I’m siding with the bears on this one!

BUY GBPAUDGBPAUD price will move higher from this area of demand towards 2,1. An inverse head and shoulder pattern has emerged on the daily timeframe.

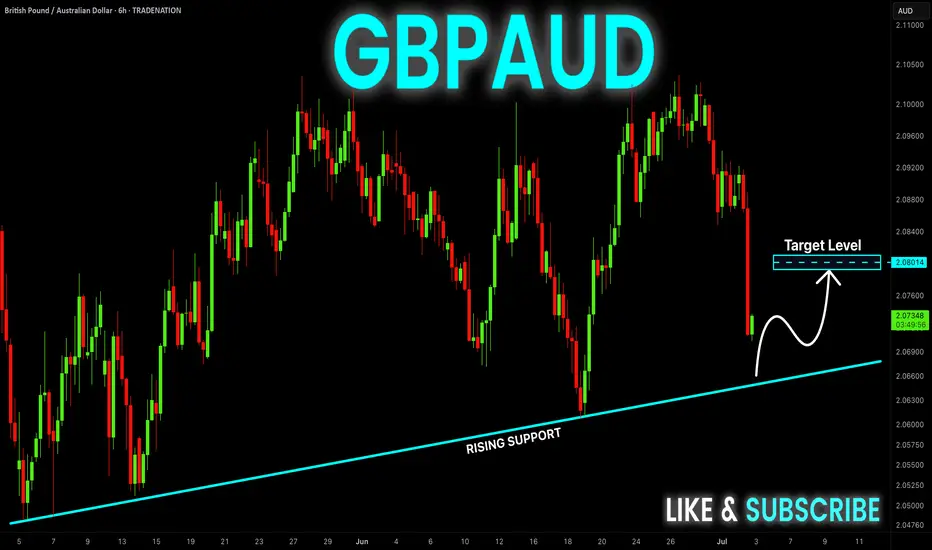
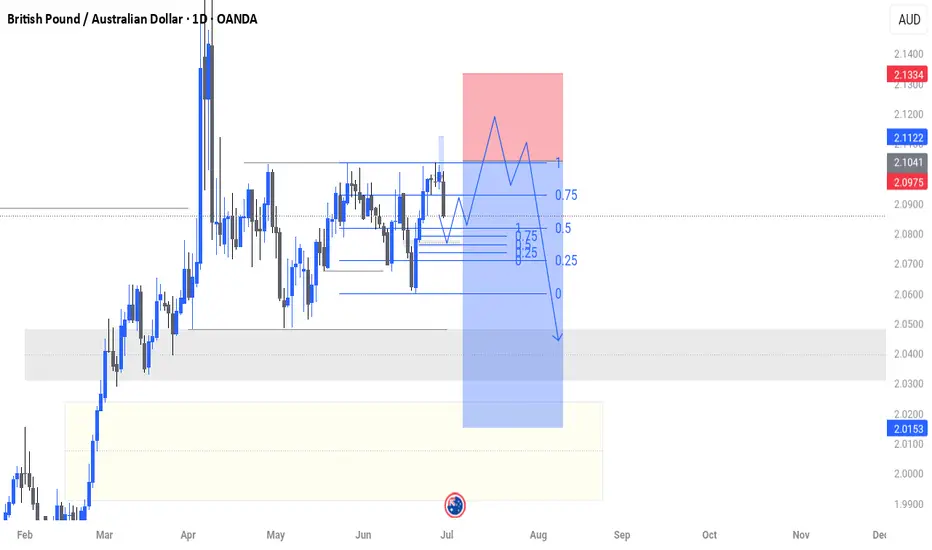
GBP/AUD Range-Bound Structure – Support Retest in ProgressThe GBP/AUD pair is currently trading inside a well-defined horizontal range channel, bounded by resistance around 2.1050–2.1100 and support near 2.0600–2.0650. Price has been moving in a sideways rhythm since late April, oscillating between the two levels with several clean swings.
As of now, the market is heading toward the ascending support trendline, indicating a possible short-term bounce or a larger directional move depending on how price reacts there.
🔄 Scenario 1: Bullish Rebound from Support
If the price finds buying interest near the 2.0650–2.0700 zone and bounces with strong bullish candles, it may signal the beginning of another swing toward the resistance zone at 2.1100. This would maintain the current range-trading behavior, offering traders a buy-low, sell-high opportunity.
Buy Entry: Near 2.0650–2.0700 (after confirmation)
SL: Below 2.0580
TP: 2.0950 / 2.1100
⛔ Scenario 2: Bearish Breakdown from Support
However, if price decisively breaks below the support zone with momentum, it would invalidate the current range and may trigger a larger corrective leg to the downside. This could lead to levels around 2.0400 or even 2.0200, aligned with previous demand zones.
Sell Entry: On breakdown below 2.0600 with retest
SL: Above 2.0700
TP: 2.0400 / 2.0200
🧭 Technical Outlook Summary
Pattern: Horizontal range with slight ascending base
Bias: Neutral – Watch for bounce or breakdown
Support to watch: 2.0650–2.0600
Resistance to watch: 2.1050–2.1100
Next Action: Wait for reaction at support before taking directionally biased trades
=================================================================
Disclosure: I am part of Trade Nation's Influencer program and receive a monthly fee for using their TradingView charts in my analysis.
=================================================================

GBPAUD Short From Resistance!
HI,Traders !
#GBPAUD went up sharply
Made a retest of the
Horizontal resistance level
Of 2.10010 from where we
Are already seeing a local
Bearish reaction so we
Are locally bearish biased
And we will be expecting
A local bearish correction !
Comment and subscribe to help us grow !

GBP-AUD Rising Support Ahead! Buy!
Hello,Traders!
GBP-AUD made a sharp
And sudden move down
And the pair is oversold
So after it retest the rising
Support line we will be
Expecting a local bullish
Correction and a move up
Buy!
Comment and subscribe to help us grow!
Check out other forecasts below too!
Disclosure: I am part of Trade Nation's Influencer program and receive a monthly fee for using their TradingView charts in my analysis.
GBPAUD start of long term weekly/monthly down trendHey people,
Following your sell entry citeria's all sells and holds are valid and highly favourable to the downside.

GBPAUD Technical Analysis! BUY!
My dear friends,
My technical analysis for GBPAUD is below:
The market is trading on 2.0742 pivot level.
Bias - Bullish
Technical Indicators: Both Super Trend & Pivot HL indicate a highly probable Bullish continuation.
Target - 2.0862
Recommended Stop Loss - 2.0677
About Used Indicators:
A pivot point is a technical analysis indicator, or calculations, used to determine the overall trend of the market over different time frames.
Disclosure: I am part of Trade Nation's Influencer program and receive a monthly fee for using their TradingView charts in my analysis.
———————————
WISH YOU ALL LUCK

GbpAud - Sell IdeaAccording to last week's traders' report, retail traders changed the number of positions, being bullish on GA.
In this way, institutions tend to move the price in the opposite direction
In technical terms, there has been a sweep of Equal Highs on the higher-timeframes and the price, after catching all this liquidity, has changed structures. In addition, it is trading below the 4H and 1H EMA, respecting consecutive imbalances.
Let's see how this trade goes.
You vs You

GBPAUD waiting for conditions to break out of the wide rangeGBPAUD found some buying momentum at the 2.085 support in today's trading session. In the long term, the pair's trading range is wide, extending from 2.102 to 2.067. A breakout of this range will form a new trend.
A BUY trading signal is confirmed when the pair breaks the resistance at 2.10200.
A SELL signal is confirmed when the pair breaks the support at 2.085.
📈 Key Levels
Support: 2.085 - 2.067
Resistance: 2.102 - 2.138

GBP/AUD Daily AnalysisPrice has found resistance at a price of 2.1000 for a number of days.
Mondays large bearish candle suggests that the price is still finding a ceiling at that price point.
This means that we could see some further selling.
If you agree with this analysis, look for a trading opportunity that meets your strategy rules.

BUY GBPAUDGBPAUD BUY @ 2,0888
Targeting 2,09836
Expecting a pump towards the buy side liquidity, from where price quickly declined. FVG can be applied here too.
GBPAUD FORMING A DOWNTREND STRUCTUREGBPAUD FORMING A DOWNTREND STRUCTURE IN 4H TIMEFRAME.
Market recently enter into new downtrend by forming a lower low.
Market is rejecting the price near the previous high which in important resistance level.
Price may start forming another primary trend and may remain bearish in upcoming sessions.
on lower side market may hit the targets of 2.06800 & 2.05500.
On higher side market may test the resistance level of 2.10330.

GBPAUD Seller take controlAfter a solid breakout, i'm expecting healthy retracement before continue downtrend.
Good Luck
GBP AUD bearishGBP AUD has a buy side liquidity above the equal highs, which is the DOL to pull liquidity high and most probably create high of the week, before the bearish move.
GBPAUD TRADE IDEA We're also looking at another trade idea on gbpaud.
The market is pulling back and we anticipate a pullback to our fib level before continuing on a buy trade
Let's see how the market unfolds and if we're gonna make profits or not.
TRADE IDEA UPDATE on this particular trade may not be dropped.

GBPAUD: Growth & Bullish Continuation
Balance of buyers and sellers on the GBPAUD pair, that is best felt when all the timeframes are analyzed properly is shifting in favor of the buyers, therefore is it only natural that we go long on the pair.
Disclosure: I am part of Trade Nation's Influencer program and receive a monthly fee for using their TradingView charts in my analysis.
❤️ Please, support our work with like & comment! ❤️

GBPAUD Will Go Higher! Buy!
Here is our detailed technical review for GBPAUD.
Time Frame: 2h
Current Trend: Bullish
Sentiment: Oversold (based on 7-period RSI)
Forecast: Bullish
The market is trading around a solid horizontal structure 2.098.
The above observations make me that the market will inevitably achieve 2.106 level.
P.S
Please, note that an oversold/overbought condition can last for a long time, and therefore being oversold/overbought doesn't mean a price rally will come soon, or at all.
Disclosure: I am part of Trade Nation's Influencer program and receive a monthly fee for using their TradingView charts in my analysis.
Like and subscribe and comment my ideas if you enjoy them!
GBP/AUD Falling Wedge Pattern – Reversal or Breakdown?The GBP/AUD pair is currently trading inside a well-defined falling channel on the 15-minute timeframe. The price has been making lower highs and lower lows, respecting both the descending resistance and support trendlines. This setup suggests a short-term bearish structure, but the most recent bounce from the lower boundary raises the possibility of a bullish reversal from support.
🔁 Key Technical Levels
Resistance Zone: Around 2.0995–2.1005 (top of the channel)
Support Zone: Around 2.0930–2.0940 (bottom of the channel)
🔼 Bullish Reversal Scenario
The pair recently bounced strongly from the support zone, indicating buying interest near the channel bottom. If the price breaks above the descending resistance line with a strong bullish candle and follow-through, it would suggest a breakout from the falling channel. That could open upside potential toward 2.1020–2.1050, especially if volume supports the move.
🔽 Bearish Continuation Scenario
If the resistance holds and price starts to fall again, the pair could continue the downward structure, retesting the 2.0940–2.0930 support. A breakdown below that level would confirm a bearish continuation with possible targets near 2.0900 or lower.
🎯 Trade Plan Outline
Buy Setup:
Entry: On confirmed breakout above resistance (~2.1005)
SL: Below 2.0980
TP: 2.1030 / 2.1050
Sell Setup:
Entry: On rejection at resistance or confirmed breakdown below 2.0930
SL: Above 2.1000
TP: 2.0910 / 2.0885
=================================================================
Disclosure: I am part of Trade Nation's Influencer program and receive a monthly fee for using their TradingView charts in my analysis.
=================================================================

GBPAUD sideways consolidation resistance at 2.1060The GBPAUD remains in a bullish trend, with recent price action showing signs of a corrective pullback within the broader uptrend.
Support Zone: 2.0880 – a key level from previous consolidation. Price is currently testing or approaching this level.
A bullish rebound from 2.0880 would confirm ongoing upside momentum, with potential targets at:
2.1060 – initial resistance
2.1160 – psychological and structural level
2.1290 – extended resistance on the longer-term chart
Bearish Scenario:
A confirmed break and daily close below 2.0880 would weaken the bullish outlook and suggest deeper downside risk toward:
2.0810 – minor support
2.0750 – stronger support and potential demand zone
Outlook:
Bullish bias remains intact while the GBPAUD holds above 2.0880. A sustained break below this level could shift momentum to the downside in the short term.
This communication is for informational purposes only and should not be viewed as any form of recommendation as to a particular course of action or as investment advice. It is not intended as an offer or solicitation for the purchase or sale of any financial instrument or as an official confirmation of any transaction. Opinions, estimates and assumptions expressed herein are made as of the date of this communication and are subject to change without notice. This communication has been prepared based upon information, including market prices, data and other information, believed to be reliable; however, Trade Nation does not warrant its completeness or accuracy. All market prices and market data contained in or attached to this communication are indicative and subject to change without notice.

GBPAUDPair created a double bottom on the daily as well as a buy zone on the weekly. Currently price coming down to test this zone where entries can be taken with appropriate stop losses. Target shown on chart