GBPCAD juicy very juicyThis is an A+ setup!!
Not perfect but clean.
I dont usually see a cup and handle a lot but this one certainly looks juicy.
SL behind the pivot, mmmhhh just juicy.
GBPCAD trade ideas

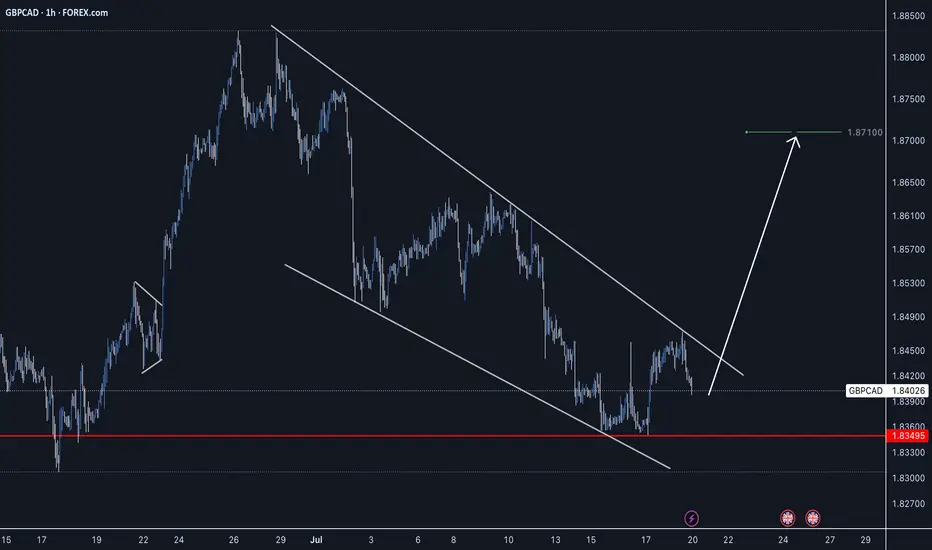
GBPCAD FORMING BEARISH FLAG PATTERNGBPCAD forming bearish trend in 1 hour time frame.
Market is forming lower low which shows indicates bearish trend.
Price is also forming Bearish flag pattern.
Market is expected to remain bearish in upcoming trading sessions.
On lower side market can hit the target levels of 1.84500 & 1.83200
On higher side market may test the resistance level of 1.87700

The GBPCAD is Unstoppable due to Strong Up TrendHello Traders
In This Chart GBPCAD HOURLY Forex Forecast By FOREX PLANET
today GBPCAD analysis 👆
🟢This Chart includes_ (GBPCAD market update)
🟢What is The Next Opportunity on GBPCAD Market
🟢how to Enter to the Valid Entry With Assurance Profit
This CHART is For Trader's that Want to Improve Their Technical Analysis Skills and Their Trading By Understanding How To Analyze The Market Using Multiple Timeframes and Understanding The Bigger Picture on the Chart

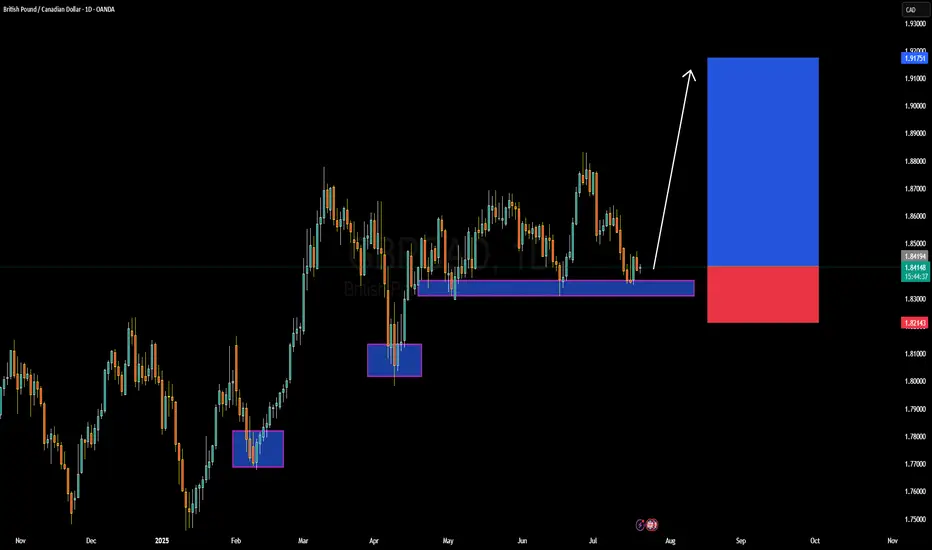
GBPCAD Forming Strong Bullish ReactionGBPCAD has once again tapped into a key daily demand zone that's held strong multiple times this year, forming a reliable support base around the 1.8200–1.8300 level. Price action has consistently respected this area, creating a clear bullish structure of higher lows following each test. The recent bounce indicates buyer interest is still strong, and I’ve entered long positions here with a high conviction that the bullish leg is about to resume. The risk-to-reward ratio on this setup is highly favorable, with upside potential targeting the 1.9150–1.9200 region.
From a macro perspective, the British pound remains supported by the Bank of England’s hawkish stance. Inflationary pressure in the UK remains sticky, keeping the door open for further rate hikes or at least prolonged tight monetary policy. On the flip side, the Canadian dollar is under slight pressure due to falling crude oil prices and the Bank of Canada's relatively more dovish outlook in recent statements, despite recent CPI upticks. This divergence in policy bias adds tailwind to the GBPCAD bullish bias.
Technically, this pair is respecting market structure with precision. Each bounce from the marked support zones has led to meaningful rallies, and current price behavior is following the same playbook. The consolidation over the past few sessions suggests accumulation, with a bullish breakout likely to follow. The marked blue target zone aligns with a clean price inefficiency and liquidity pool on the left side of the chart.
With momentum building and fundamental drivers favoring GBP strength, I expect a continuation move toward 1.9150 in the coming weeks. Patience and position management are key here, but the setup remains valid and in profit. Traders watching this zone should be alert for bullish confirmations and volume spikes to ride the next impulsive wave.
GBP/CAD Clarity in Motion! Levels Are Locked In Hey everyone 👋
📌 BUY LIMIT ORDER / GBP/CAD Key Levels
🟢 Entry: 1,83873
🎯 Target 1: 1,84104
🎯 Target 2: 1,84372
🎯 Target 3: 1,85040
🔴 Stop: 1,83316
📈 Risk/Reward Ratio: 2.18
I double-checked the levels and put together a clean, focused analysis just for you. Every single like seriously boosts my motivation to keep sharing 📈 Your support means the world to me!
Huge thanks to everyone who likes and backs this work 💙 Our goals are crystal clear, our strategy is solid. Let’s keep moving forward with confidence and smart execution!

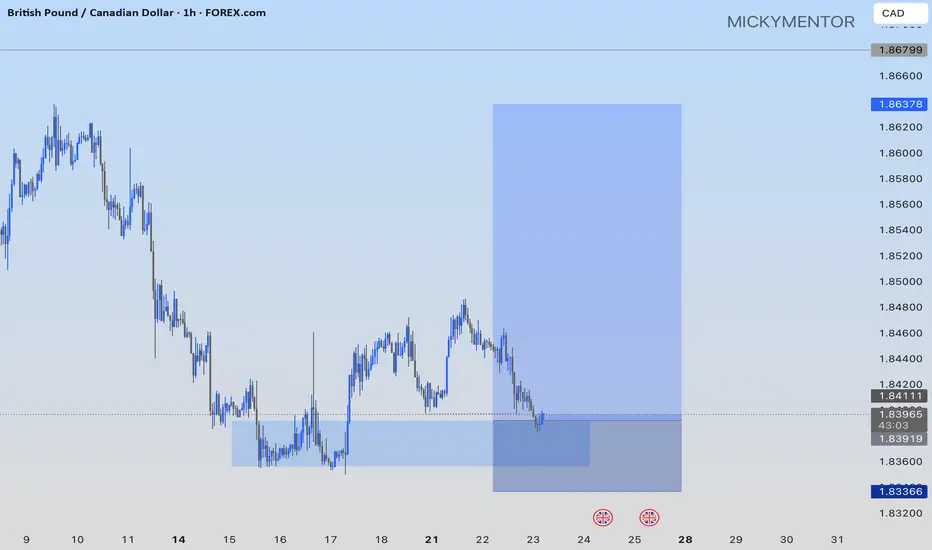
BUY GBPCADGBPCAD finally reaches an area of demand where we should see price steadily climb back to the resistance. We can expect some aggressive bullish moves from the pair.

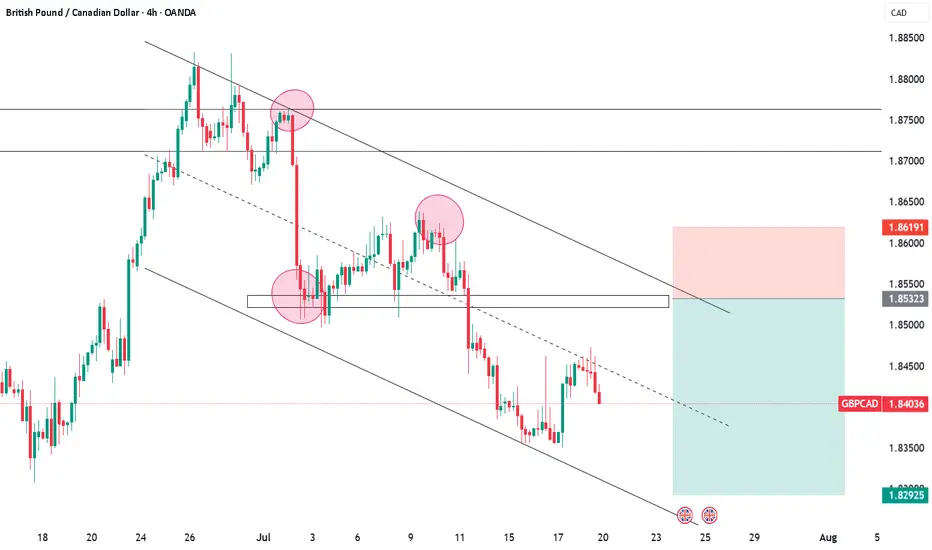
GBPCAD: I’M BUYING NOW!!!OANDA:GBPCAD I’m buying at the current market price with my target at 1.86378
SHORT in GBPCADHello Fellows,
I’m opening a SHORT position on GBPCAD, supported by the sustained downtrend we've been observing. This move is further reinforced by signs of economic slowdown in the UK, which could continue to weigh on the pound.

GBPCAD - Bullish ReversalGBPCAD has formed a double bottom with divergence and broken its lower high and trend line. There is a potential upside.

GBPCAD Bullish Set-upAfter an impulsive bullish move, price is currently in a corrective phase. It is approaching the Optimal Trade Entry (OTE) zone, which aligns with the 1-hour demand zone (bullish order block). This confluence of the Fibonacci 61.8%–85% retracement levels and the demand area suggests a potential bullish bounce and continuation toward the recent high.

GBPCAD Bearish Flag Breakout!
HI,Traders !
#GBPCAD is trading in a local
Downtrend and formed a bearish
Flag pattern and now we are
Seeing a bearish breakout
So we are bearish biased
And we will be expecting
A further bearish move down !
Comment and subscribe to help us grow !

GBPCAD Moving UpAs per our previous analysis GBPCAD has taken off. We can expect a reversal to breakeven point, do not hesitate to add more positions.

GBPCAD Is Very Bullish! Buy!
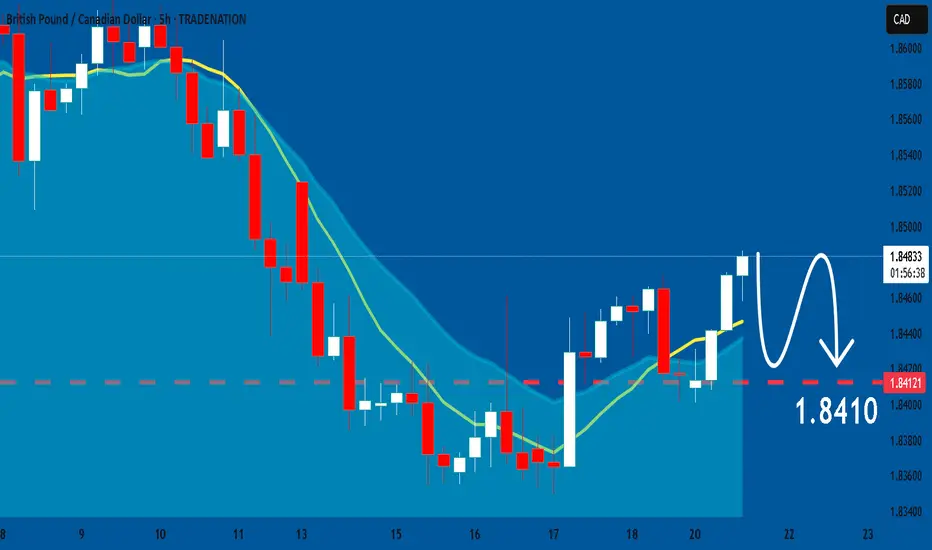
Please, check our technical outlook for GBPCAD.
Time Frame: 4h
Current Trend: Bullish
Sentiment: Oversold (based on 7-period RSI)
Forecast: Bullish
The market is approaching a significant support area 1.841.
The underlined horizontal cluster clearly indicates a highly probable bullish movement with target 1.848 level.
P.S
The term oversold refers to a condition where an asset has traded lower in price and has the potential for a price bounce.
Overbought refers to market scenarios where the instrument is traded considerably higher than its fair value. Overvaluation is caused by market sentiments when there is positive news.
Disclosure: I am part of Trade Nation's Influencer program and receive a monthly fee for using their TradingView charts in my analysis.
Like and subscribe and comment my ideas if you enjoy them!

SELL GBPCAD now for a 4h time frame bearish trend continuationSELL GBPCAD now for a four hour time frame bearish trend continuation..........
STOP LOSS: 1.8480
This sell trade setup is based on hidden bearish divergence trend continuation trading pattern...
Always remember, the trend is your friend, so whenever you can get a signal that the trend will continue, then good for you to be part of it
TAKE PROFIT : take profit will be when the trend comes to an end, feel from to send me a direct DM if you have any question about take profit or anything.
Remember to risk only what you are comfortable with….....trading with the trend, patient and good risk management is the key to success here

GBPCAD Long Setup - Clear Bullish Price ActionLooking for a breakout followed by a continuation for a long trade setup.
Good Luck
GBPCAD: Will Start Falling! Here is Why:
Remember that we can not, and should not impose our will on the market but rather listen to its whims and make profit by following it. And thus shall be done today on the GBPCAD pair which is likely to be pushed down by the bears so we will sell!
Disclosure: I am part of Trade Nation's Influencer program and receive a monthly fee for using their TradingView charts in my analysis.
❤️ Please, support our work with like & comment! ❤️
GBP/CAD BULLS ARE GAINING STRENGTH|LONG
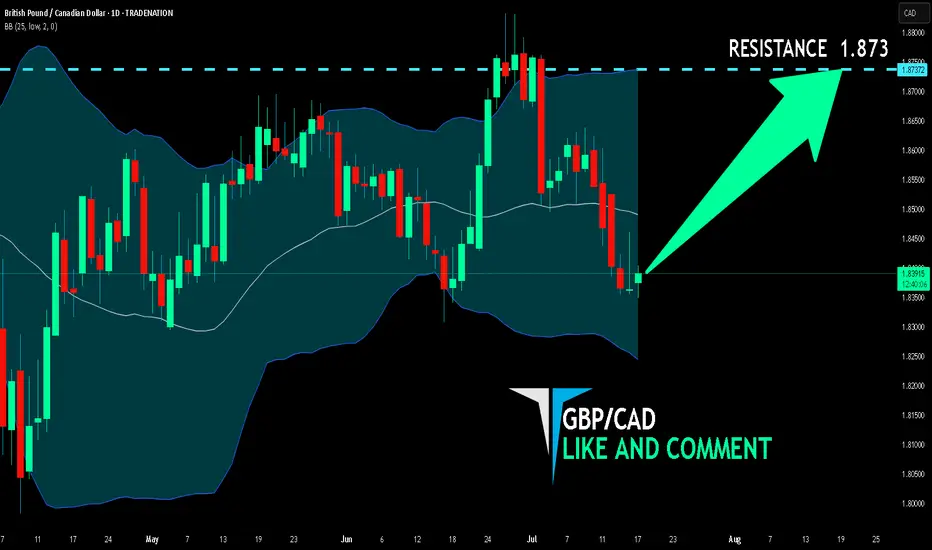
Hello, Friends!
We are now examining the GBP/CAD pair and we can see that the pair is going down locally while also being in a downtrend on the 1W TF. But there is also a powerful signal from the BB lower band being nearby indicating that the pair is oversold so we can go long from the support line below and a target at 1.873 level.
Disclosure: I am part of Trade Nation's Influencer program and receive a monthly fee for using their TradingView charts in my analysis.
✅LIKE AND COMMENT MY IDEAS✅
LONG ON GBP/CADGBP/CAD is now at a major key area/demand zone after completing its pullback phase.
I expect price to now rise to the next level of supply or previous high.
looking to catch 200-400 pips throughout the week.

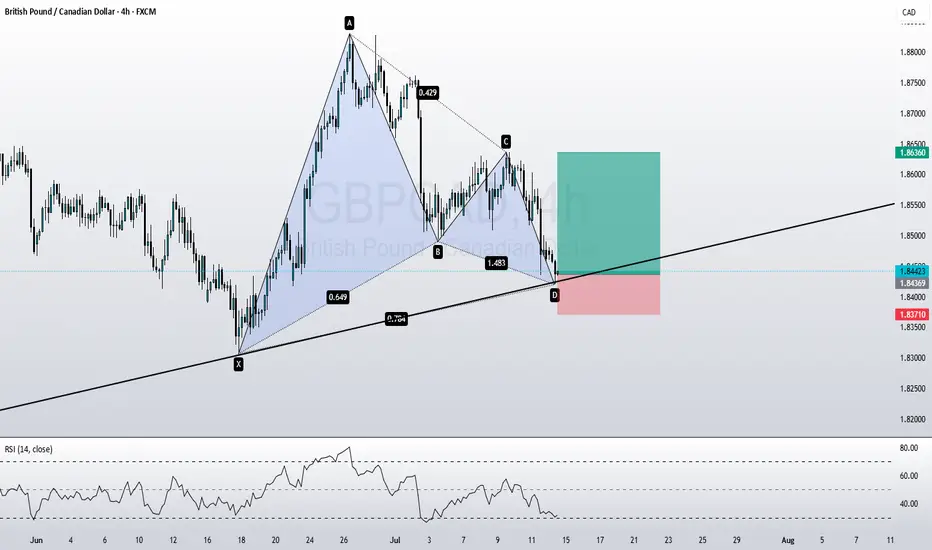
GBPCAD longOn the GBPCAD chart, we have a bullish Gartley harmonic pattern that aligns with an upward trendline. I expect the price to move to the upside.
GBPCAD SHORTMarket structure bearish on HTFs DW
Entry at both Weekly and Daily AOi
Weekly Rejection at AOi
Previous Weekly Structure Point
Daily Rejection at AOi
Daily EMA retest
Around Psychological Level 1.85000
H4 Candlestick rejection
Levels 5.3
Entry 90%
REMEMBER : Trading is a Game Of Probability
: Manage Your Risk
: Be Patient
: Every Moment Is Unique
: Rinse, Wash, Repeat!
: Christ is King.

GBPCAD--BUY4h timeframe
--break of descending line (orange line)
--BUY at level around 1.84350
--TP is at upper line of ascending channel

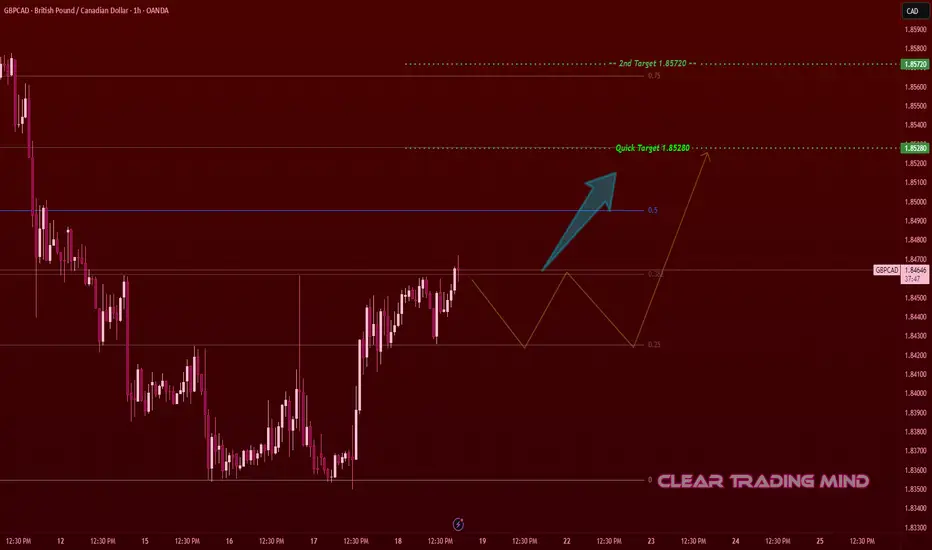
GBPCAD Showing Strength – Breakout Setup with Measured TargetsThis is my personal setup for GBPCAD on the 1-hour chart. After a strong downtrend, the price has started to form a bullish reversal pattern from the 1.83600 zone. I’m watching the current bullish structure which is showing good strength and higher lows.
🔹 Entry Idea:
I’m planning to enter above 1.84700, once price confirms a breakout and retest. This level also aligns with the 0.382 Fibonacci level.
🔹 Targets & PIPs:
🎯 First Target: 1.85280 (≈ 58 pips from entry)
🎯 Second Target: 1.85720 (≈ 102 pips from entry)
🔹 Reasoning:
- Price bounced from the 1.83600 support zone
- Forming bullish structure (higher highs & higher lows)
- Nearing Fibonacci midpoint resistance
- Increasing volume indicates potential buyers stepping in
This is my personal trade idea – not financial advice. Let’s see if price follows the plan!