Sell GBPCADThe Canadian seems to be picking up strength again after Trump’S announcement of tarrifs which made it tank earlier in the week. New CAD and momentum coupled with exhaustion of the GBP makes for a nice bearish move.
GBPCAD trade ideas
GBPCAD Double Top/CorrectionGBPCAD I have been watching closely for a pull back over the past month. It has been on a brutal climb. I think given the current chart patterns we have a strong potential to double top at our current location. Risk is low and potential for profit is high.
Best Of luck! Trade safe and protect your capital :)

GBPCAD - ShortGBPCAD has formed double top divergence.
Entry is at the break of HL.
If price crosses down HL, sellers will be in control.

GBP/CAD Currency Pair – Technical AnalysisBullish Scenario:
The GBP/CAD currency pair maintains a bullish outlook, supported by the prevailing longer-term uptrend. The recent intraday price action indicates a period of sideways consolidation near the rising support trendline. The key level to watch is 1.8356, which aligns with both the previous consolidation range and the trendline support. A corrective pullback that finds support at 1.8356, followed by a bullish rebound, could drive the pair higher toward 1.8500, with extended upside targets at 1.8550 and 1.8600 over the longer timeframe.
Bearish Scenario:
A confirmed breakdown below 1.8356, particularly with a daily close beneath this level, would invalidate the bullish outlook. This could lead to a deeper retracement, exposing support at 1.8330, with further downside potential toward 1.8300, signaling a shift in momentum.
Conclusion:
The overall trend remains bullish, but 1.8356 is a critical level for confirmation. Holding above this level strengthens upside potential, while a decisive break below it could open the door for further downside correction. Traders should closely monitor price action around this key support zone to determine the next directional move.
This communication is for informational purposes only and should not be viewed as any form of recommendation as to a particular course of action or as investment advice. It is not intended as an offer or solicitation for the purchase or sale of any financial instrument or as an official confirmation of any transaction. Opinions, estimates and assumptions expressed herein are made as of the date of this communication and are subject to change without notice. This communication has been prepared based upon information, including market prices, data and other information, believed to be reliable; however, Trade Nation does not warrant its completeness or accuracy. All market prices and market data contained in or attached to this communication are indicative and subject to change without notice.

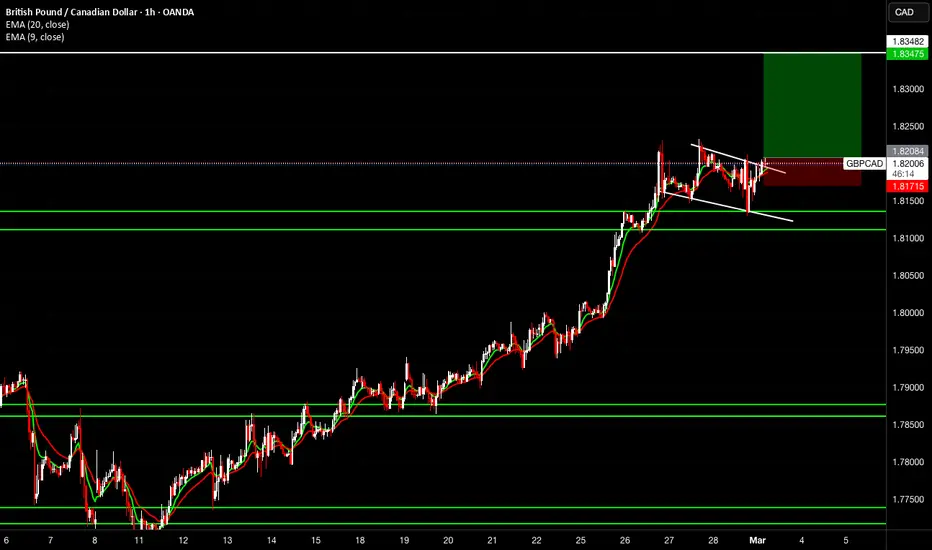
GBPCAD: Bullish Momentum Expected to ContinueThe 📈GBPCAD pair remains in a strong bullish trend, with the breakout of a key resistance level confirming further upside potential.
On the hourly chart, an ascending triangle pattern is forming following a recent test.
The price is likely to continue rising, potentially reaching at least 1.8552.

GBPCAD: Bullish Rally is Going to ContinueThe 📈GBPCAD pair is still experiencing a strong bullish trend, with the breaking of a significant resistance level serving as a bullish indicator.
On the hourly chart, there appears to be an ascending triangle pattern forming after a recent test.
It is likely that the price will continue to increase and potentially reach a minimum of 1.8552.

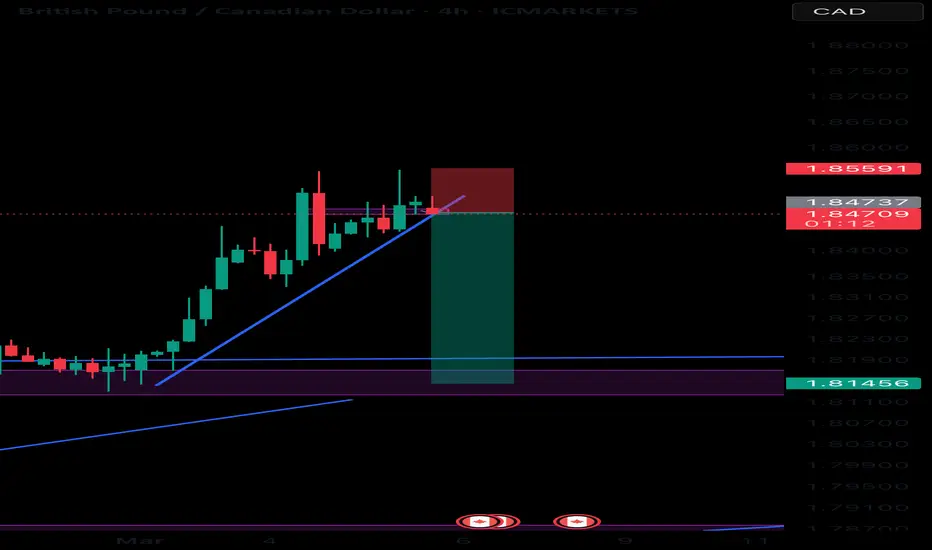
GBPCAD-SELL strategy 6 Hourly KAGI chartOne can observe how well the pair has moved higher within the regression channel. we are near the top-end of the channel now and an overbought state, suggest we should a return mid-regression channel levels around 1.8200 handle.
Strategy SELL current levels 1.8450-1.8475 and take profit near 1.8217 for now.


GBPCAD-BULLISH IDEAGBPCAD is in a bull run as it diluted its previous bearish divergence and printed new HH and HL so,tske a entry on its 0.5% retracement at trendlind.

GBP/CAD Analysis – Key Levels & Trade Scenarios📊 Timeframe: Weekly (1W) | Current Price: ~1.8391
📈 Bullish Context:
Resistance at 1.8391:
Price is testing a strong supply zone (dark red area).
A breakout above this level could open the door to further upside.
Support at 1.8233 & 1.7677:
1.8233: Short-term support where buyers have stepped in.
1.7677: Major support level, previously tested multiple times.
📉 Current Outlook:
Price has aggressively moved up, breaking through previous resistances.
Approaching a critical resistance area, where rejection is possible.
If a rejection occurs, a retracement toward 1.8233 or 1.7677 could be seen.
📈 Trade Setups:
🔼 Long (Breakout Play):
Entry: Above 1.8400 with confirmation.
Target 1: 1.8600
Target 2: 1.8800
Stop Loss: Below 1.8230 to avoid fakeouts.
🔻 Short (Rejection Scenario):
Entry: Bearish rejection from 1.8391 with confirmation.
Target 1: 1.8233
Target 2: 1.7677
Stop Loss: Above 1.8450.
📌 Final Thoughts:
GBP/CAD is at a critical resistance; a breakout could lead to new highs.
A rejection would confirm a pullback toward support levels.
Key macroeconomic data may impact momentum and direction.


GBPCAD’s Bullish Surge: What’s Next? 💹 The GBPCAD has been in a strong bullish trend, reaching into previous highs on the daily timeframe—a key liquidity zone! 💰 This is a crucial area where smart money may take profits or induce a retracement before the next move.
📉 Given that price is currently overextended, I’m not looking to buy at these highs. Instead, I’ll be watching for a potential pullback into an unresolved imbalance, where we could see a high-probability long setup—if price action confirms the move. 🧐
💡 Patience is key in trading. Chasing price at extreme levels often leads to significant losses. I’ll be waiting for the right conditions to align before looking for an opportunity.
⚠️ Not financial advice. Always trade responsibly!
📊 Let me know your thoughts in the comments below.. 👇

GBPCADBroke out of my H4 resistance and retested. If H1 bullish flag holds then we can see buys this week
GBPCAD is in the bearish direction
Hello Traders
In This Chart gbpcad HOURLY Forex Forecast By FOREX PLANET
today GBPCAD analysis 👆
🟢This Chart includes_ (GBPCAD market update)
🟢What is The Next Opportunity on GBPCAD Market
🟢how to Enter to the Valid Entry With Assurance Profit
This CHART is For Trader's that Want to Improve Their Technical Analysis Skills and Their Trading By Understanding How To Analyze The Market Using Multiple Timeframes and Understanding The Bigger Picture on the Chart

GBPCAD PRINTING REVERSAL Technically:
GBPCAD is printing double top
GBPCAD is printing bearish divergence
GXY is bearish
CXY is bullish

GBP/CAD Long SwingGbp/Cad is trading currently at significant resistance level. Many traders are expecting price to drop from here and sentiment is on downside. But looking at current priceaction and fundamentals connected to canadian dollar. I personaly expect prices to go higher from here. First target are highs from May 2018.
Looking on monthly and weekly timeframes we can cleary see momentum to upside and during last two weeks there has been only buying and no selling, plus looking on latest COT reports institutions are heavly selling CAD. If this level holds it's a good sign for more upside.

GBPCAD is BearishPrice was in a strong uptrend, however a bearish divergence on hourly time frame hints the return of bears. If previous higher low is broken successfully then we can expect a bearish reversal as per Dow theory. Targets are mentioned on the chart.

GBP/CAD BEARS ARE GAINING STRENGTH|SHORT
Hello, Friends!
Previous week’s green candle means that for us the GBP/CAD pair is in the uptrend. And the current movement leg was also up but the resistance line will be hit soon and upper BB band proximity will signal an overbought condition so we will go for a counter-trend short trade with the target being at 1.799.
✅LIKE AND COMMENT MY IDEAS✅

GBPCAD sell stopGBPCAD is making higher Highs and higher lows. It is in up trend. Now it formed divergence with making double Top pattern. Place sell stop below HL.

#041 Trust The Process GBPCAD Buy 1406SGT 28022025Buying in an up channel, at the support area of the up channel.
I have nothing much to say.
I am tired.
Wasting time with my father. Hand in hand.
1407SGT 28022025
Do not copy my trades. I'm not selfish, I am protecting you. Just take my trades as a reference.

GBPCAD shortGBP/CAD is in a ranging market, and yesterday we received a strong confirmation at the resistance level—a tweezer top, which is a powerful reversal signal. This, combined with the resistance level and the current price position, strengthens the setup.
Additionally, the Risk Reward Ratio (RRR) is very attractive, providing yet another reason to pull the trigger.
Jeffrey Gomes Lopes

GBPCAD - ShortPrice has formed double top divergence.
At the breakout of HL, sellers will be in control.
Entry is at the break of HL.

GBPCAD-TREND REVERSALgbpcad seems to be change its trend to bearish as it has made double top with a bearish divergence at daily resistence.
