SellPrice is approaching kur daily supply zone we will look for confirmation in lower time frame and zell to our daily demand zone and bug if possible.
GBPCHF.P trade ideas

GBPCHF: Range BreakoutThis range breakout follows the same pattern as my other idea on CADCHF. In a very similar fashion, price has been in a range since September 2024.
The upper range boundary has shown signs of weakening or breaching a couple of times over the past few months. However, price recently closed above this range level over the past two days, which indicates a higher probability of sustained breakout.
The daily ATR is currently 64.3 pips. This sets my trading parameters at TP 32 and SL 64. Note that I'm only targeting 0.5x ATR because I scale into positions, but I also want to ensure I'm able to secure a profit with minimal holding costs.

GBPCHF about to drop for 125 pipsBased on my algorithms, data and statistics, GBPCHF is about to drop for more than 125 pips

GBPCHF FOR SCALPERS AND DAY TRADERS **3900 POINTS **Entry price ,stoploss and Target already marked in the chart itself FYI.
Guys pls like, share and follow my ideas .
Thank You All

GBPCHF in Range Trading Movement: Top-Down Analysis!GBP/CHF in Range Trading Movement: Top-Down Analysis
In this video, I explained the trading opportunities the GBP/CHF pair is showing. GBPCHF is seen from a multi-timeframe perspective.
I have identified key targets, ensuring there's something for every trader.
You may watch the video for further details!
Thank you and Good Luck!
❤️PS: Please support with a like or comment if you find this analysis useful for your trading day❤️
Disclosure: I am part of Trade Nation's Influencer program and receive a monthly fee for using their TradingView charts in my analysis.


GBPCHF APPROACHES A MAJOR RESISTANCE LEVEL. WHAT NEXT?Price just approached a major resistance level. What’s the next major move the market will make?
This question is yet to be answered until we get a clear view of the market but from technical standpoint , we’d be looking forward to seeing sellers step in again since we’re at the sellers zone.
Tomorrow we have GDP report coming, we’d be waiting to see the outcome of the news to help me make informed decision.

GBPCHF Approaching Key Resistance: Will Sellers Target 1.12630?OANDA:GBPCHF is approaching a significant resistance zone, marked by prior strong price rejections and selling pressure. This area has historically acted as a strong supply zone, suggesting the potential for a bearish reversal if sellers step in.
The current market structure indicates that if the price confirms rejection within this zone, we could see a move downward toward the 1.12630 level. This target aligns with the broader range-bound behavior observed in the pair.
Traders should monitor for bearish confirmation signals, such as bearish engulfing candles or strong rejection wicks, to validate potential short positions.

GBPCHF SHORT Market structure bearish on HTFs DW
Entry at both Weekly and Daily AOi
Weekly Rejection At AOi
Previous Weekly Structure Point
Daily Rejection At AOi
Previous Daily Structure Point
Around Psychological Level 1.13000
H4 Candlestick rejection
Levels 9.01
Entry 95%
REMEMBER : Trading is a Game Of Probability
: Manage Your Risk
: Be Patient
: Every Moment Is Unique
: Rinse, Wash, Repeat!
: Christ is King.

GBPCHF SellHi guys. What I'm seeing is a down trend forming on a 4H chart also combining it with a very strong supply zone that the market has been rising to. I already have my entry point at 1.13416 and stop loss at 1.13796. Please tell me what you think and good luck if you are going to take the setup with me.

GBPCHFIs near strong supply zone and we show as rejection from this zone now if is come back and show as other confirmation we take it short to next demand zone
LR

GBPCHF Ready for a breakthroughHello Traders
In This Chart GBPCHF HOURLY Forex Forecast By FOREX PLANET
today GBPCHF analysis 👆
🟢This Chart includes_ (GBPCHF market update)
🟢What is The Next Opportunity on GBPCHF Market
🟢how to Enter to the Valid Entry With Assurance Profit
This CHART is For Trader's that Want to Improve Their Technical Analysis Skills and Their Trading By Understanding How To Analyze The Market Using Multiple Timeframes and Understanding The Bigger Picture on the Charts

GBPCHF Sell structureWe can observe that GBPCHF is in the selling structural range. Prices has previously failed to make HH and now giving a continuation move to complete the range.

GBPCHF: Swing Trading & Technical Analysis
Remember that we can not, and should not impose our will on the market but rather listen to its whims and make profit by following it. And thus shall be done today on the GBPCHF pair which is likely to be pushed down by the bears so we will sell!
❤️ Please, support our work with like & comment! ❤️

Trading Recaps & LessonsHey,
In this video I share the charts of GBP/CAD and GBP/CHF.
As explained in prior video's our mechanical trading plan is always the same.
This video helps you understand how to execute it in action.
But I recommend watching our other video's as well.
The trades are verified, as most educators sadly never do, which is a large problem in this industry and holds many traders back.
Kind regards,
Max Nieveld

Great set up but i dont trade this pairGreat set up with a nice heat and shoulders on H4 time frame. I have never traded thois pair but it is bearish with a great drop.

GBPCHFThe GBP/CHF currency pair represents the exchange rate between the British Pound Sterling (GBP) and the Swiss Franc (CHF). This pair is often influenced by economic indicators from both the UK and Switzerland, such as interest rate decisions, GDP growth, and political developments. The Swiss Franc is considered a safe-haven currency, often gaining strength during periods of global uncertainty, while the Pound tends to be more sensitive to Brexit-related news, UK monetary policy, and economic performance. Traders often watch this pair for volatility during key economic events from both countries.

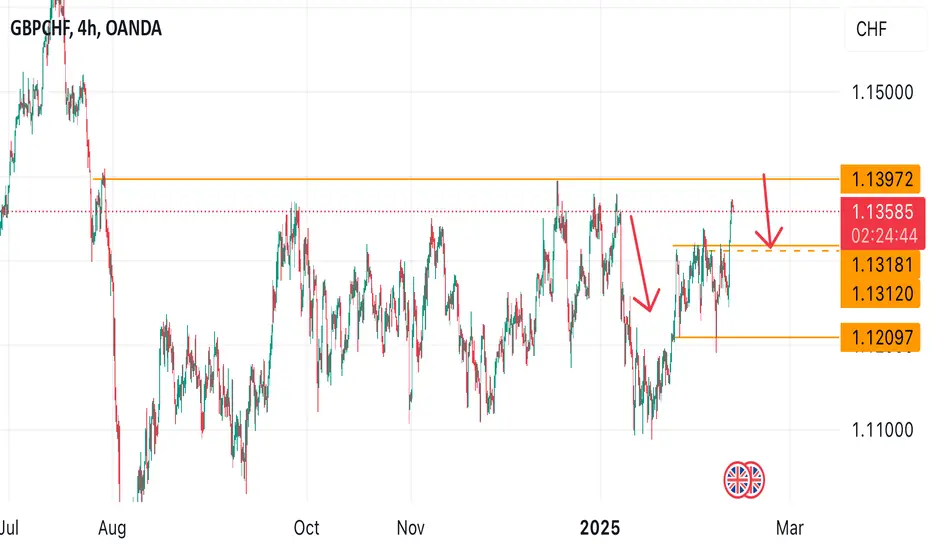
GBPCHF sell signal at support GBP/CHF appears to be losing steam despite the recent bullish run, hinting at a possible top. I’m looking to sell around 1.1315, which aligns with bespoke resistance and yesterday’s high. My first target is 1.1270, followed by 1.1242. If the pair rallies into 1.1315 and stalls, it should confirm the setup—otherwise, I’ll reassess. For now, I’m favoring short entries on rallies in anticipation of a turnaround.
Our last signal on this pair was 74 pips of profits

gbpchf sell tradeThe Relative Strength Index (RSI) is showing a downward trend, indicating weakening momentum. Additionally, the Moving Average Convergence Divergence (MACD) is showing a bearish crossover, further supporting the potential for a downward move

Continuation of the sell projection I missed my first sell projection, price didn't tag me in at 1.13159 hence I'll be trying the re-entry for the sell continuation at 1.12847
Kindly boost if you find this insightful 🫴

GBPCHF Possible Sell move.Price on a downtrend , BOS on the 4hr, creating a supply zone on 1hr. Price retraced to the supply zone for sell continuation.
Risk Management very important

GBPCHFThe way market had to turn around from downtrend to uptrend gave me a clue that i should jump in saw too much liquidity so market its generated by LQ. nice view in this structure i be really be patient for my set up.
#comingforyou
