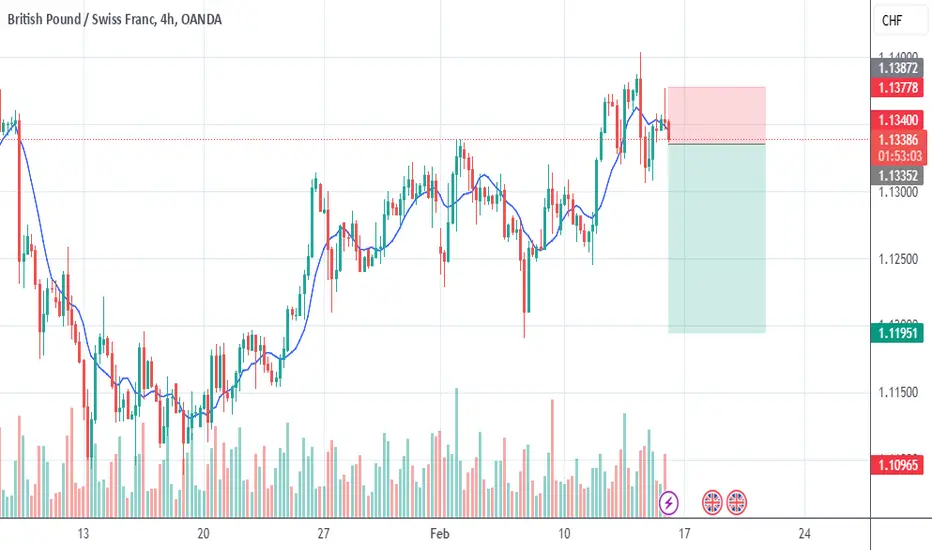
THOUGHTS ON GBP/CHFGBP/CHF 4H - Price is quite evidently bullish on the higher timeframes and therefore has given us the bias to buy into this market, I have gone ahead and found an area of Demand for price to pullback down and into.
We want to see price come and correct itself, trading us lower in the market, this will give us the ability to capitalise in long positions and trade along side the prevailing trend.
Because we have an area of Demand marked out we are able to get involved with a refined entry will give us better RR odds on the trades we do place. You can see the higher timeframe low set to the left of our screen, that was to clear orders.
Seeing price show weakness to the upside here gives me the confluence to suggest that price is going to put in this fractal correction so I feel this trade set up will be ready to execute in the coming days.
GBPCHF.P trade ideas

GBPCHF - Long active !!Hello traders!
‼️ This is my perspective on GBPCHF.
Technical analysis: Here we are in a bullish market structure from 4H timeframe perspective, so I expect bullish price action after price filled almost all the imbalance and rejected from bullish trendline + institutional big figure 1.13000. Also we have hidden divergence for buy.
Like, comment and subscribe to be in touch with my content!

GBPCHF Bullish Continuation - Targeting 1.13980OANDA:GBPCHF remains within a well-defined ascending channel, with price pulling back toward a key demand zone near 1.13600. This level aligns with the lower boundary of the channel, making it a critical area to watch. If buyers step in, we could see a bullish continuation toward 1.13980 and potentially higher.
However, if sellers break below this key zone, the structure could weaken, opening the door for further downside.

GBPCHF resistance at 1.1425 swing highThe GBPCHF currency pair price action sentiment appears neutral, supported by the longer-term prevailing sideways consolidation price range.
The key trading level is at 1.1425, current swing high. An overbought pullback from the current levels and a bearish rejection from the 1.1425 level could target the downside support at 1.1310 followed by 1.1245 and 1.1165 levels over the longer timeframe.
Alternatively, a confirmed breakout above 1.1425 resistance and a daily close above that level would change the outlook to bullish opening the way for further rallies higher and a retest of 1.1450 resistance followed by 1.1470 and 1.1500 levels.
This communication is for informational purposes only and should not be viewed as any form of recommendation as to a particular course of action or as investment advice. It is not intended as an offer or solicitation for the purchase or sale of any financial instrument or as an official confirmation of any transaction. Opinions, estimates and assumptions expressed herein are made as of the date of this communication and are subject to change without notice. This communication has been prepared based upon information, including market prices, data and other information, believed to be reliable; however, Trade Nation does not warrant its completeness or accuracy. All market prices and market data contained in or attached to this communication are indicative and subject to change without notice.

GBPCHF FORECASTThis pair guys has reached the higher timeframe value area! And it is where I was looking for the price to go and grab volume. Price has reached that potential area with clear structures, adding the probability for this trade to play out. Let's look this with a close eye and see how price is going to play out

GBPCHF: Bullish Trap & Pullback 🇬🇧🇨🇭
GBPCHF formed a confirmed bullish trap after a test
of a key horizontal resistance on an hourly.
I expect a retracement at least to 1.1384
❤️Please, support my work with like, thank you!❤️


GBPCHF ENTRY CHARTWe are BEARISH on this Pair, first the CHF is Strong,also the POUND is showing a sign of weakness, but on the GBPCHF chart, we have a SHIFT in TREND to the DOWNSIDE, we also have some confluences as that area is hitting the dynamic resistance+BB , while it mid-term is still BEARISH, We saw our LTF confirmation and decided to take the Trade, IF this matches with ypur TRADE IDEA, you can join us too, Update will be shared in the comment/update sections. THANK YOU.

GBPCHF is in the Selling from ResistanceHello Traders
In This Chart GBPCHF HOURLY Forex Forecast By FOREX PLANET
today GBPCHF analysis 👆
🟢This Chart includes_ (GBPCHF market update)
🟢What is The Next Opportunity on GBPCHF Market
🟢how to Enter to the Valid Entry With Assurance Profit
This CHART is For Trader's that Want to Improve Their Technical Analysis Skills and Their Trading By Understanding How To Analyze The Market Using Multiple Timeframes and Understanding The Bigger Picture on the Charts

GBPCHF LongRetail sentiment is 85% short for this pair. Key resistance level. Planning on a potential breakout from this price. Should see a nice close above the resistance zone if it does break.

GBP/CHFOn Daily,
This pair is going sideway for months. However, any time it reached the upper side of the box, it bounced back down. It seems Sellers are pretty strpong at that point.
On 1H chaart,
we can clearly notice a sharp "V" formation with a nice presize neck. (blue lines).
the target for bearish move can be around 1.12500.

GBPCHF - Head and Shoulders SetupHello traders,
On the daily timeframe GBPCHF has been consolidating in a range. Now it is at the resistance level of the range and so we should be looking for shorting opportunities.
On the lower timeframes, the 4H and 2H, it has formed a head and shoulders pattern which is a great reversal pattern.
Add to this the RSI divergence which in many occasions foreshadows the change in trend.
I will be entering when we get a close below the neckline on the 2H timeframe.


GBP correlation upAs the correlation for GBP is Up higer the chances for market to go up on the respected pairs

GBPCHF sideways consolidation The Week Ahead 17th Feb 25The GBPCHF currency pair price action sentiment appears neutral, supported by the longer-term prevailing sideways consolidation price range.
The key trading level is at 1.1290, 200 Day Moving Average level. An overbought pullback from the current levels and a bearish rejection from the 1.1290 level could target the downside support at 1.1190 followed by 1.1130 and 1.1080 levels over the longer timeframe.
Alternatively, a confirmed breakout above 1.1375 resistance and a daily close above that level would change the outlook to bullish opening the way for further rallies higher and a retest of 1.1420 resistance followed by 1.1470 and 1.1550 levels.
This communication is for informational purposes only and should not be viewed as any form of recommendation as to a particular course of action or as investment advice. It is not intended as an offer or solicitation for the purchase or sale of any financial instrument or as an official confirmation of any transaction. Opinions, estimates and assumptions expressed herein are made as of the date of this communication and are subject to change without notice. This communication has been prepared based upon information, including market prices, data and other information, believed to be reliable; however, Trade Nation does not warrant its completeness or accuracy. All market prices and market data contained in or attached to this communication are indicative and subject to change without notice.

GBP/CHF Short Setup📉 GBP/CHF Short Setup
🔻 Analysis:
GBP/CHF is facing selling pressure after failing to sustain above a key resistance level. A bearish structure is developing, suggesting a potential short opportunity.
📊 Technical Factors:
Bearish Confirmation: Lower highs & rejection from resistance
Momentum: Weak bullish continuation, indicating seller dominance
📌 Confirmation Signals:
Bearish candlestick patterns (e.g., engulfing, pin bar)
Bearish divergence in RSI/MACD
Break below key support level
🚨 Risk Management: Stick to proper risk-reward ratios and manage your position size accordingly.
📢 What’s your outlook on GBP/CHF? Share your thoughts in the comments! 👇
🔔 Follow for more trade setups!

GBPCHF SELL1.4h
2.upt
3.support
4.double bottom/ retest zone
5.rsi39/sto7/volbullish
6.
7.Fibextat zone
8.fibretrac above
9.
10.
11.
12.
13.beariah engulfing/morning star/
14.bullish
1.2h
2.upt
3.support
4.double bottom/
5.rsi28/sto7/volbearish
6.
7.finextat the zone
8.fibretrac at the zone
9.
10.
11.
12.bullish divergence/
13.tweerzer bottom/
14.bullish
1.1h
2.dnt
3.support
4.double bottom
5.rsi21/sto5/volbullish
6
7.fib above
8.Fib above
9.
10.
11.
12.bullish divergence
13bhllush engulfing
14. Bullish

SHORT ON GBP/CHFNice Market structure change from up to down on GBP/CHF
I am selling to the next level of support.

GBPCHF Ready for a breakthroughHello Traders
In This Chart GBPCHF HOURLY Forex Forecast By FOREX PLANET
today GBPCHF analysis 👆
🟢This Chart includes_ (GBPCHF market update)
🟢What is The Next Opportunity on GBPCHF Market
🟢how to Enter to the Valid Entry With Assurance Profit
This CHART is For Trader's that Want to Improve Their Technical Analysis Skills and Their Trading By Understanding How To Analyze The Market Using Multiple Timeframes and Understanding The Bigger Picture on the Charts

gbpchf sell tradeThe Relative Strength Index (RSI) is showing a downward trend, indicating weakening momentum. Additionally, the Moving Average Convergence Divergence (MACD) is showing a bearish crossover, further supporting the potential for a downward move
GBPCHF new bullish expectations
OANDA:GBPCHF trend based analysis, we are have CHANNEL pattern which is be breaked, price is make strong bullish push, at end now we are on new trend.
Price is in zone, its bounce few times, CHF showing self with many the weakest, on some other pairs can see bullish confirmations, here expect same soon confirm and new bullish push.
SUP zone: 1.12500
RES zone: 1.13500, 1.14000

GBPCHF Wave Analysis – 13 February 2025
- GBPCHF reversed from the resistance zone
- Likely to fall to support level 1.1240
GBPCHF currency pair recently reversed from the resistance zone between the powerful resistance level 1.1360, (which stopped multiple upward waves from September) and the upper daily Bollinger Band.
The downward reversal from this resistance area created the daily Doji candlesticks pattern, which stopped the previous short-term ABC correction ii from the start of January.
Given the strength of the resistance level 1.1360 and the overbought daily Stochastic, GBPCHF currency pair can be expected to fall to the next support level 1.1240.

GBPCHF 4 h price moving inside the Ascending ChannelGBP/CHF – 4H Chart Analysis (Feb 13, 2025)
📊 Market Structure:
Ascending Channel: Price is trading within a well-defined upward-sloping channel, indicating a bullish trend.
Parallel Support Zone (~1.1310 - 1.1330): This area has acted as both resistance and support in the past, making it a key level to watch.
🔑 Key Levels:
Resistance: ~1.1400+ (upper boundary of the channel)
Support: ~1.1310-1.1330 (parallel support)
Trendline Support: ~1.1260-1.1270 (lower channel boundary)
📈 Bullish Scenario:
If price holds above 1.1330, we could see a push toward the 1.1400+ resistance.
A breakout above the ascending channel could open room for further upside continuation.
📉 Bearish Scenario:
If price breaks below 1.1310, we may see a drop toward the lower channel boundary (~1.1260-1.1270).
A breakdown of the channel could shift momentum bearish, targeting 1.1200 as the next key level.
📌 Conclusion: GBP/CHF remains bullish as long as it stays within the channel. Watch for a potential bounce at support or a breakout above resistance for further upside! 🚀
