GBP/CHF For Bullishwait for pull-back near by entry point and then go long
general trend is up trend
have fun :)
GBPCHF trade ideas

GBPCHF is about to explode???We are about to hit this strong daily resistance, and we have already seen a similar move.
If I'm correct, we will have a 10:1 ratio
GBP/CHF Break & Retest – Bullish Continuation Setup (4H)Price has broken above a key structure level around 1.1155–1.1160, forming a higher high in line with the prevailing 4H uptrend. I’m watching for a clean retest of this zone with a rejection confirmation (preferably wick rejection or bullish engulfing) to take a long position.
Confluences:
• EMA 20/50 bullish alignment
• Break & retest of previous resistance turned support
• Bullish market structure (HHs, HLs)
Target: 1.13100
Invalidation: Break and close below the retest zone
Waiting for price to come to me — no early entries.

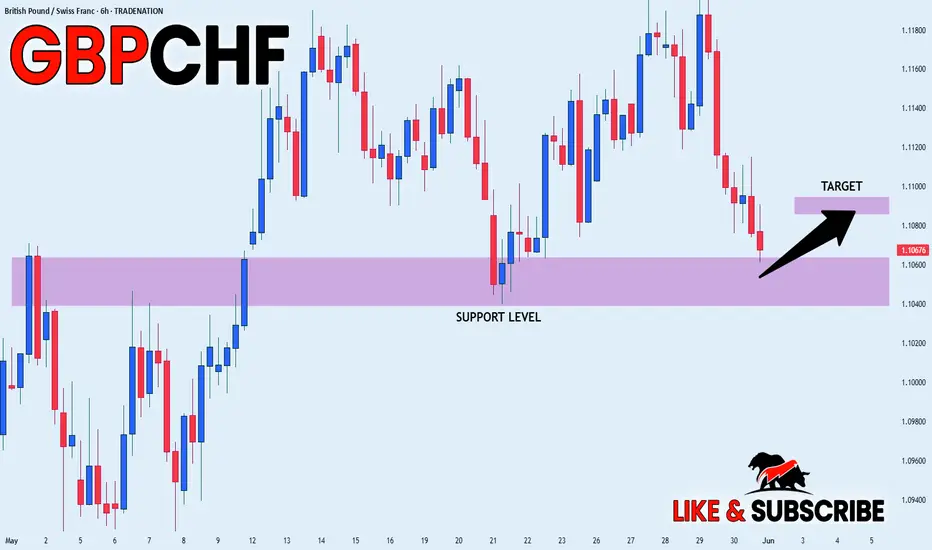
GBP_CHF POTENTIAL LONG|
✅GBP_CHF is going down now
But a strong support level is ahead at 1.1051
Thus I am expecting a rebound
And a move up towards the target of 1.1088
LONG🚀
✅Like and subscribe to never miss a new idea!✅
Disclosure: I am part of Trade Nation's Influencer program and receive a monthly fee for using their TradingView charts in my analysis.
Bullish momentum to extend?GBP/CHF has bounced off the pivot, which is a pullback support and could bounce to the 1st resistance.
Pivot: 1.1076
1st Support: 1.0987
1st Resistance: 1.1252
Risk Warning:
Trading Forex and CFDs carries a high level of risk to your capital and you should only trade with money you can afford to lose. Trading Forex and CFDs may not be suitable for all investors, so please ensure that you fully understand the risks involved and seek independent advice if necessary.
Disclaimer:
The above opinions given constitute general market commentary, and do not constitute the opinion or advice of IC Markets or any form of personal or investment advice.
Any opinions, news, research, analyses, prices, other information, or links to third-party sites contained on this website are provided on an "as-is" basis, are intended only to be informative, is not an advice nor a recommendation, nor research, or a record of our trading prices, or an offer of, or solicitation for a transaction in any financial instrument and thus should not be treated as such. The information provided does not involve any specific investment objectives, financial situation and needs of any specific person who may receive it. Please be aware, that past performance is not a reliable indicator of future performance and/or results. Past Performance or Forward-looking scenarios based upon the reasonable beliefs of the third-party provider are not a guarantee of future performance. Actual results may differ materially from those anticipated in forward-looking or past performance statements. IC Markets makes no representation or warranty and assumes no liability as to the accuracy or completeness of the information provided, nor any loss arising from any investment based on a recommendation, forecast or any information supplied by any third-party.

GBPCHFThe tool watches for a strong upward move (called the flagpole).
Then it looks for a small pullback or sideways move (called the flag).

GBPCHF My Opinion! SELL!
My dear friends,
My technical analysis for GBPCHF is below:
The market is trading on 1.1144 pivot level.
Bias - Bearish
Technical Indicators: Both Super Trend & Pivot HL indicate a highly probable Bearish continuation.
Target - 1.1126
About Used Indicators:
A pivot point is a technical analysis indicator, or calculations, used to determine the overall trend of the market over different time frames.
Disclosure: I am part of Trade Nation's Influencer program and receive a monthly fee for using their TradingView charts in my analysis.
———————————
WISH YOU ALL LUCK

RISING WEDGE RETEST SHORT?Trading the Rising Wedge Pattern
Trading the rising wedge pattern involves strategically capitalizing on its bearish reversal signal.
Here's a common set of steps to go about it:
5
Identification: The first step is to identify the rising wedge pattern on the chart. A trader or investor would look for converging, upward-sloping trend lines with higher highs and higher lows. The pattern usually forms during an uptrend.
Confirmation: The trader will wait for confirmation before entering a trade. Confirmation typically comes in the form of a break below the lower trend line. Declining volume during the wedge formation can serve as additional confirmation.
Entry point: Traders often enter a short position once the pattern is confirmed. The breakout point below the lower trend line serves as the entry point.
Stop losses: A stop loss is generally set just above the last high within the pattern. This minimizes potential losses if the pattern fails and the price reverses into an uptrend.
Price target: The price target is usually determined by measuring the pattern's height at its widest point and subtracting that value from the breakout level. Some traders use Fibonacci retracement levels as added targets to fine-tune their exit strategy.
Risk management: Managing risk effectively when trading the rising wedge pattern is critical. This involves setting appropriate position sizes and using other technical analysis indicators to validate the pattern, such as the relative strength index (RSI) or moving average convergence divergence (MACD).
Exit strategy: Traders usually exit the position once the price reaches the preset target. However, monitoring other technical analysis indicators and market news that could influence price action is advisable.

GBPCHF: Long Setup – Bounce from Trendline + EMA CrossThe price has bounced from the lower boundary of the ascending channel and confirmed a bullish reversal after EMA cross. Current momentum supports a long position.
📌 Entry: Market buy (current price ~1.1142)
🎯 Targets:
TP1: 1.1291 – minor resistance
TP2: 1.1394 – upper channel border
🛡️ Stop-loss: Below 1.1090 (under channel + EMAs)
This setup favors continuation of the bullish trend after liquidity grab and structure shift.

GBPCHF INTRADAY bearish below 1.1230The GBP/CHF currency pair is currently exhibiting a bearish sentiment, aligned with the broader downtrend. Recent price action shows the market is in a sideways consolidation phase, indicating a potential pause before the next directional move.
Key Trading Level: 1.1230
This level marks a prior intraday consolidation zone and serves as a critical resistance area within the current trend context.
Bearish Scenario (on rejection from 1.1230):
A failed test of 1.1230 resistance would likely reinforce bearish momentum.
Downside support targets include:
1.1100 – Initial support
1.1050 – Next structural support
1.0980 – Long-term bearish target
Bullish Scenario (on breakout above 1.1230):
A confirmed breakout and daily close above 1.1230 would invalidate the bearish structure.
In that case, potential upside targets include:
1.1300 – Key resistance level
1.1370 – Higher resistance from previous reversal zones
Conclusion
The medium-term outlook for GBP/CHF remains bearish, with 1.1230 acting as a decisive pivot level. As long as price stays below this threshold, downside continuation toward 1.1100 and beyond remains favored. However, a clear breakout above 1.1230 on a daily closing basis would shift the sentiment and open the door for a bullish correction toward 1.1300–1.1370. Traders should monitor the 1.1230 level closely for directional confirmation.
This communication is for informational purposes only and should not be viewed as any form of recommendation as to a particular course of action or as investment advice. It is not intended as an offer or solicitation for the purchase or sale of any financial instrument or as an official confirmation of any transaction. Opinions, estimates and assumptions expressed herein are made as of the date of this communication and are subject to change without notice. This communication has been prepared based upon information, including market prices, data and other information, believed to be reliable; however, Trade Nation does not warrant its completeness or accuracy. All market prices and market data contained in or attached to this communication are indicative and subject to change without notice.

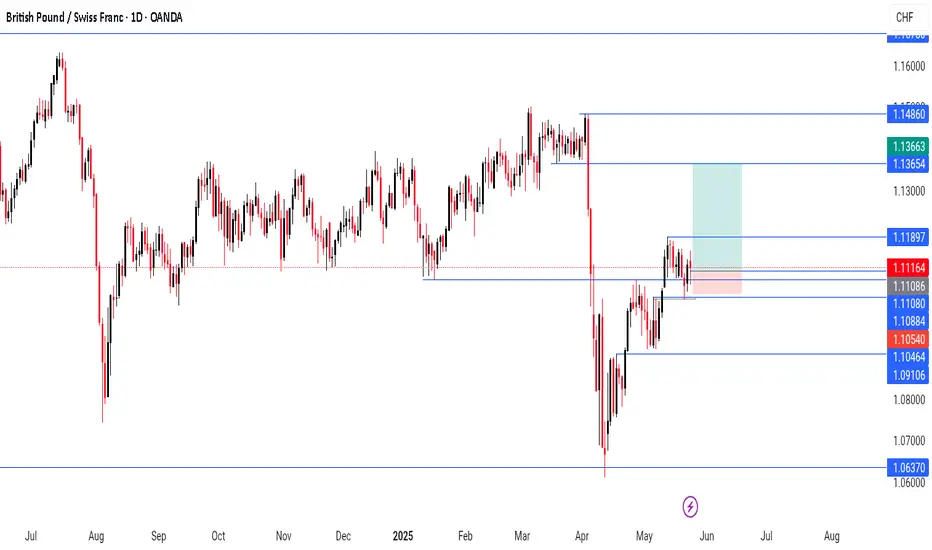
GBPCHF Price Action: Correction Before Next Impulse?GBPCHF Analysis
Market Overview
GBPCHF experienced a strong downward move from 1.14860 to 1.06370, forming a double bottom. The pair is now in a corrective phase, seeking liquidity around 1.13654, potentially leading to another impulsive move toward the downside, targeting 1.01733.
Weekly & Daily Structure
Weekly Resistance at 1.10884: Previously broken by the last weekly candle, now being retested by this week's price action.
Daily Correction: Price retraced downward to a daily support level, which was previously weekly resistance.
Liquidity Grab at 1.10464: Market collected liquidity, broke previous support, and retested again, with the support holding—indicating growing buyer momentum at the daily level.
4-Hour Market Structure
CHOCH at 1.11018 & BOS at 1.11357: These signals indicate a shift in order flow.
Liquidity Grab & Retest at 1.10745: The market broke internal support, grabbed liquidity, then broke the previous resistance. Now, we wait for a 4-hour retest at this new support level.
Trade Plan
4-Hour Entry
Entry: 1.11080
Stop Loss: 1.10542
Take Profits:
TP1: 1.11897
TP2: 1.13654
Daily Entry
Entry:1.11164
Stop Loss:1.10313
Take Profits: Same as the 4-hour trade setup.
GBPCHF Breaks Rising Wedge – Reversal Targets 1.0940 and 1.0815GBPCHF has broken down from a rising wedge formation on the 4H chart, signaling a shift from bullish momentum to bearish control. The pattern break comes near the 50% retracement level, with price now trading below ascending trendline support. With fundamental headwinds weighing on the British pound and safe-haven demand supporting the Swiss franc, the setup favors a short bias targeting the 1.0940 and 1.0815 zones.
🔍 Technical Analysis
Pattern: Rising wedge → broken to the downside
Breakout Confirmation: Price has closed below the wedge support (trendline)
Key Support Levels:
1.0940 → 38.2% fib + previous structure support
1.0815 → 23.6% fib retracement + horizontal support zone
1.0608 → Full wedge base (longer-term target)
Resistance / Invalidation:
1.1150 – a close back above this level invalidates the breakdown
Candle Behavior:
Bearish structure forming with lower highs
Clean engulfing candle closed below wedge
📉 Bias: Bearish (confirmed technical reversal)
🌍 Fundamental Context
🇬🇧 British Pound (GBP)
UK CPI expected to rise (3.3% forecast), which may limit BoE cuts, but not bullish enough to support GBP
Political uncertainty resurfaces (Labour slipping in polls)
BoE speakers are split; no clear support from policy
🇨🇭 Swiss Franc (CHF)
Safe-haven flows rising on:
Global growth slowdown
Tensions between U.S.–Iran
Downgrade of U.S. debt → risk aversion favors CHF
SNB remains cautious, but CHF gains defensive strength in risk-off conditions
🎯 Trade Setup
Bias: Sell
Entry Zone: 1.1080–1.1100 (breakout confirmation)
Targets:
TP1: 1.0940
TP2: 1.0815
TP3: 1.0608 (extension target)
Stop Loss: Above 1.1150
⚠️ Risk Factors
CPI surprise tomorrow could cause GBP spikes — be cautious around the release
If equities rally hard or CHF weakens globally, price could retest the wedge structure before falling
BoE hawkish surprise could challenge short-term bearish bias
🧭 Conclusion
GBP/CHF has broken out of a rising wedge — a classic bearish reversal signal. The technical break aligns with macro weakness in GBP and CHF strength in a risk-off environment. Short trades remain valid below 1.1150, targeting a drop to 1.0940 and 1.0815 in the coming sessions.

GBP/CHF -2-hour -SHORTThe price action shows a clear break of a long-term ascending trendline, signaling a potential shift in momentum. This trend break aligns with the Ichimoku Cloud, where the price has moved below the cloud, indicating bearish sentiment. Additionally, the Ichimoku Wave theory suggests a corrective wave pattern, with the price testing key support zones after the breakout. The Tenkan-sen and Kijun-sen lines are converging, hinting at a possible consolidation or further directional move. Look for confirmation of the bearish trend with a break below the projected N, V, and E waves, as outlined by the Ichimoku structure, to validate the next potential move.

GBP/CHF "Pound vs Swiss" Forex Bank Heist Plan (Scalping/Day)🌟Hi! Hola! Ola! Bonjour! Hallo! Marhaba!🌟
Dear Money Makers & Robbers, 🤑 💰💸✈️
Based on 🔥Thief Trading style technical and fundamental analysis🔥, here is our master plan to heist the GBP/CHF "Pound vs Swiss" Forex market. Please adhere to the strategy I've outlined in the chart, which emphasizes long entry. Our aim is the high-risk ATR & MA Zone. Risky level, overbought market, consolidation, trend reversal, trap at the level where traders and bearish robbers are stronger. 🏆💸"Take profit and treat yourself, traders. You deserve it!💪🏆🎉
Entry 📈 : "The vault is wide open! Swipe the Bullish loot at any price - the heist is on!
however I advise to Place buy limit orders within a 15 or 30 minute timeframe nearest or swing low or high level for pullback entries.
Stop Loss 🛑:
Thief SL placed at the recent / nearest low level Using the 1H timeframe (1.08300) swing trade basis.
SL is based on your risk of the trade, lot size and how many multiple orders you have to take.
Target 🎯:
🏴☠️Primary Target - 1.11200 (or) Escape Before the Target
🏴☠️Secondary Target - 1.12500 (or) Escape Before the Target
💰💵💸GBP/CHF "Pound vs Swiss" Forex Bank Heist Plan (Scalping/Day) is currently experiencing a bullishness,., driven by several key factors. ☝☝☝
📰🗞️Get & Read the Fundamental, Macro, COT Report, Quantitative Analysis, Sentimental Outlook, Intermarket Analysis, Future trend targets and Overall outlook score..., go ahead to check 👉👉👉🔗
⚠️Trading Alert : News Releases and Position Management 📰 🗞️ 🚫🚏
As a reminder, news releases can have a significant impact on market prices and volatility. To minimize potential losses and protect your running positions,
we recommend the following:
Avoid taking new trades during news releases
Use trailing stop-loss orders to protect your running positions and lock in profits
📌Keep in mind that these factors can change rapidly, and it's essential to stay up-to-date with market developments and adjust your analysis accordingly.
💖Supporting our robbery plan 💥Hit the Boost Button💥 will enable us to effortlessly make and steal money 💰💵. Boost the strength of our robbery team. Every day in this market make money with ease by using the Thief Trading Style.🏆💪🤝❤️🎉🚀
I'll see you soon with another heist plan, so stay tuned 🤑🐱👤🤗🤩

GBPCHF Analysis As our followers know (see the pinned idea below), we previously entered a short from this level and took profit successfully 💰
Now that level has been broken and we’re patiently waiting for a pullback to enter a buy position 📈
Let’s wait for confirmation before jumping in! ⏳
For detailed entry points, trade management, and high-probability setups, follow the channel:
ForexCSP

GBPCHF Technical & Order Flow AnalysisOur analysis is based on multi-timeframe top-down analysis & fundamental analysis.
Based on our view, the price will fall to the monthly level.
DISCLAIMER: This analysis can change anytime without notice and is only for assisting traders in making independent investment decisions. Please note that this is a prediction, and I have no reason to act on it, and neither should you.
Please support our analysis with a boost or comment!

GBPCHF – Pullback to Demand Zones for Possible Buy Setup | ProfiOn the 1H timeframe, GBPCHF has broken above a key high and confirmed support with a solid close — showing bullish momentum.
However, price is currently reacting to a 1H red order block, which could trigger a short-term correction.
We’re now waiting for price to revisit one of the lower demand zones for potential buy opportunities. Make sure to look for multiple confirmations on the lower timeframes (M5 or M3) before entering any trade.
Also, keep an eye on the red supply zone above; it may offer valid sell opportunities if bearish confirmations appear.
📌 Key Levels
🟢 Support Zones:
• 1.1036 – 1.1046
• 1.0920 – 1.0950
🔴 Resistance Zone:
• 1.1250 – 1.1290
⚠️ Entry only with confirmation – patience pays.
🔍 Insight by ProfitaminFX
If this outlook resonates with your own view, drop your chart or feedback below. Let’s learn and grow together 📈

GBPCHF - Expecting Bearish Continuation In The Short TermH1 - Clean bearish trend with the price creating series of lower highs, lower lows.
No opposite signs.
Expecting further continuation lower until the two Fibonacci resistance zones hold.
If you enjoy this idea, don’t forget to LIKE 👍, FOLLOW ✅, SHARE 🙌, and COMMENT ✍! Drop your thoughts and charts below to keep the discussion going. Your support helps keep this content free and reach more people! 🚀
--------------------------------------------------------------------------------------------------------------------
Disclosure: I am part of Trade Nation's Influencer program and receive a monthly fee for using their TradingView charts in my analysis.

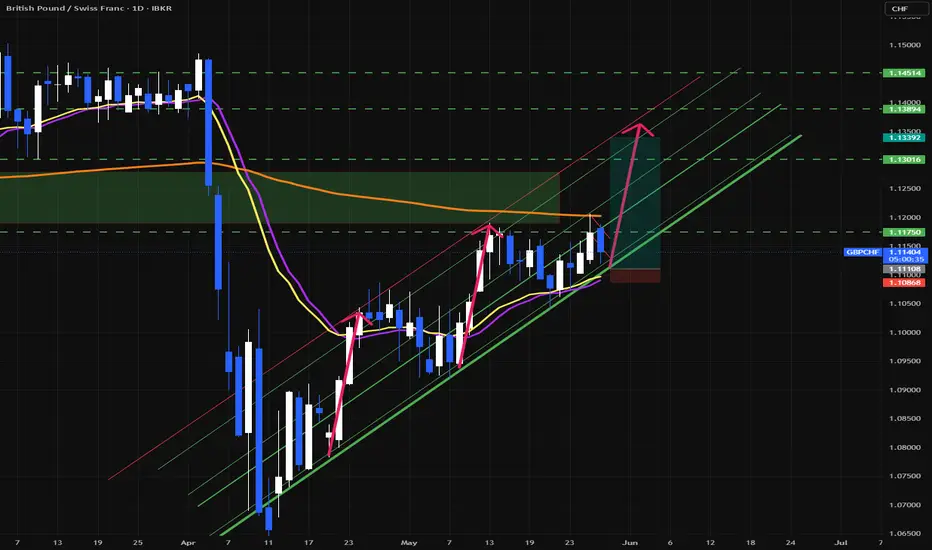
GBPCHF Market Outlook: Bullish Momentum Ahead?GBPCHF Market Outlook: Bullish Momentum Ahead?
Following our previous analysis, GBPCHF successfully reached its first target and is now pausing, entering another accumulation phase.
The price appears to be gearing up for another bullish wave, with a strong zone established near 1.1095.
If this accumulation continues, GBPCHF could push higher, targeting the 1.1190 and 1.1290 levels.
The pair is well-positioned for an upward trend, but as always, the market’s next move will depend on broader dynamics—and whether SNB has any unexpected surprises.
You may find more details in the chart!
Thank you and Good Luck!
❤️PS: Please support with a like or comment if you find this analysis useful for your trading day❤️
Disclosure: I am part of Trade Nation's Influencer program and receive a monthly fee for using their TradingView charts in my analysis.

POSSIBLE SELL SET-UP ON GBPCHFGBPCHF is a correction phase after a great impulse , lets patiently wait the price to make a retest on the broken bearish flag for a potential sell opportunity

GBP/CHF For Bullish as pull-backyou can go long now
or
wait for pull-back near by entry point and then go long
general trend is down trend
current phase is pull-back
have fun :)

GBPCHF - Potential Sell (Day Trading)Hi Traders,
Next week lets SELL CMCMARKETS:GBPCHF
Price Action Analysis:
4hr Chart: Since April 2025, we’ve seen an aggressive drop, followed by a solid pullback. However, the pullback appears to be losing momentum. This suggests buyers might be done at this level, and another wave of discounting (selling) could be coming.
1hr Chart: The upward momentum has faded, and price has returned to buyer territory. We need to monitor closely—if buyers don't show strength here, it may be time to look for sell opportunities.
Lower Time Frame: Watch for entry timing confirmation.
Good Luck
STUDY, STUDY, STUDY. Lorenzo Tarati :)

#002 GBP/CHF SHORT Investment Opportunity
👋 Hello, I am Forex Trader Andrea Russo, founder of the SwipeUP Method, a professional analysis approach based on 16 integrated modules that combines artificial intelligence, cyclicality, macro data, technical analysis and institutional positioning.
Today I present a new SHORT investment opportunity on GBP/CHF, analyzed and validated according to my DEFINITIVE PROMPT.
📌 Trade Parameters
Pair: GBP/CHF
Direction: Short
Main Timeframe: 8H
Entry Point: 1.10745 (Red/Purple Box Intersection)
Stop Loss: 1.11515 (End of Red Box)
Take Profit: 1.08335 (End of Purple Box)
Risk: ~77 pips
Target: ~411 pips
Risk/Reward Ratio: ~1:5.33
Expected Return: +3.71%
SwipeUP Model Reliability: 91%
🔍 SwipeUP Method Analysis (16 Modules)
1. Multi-timeframe Technical Analysis
Weekly: Correction after Historical Bearish Impulse.
Daily: Bullish Impulse Exhausted Below Key Resistance.
8H: first bearish breakout on dynamic support, with pullback completed.
✔️ Short trend confirmed on H8 and daily.
2. Technical indicators
WaveTrend: complete bearish crossover in overbought zone.
Stochastic: confirmed cross down.
EMA: breakout below all moving averages.
✔️ Total bearish alignment of indicators.
3. Cyclical and harmonic analysis
Harmonic completed (Bat type) with theoretical target in TP zone.
Weekly cycles show exhaustion of the bullish movement.
✔️ Cyclical and short harmonic validation.
4. Mathematics and statistics
Fibonacci 61.8% retracement completed.
127.2% extension targeted as short target.
✔️ Favorable mathematical patterns.
5. Market Sentiment
72% long retail GBP/CHF (fxssi.com).
Favorable misalignment for short.
✔️ Valid contrarian strategy.
6. Institutional positioning
COT: net accumulation in CHF by non-commercials.
CHF seen as a safe haven currency in times of macro uncertainty.
✔️ Big player positioning confirms short.
7. Fundamental and macroeconomic analysis
GBP weakened by persistent inflation and neutral BoE outlook.
CHF supported by conservative SNB policy.
✔️ Fundamental scenario favors short.
8. Implied and historical volatility
Volatility compression in progress → potential imminent directional explosion.
✔️ Optimal technical timing.
9. Pattern Backtesting
Similar patterns on GBP/CHF have shown 78% success.
Average time to target: 6–9 days.
✔️ High historical confidence.
10. Confirmation with AI models
GAN model and Prophet confirm short directionality with 84% probability.
✔️ AI in alignment.
11. Real-time data updates
All information is updated as of May 21, 2025, 15:34 UTC+2.
✔️ Analysis based on fresh and accurate data.
12. Historical study (last 50 years)
Forced bull phases on GBP/CHF followed by medium-term corrections are common in UK-Swiss economic cycles.
✔️ Consistent historical pattern.
