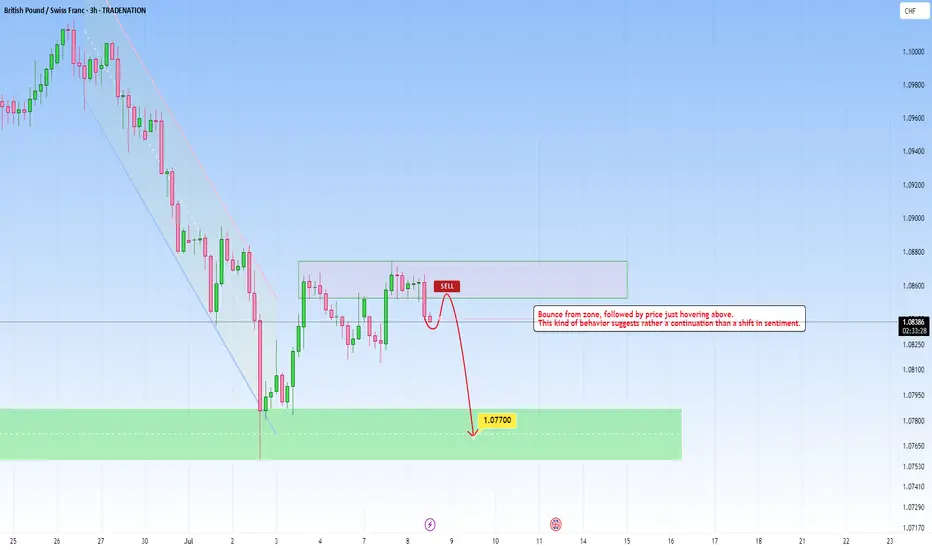
GBPCHF - Continuation Setup towards 1.0770GBPCHF recently descended with strength, and I’ve been watching to see how price reacts here.
Price now hovers above and this is a great indication for us to use for possible continuation move, that could send price into the 1.0770 level.
But if price breaks above with momentum, then I’ll back off the bearish bias and reassess, and I’d consider the continuation idea invalidated, with potential for further upside.
Just sharing my thoughts for the charts, this isn’t financial advice. Always confirm your setups and manage your risk properly.
Disclosure: I am part of Trade Nation's Influencer program and receive a monthly fee for using their TradingView charts in my analysis.
GBPCHF trade ideas
X1: GBPCHF Long Trade Risking 1% to make 1.35%OANDA:GBPCHF Long trade, with my back testing of this strategy, it hits multiple possible take profits, manage your position accordingly.
Risking 1% to make 1.35%
This is good trade, don't overload your risk like greedy, be disciplined trader, this is good trade.
Use proper risk management
Looks like good trade.
Lets monitor.
Use proper risk management.
Disclaimer: only idea, not advice


GBCHF Will Fly from a Old support LevelHello Traders
In This Chart GBPCHF HOURLY Forex Forecast By FOREX PLANET
today GBPCHF analysis 👆
🟢This Chart includes_ (GBPCHF market update)
🟢What is The Next Opportunity on GBPCHF Market
🟢how to Enter to the Valid Entry With Assurance Profit
This CHART is For Trader's that Want to Improve Their Technical Analysis Skills and Their Trading By Understanding How To Analyze The Market Using Multiple Timeframes and Understanding The Bigger Picture on the Charts

GBP/CHF Headed to 1.10 – But Bulls Might Regret It📉 1. Price Action & Technical Structure (D1)
Key demand zone tested with bullish reaction:
Price reacted strongly around the 1.0790–1.0840 structural demand area, previously the origin of a significant bullish impulse. The latest daily candle closed above the previous swing low, suggesting a potential technical rebound.
Immediate target:
The 1.0980–1.1010 zone, aligning with:
A clear supply area
RSI bouncing from oversold territory
A visible imbalance left unfilled
Technical bias: Short-term LONG to fill the imbalance before a potential institutional-driven short setup at supply.
2. Retail Sentiment
86% of traders are LONG, with an average entry of 1.0997
Only 14% are SHORT, with lower volume and better pricing
Current price: 1.0833, meaning most long traders are in drawdown
Contrarian view:
The heavy long positioning creates a liquidity pool between 1.0990–1.1010, making that zone highly attractive for institutional distribution and liquidation of retail longs, especially if accompanied by a structural shift.
🎯 Operational impact:
Supports a technical long to 1.10, but high risk of reversal once that level is reached.
3. COT Report
GBP (British Pound – CME)
Non-commercials:
Long: -6,434 → massive unwind of bullish exposure
Short: +2,028 → rising bearish bets
Net positioning is increasingly bearish
Commercials:
Long: +7,459 → increasing coverage against GBP weakness
Short: -569 → slight reduction
Positioning is mixed, but commercials are taking defensive long positions
GBP interpretation:
Bearish pressure rising from institutional speculators, despite some commercial support.
CHF (Swiss Franc – CME)
Non-commercials:
Long: +327
Short: +1,215
Net positioning still heavily short, but shorts increasing again
Commercials:
Long: +1,909
Short: +307
Commercials are accumulating long CHF positions (bullish sign)
CHF interpretation:
Divergence between commercials (bullish CHF) and speculators (still short) → shift may be underway.
4. July Seasonality
GBP:
Historically strong in July, especially the last 2 years (+3.5%)
Positive tendency across 10y/15y/20y averages
CHF:
Also seasonally positive in July, but underperforms GBP across most timeframes (except 2Y where CHF is also strong)
Operational impact:
Favors short-term bullish GBP/CHF bias, supported by seasonal momentum.
✅ Final Outlook
Current short-term bias is bullish, driven by:
Clear technical rebound
Visible imbalance toward 1.10
Seasonal divergence in favor of GBP
However, excessive retail long positioning + COT speculative pressure on GBP suggest this rally could be a distribution phase, offering an optimal short opportunity at 1.10.

GBPCHF SELLBy utilizing levels, historical patterns, , we can formulate a hypothesis that the market might follow a similar trajectory if bearish sentiment prevails.

GBPCHF Potential Bearish SetupDistribution pattern with breakdown below key support suggests downside momentum.
Break above our Resistance zone will invalidate our trade setup; good idea to watch out if that happens.
- Breakdown Level: 1.08149 -1.08133
- Entry Strategy: Sell orders at BOS
- Stop Loss: Above Resistance zone
- Target Zones:
- Primary Target: Target 1 (R:R 1:2)
- Secondary Target: Target 2 (R:R 1:3)
- Extension Target: Target 3 (R:R 1:4)
Bearish/Bullish Confirmations:
🔻 Rejection candlestick patterns
🔻 Bearish Reversal patterns
🔻 Impulsive moves in line with setups directional bias
Position Management:
- Exit: Partial profits at targets
- Stop adjustment: Trail stops when target are hit

GBP/CHF - Channel Breakout (02.07.2025)The GBP/CHF pair on the M30 timeframe presents a Potential Buying Opportunity due to a recent Formation of a Breakout Pattern. This suggests a shift in momentum towards the upside and a higher likelihood of further advances in the coming hours.
Possible Long Trade:
Entry: Consider Entering A Long Position around Trendline Of The Pattern.
Target Levels:
1st Resistance – 1.0956
2nd Resistance – 1.0996
🎁 Please hit the like button and
🎁 Leave a comment to support for My Post !
Your likes and comments are incredibly motivating and will encourage me to share more analysis with you.
Best Regards, KABHI_TA_TRADING
Thank you.
Disclosure: I am part of Trade Nation's Influencer program and receive a monthly fee for using their TradingView charts in my analysis.

Inverse cup pattern in GBPCHFI think I had late drawn on this pattern lolz
Price is now at the last stage of the falling rectangle, please sell at whatever high forming according to own analysis/setups, project at the very beginning of the move.

07.07.2025 #GBPCHFBUY 1.08150 | STOP 1.07500 | TAKE 1.08950 | Initial upward movement around a strong range of local support.
GBPCHF TRADE SETUPWait for retest the entry level then take a trade for sell otherwise skip this setup

LONG ON GBP/CHFGBP/CHF has tapped into a major demand zone and has lots of buy side liquidity to the upside near the supply zone to collect.
I will be buying GBP/CHF to the supply zone looking to catch 400-600 pips.

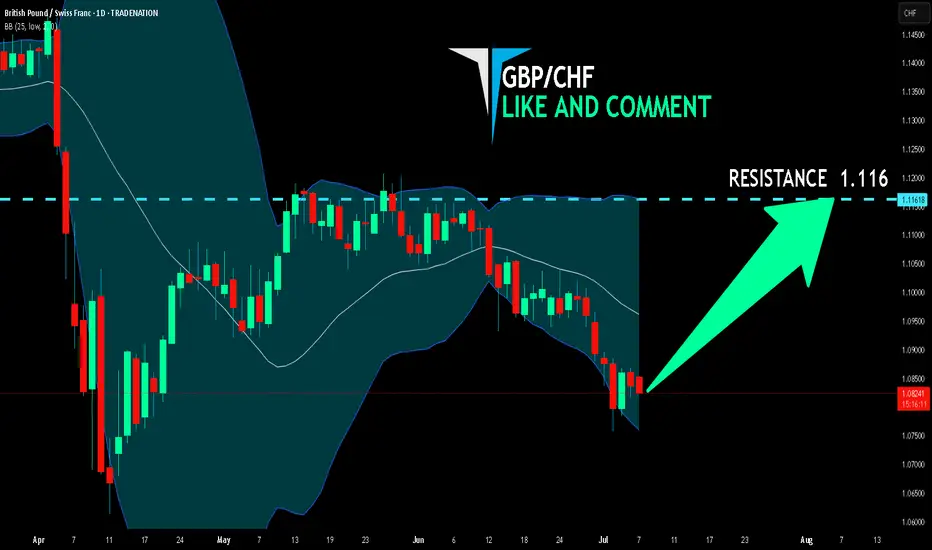
GBP/CHF LONG FROM SUPPORT
Hello, Friends!
GBP/CHF pair is in the downtrend because previous week’s candle is red, while the price is obviously falling on the 1D timeframe. And after the retest of the support line below I believe we will see a move up towards the target above at 1.116 because the pair oversold due to its proximity to the lower BB band and a bullish correction is likely.
Disclosure: I am part of Trade Nation's Influencer program and receive a monthly fee for using their TradingView charts in my analysis.
✅LIKE AND COMMENT MY IDEAS✅
GBP-CHF Bearish Breakout! Sell!
Hello,Traders!
GBP-CHF is trading in a strong
Downtrend and the pair
Broke the key horizontal
Level around 1.0780 which
Reinforces our bearish
Bias and we will be
Expecting a further
Bearish move down
On Monday!
Sell!
Comment and subscribe to help us grow!
Check out other forecasts below too!
Disclosure: I am part of Trade Nation's Influencer program and receive a monthly fee for using their TradingView charts in my analysis.

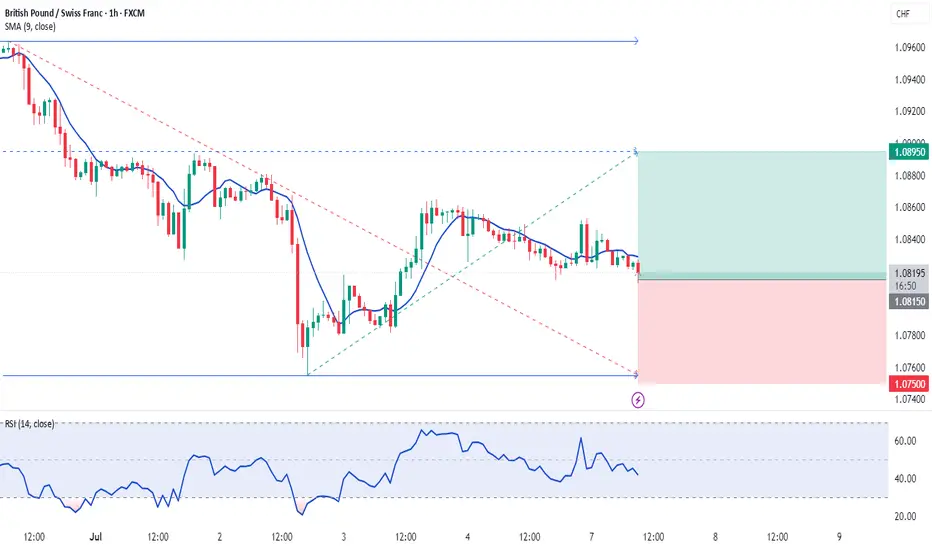
GBP/CHF Long Setup📈 GBP/CHF Long Setup
🕒 1H Timeframe
📍Entry: 1.0800
🎯 Target: 1.0889
I'm currently long GBPCHF after seeing a strong bounce from a key demand zone. Price has printed a higher low and is showing bullish structure on the 1H. Targeting a break above local resistance toward 1.0889.
🔍 Multiple rejections from demand + bullish momentum = high probability setup.
📊 Let’s see if price can push through those liquidity levels.
📍 Risk-managed and eyes on PA — updates to follow.
#GBPCHF #Forex #TradeSetup #PriceAction #SmartMoney #MarketStructure #SwingTrade

Swiss Vault Job: GBP/CHF Entry Blueprint Unlocked🕵️♂️💼 GBP/CHF: The Swiss Vault Infiltration Protocol 💼🕵️♂️
(Swing/Day Plan — Executed in Silence, Paid in Profits)
🌟Hi! Hola! Ola! Bonjour! Hallo! Marhaba!🌟
Dear Money Makers & Silent Operators, 🤑💰💸✈️
Welcome to the Thief Trading Syndicate's Strategic Playbook – today’s mission targets the GBP/CHF vault. We’ve cooked up a master plan powered by our signature blend of technical finesse and stealthy macro-insight. This setup is based on institutional footprints and high-stakes zones where liquidity flows like digital gold.
📊 Current Bias:
🟥 Bearish weight remains, but we smell bullish smoke beneath — reversal setups in play.
📈 Entry Strategy:
Long (Bullish) — Scout entry above 1.06500+ in higher timeframes (4H+). Retest confirmation required.
Short (Bearish) — “The vault’s unguarded! Slip in short anywhere up top—clean sweep mode.”
🛑 Stop Loss Placement:
Place SL near recent swing highs/lows on the 5H chart (swing basis). Customize per lot size and multiple entries. Your risk defines your escape rope.
🎯 Profit Extraction Target:
Long TP: Aim for the 1.11500 vault door (or vanish before it slams).
Short TP: Dive to 1.06500, or pull the plug earlier if guards wake up.
📰 Strategic Conditions:
This pair’s behavior is currently driven by mixed macro triggers — smart money positioning (COT), sentiment clusters, and market structure traps.
→ For full details: Fundamental macros, COT leaks, sentiment drift, and institutional zones — check your sources.
🚨 News & Risk Protocols:
No new entries during red-folder events.
Use trailing stops to lock loot and run.
💥 Boost Our Bandits!
Smash that ❤️ to strengthen our robbing force. Each tap fuels future missions. No indicators. Just raw street-smart trading edge.
👀 More heists incoming. Stay low. Stay sharp. Stay profitable. 🐱👤🎯📈

GBP/CHF – Breakout Buy Setup Based on Bullish Divergence (1H TF)The GBP/CHF pair has been moving in a bearish trend, but momentum appears to be shifting. A strong bullish divergence has developed on the 1-hour chart, suggesting potential for a reversal.
Despite no clear reversal pattern at this stage, we’re eyeing a breakout above the last lower high (LH) as confirmation of a shift toward bullish structure. If the breakout occurs, we expect a new higher high (HH) to form, aligning with the divergence.
Retail sentiment is currently 90% long, which adds further interest to this setup. Our buy stop order is positioned to catch the move early, with a 1:1 risk-reward profile.
🔹 Pair: GBP/CHF
🔹 Timeframe: 1H
🔹 Trend: Bearish
🔹 Divergence: Bullish
🔹 Pattern: None
🔹 Sentiment: 90% Long (Myfxbook)
🔹 Bias: Neutral (awaiting structure shift)
🔹 Entry (Buy Stop): 1.08982
🔹 Stop Loss: 1.08207
🔹 Take Profit: 1.09757
🔹 Lot Size: 0.20
🔹 Risk/Reward: 1:1
🔹 Risk: $200
🔹 Potential Reward: $200
🎯 Strategy: Entry will only be triggered if price breaks above the previous LH. That would signal a shift in structure and validate the divergence setup.
📌 #GBPCHF #ForexSignals #BullishBreakout #PriceActionSetup #TrendReversal #SmartMoneyMoves #RetailSentiment #BullishDivergence #1HChart #ForexAnalysis #BuySetup #RiskReward

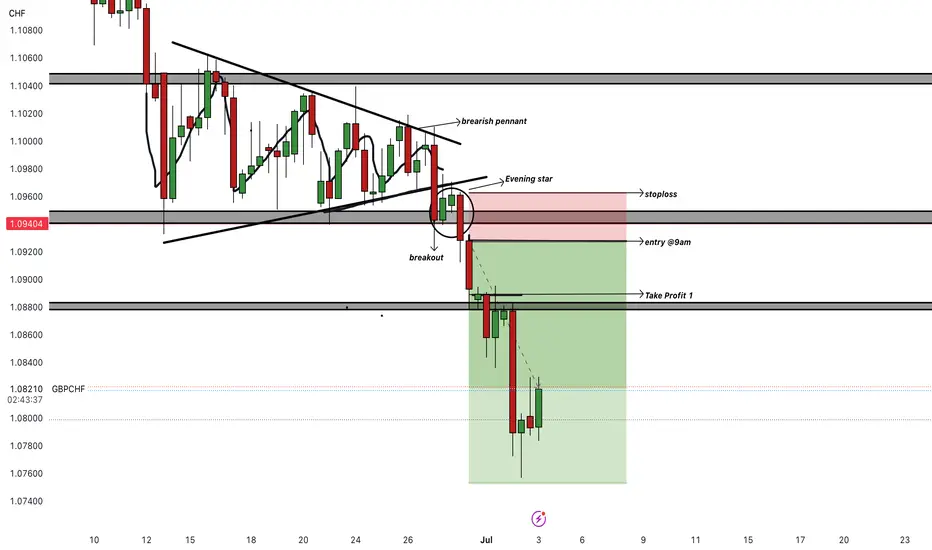
Perfect short on GBPCHFI went short on GBPCHF because of the bearish pennant pattern that formed on the 8hr , price action than continued to break below the level and pulling back to the pattern and forming a bearish evening star pattern on the 8hr as well and I entered the trade at 9am est on the opening of the new 8hr candlestick
GBPCHF | Bearish | ShortGBPCHF is in a bearish trend.It is not honoring the bullish divergence and continues to stay in bearish trend by printing new LHs and LLs.

GBPCHF Wave Analysis – 3 July 2025- GBPCHF reversed from strong support level 1.0785
- Likely to rise to resistance level 1.0950
GBPCHF currency pair recently reversed up from the strong support level 1.0785 (which has been steadily reversing the price from last August as can be seen below).
The upward reversal from the support level 1.0785 created the daily Japanese candlesticks reversal pattern Bullish Engulfing.
Given the strength of the support level 1.0785 and the oversold daily Stochastic, GBPCHF currency pair can be expected to rise to the next round resistance level 1.0950.

GBPCHF currency trend!I believe that the GBPCHF currency will successfully continue its upward path until it reaches the first price target in the price range of 1.1760, and it will probably take more time to reach the second price target in the price range of 1.2225.
Thanks
MJ.REZAEI

GBPCHF is BullishPrice was in a downtrend, however bullish divergence coupled with double bottom reversal pattern hints a bullish reversal. If previous lower high is broken with good volume then we can expect a reversal as per Dow theory. Targets are mentioned on the chart.
