GBPCHF: Consolidation ContinuesThe pair is currently consolidating within a wide horizontal trading range on a 4H time frame.
Following a test of its support, the price has shown some sideways movement and distribution.
A break above its minor resistance indicates a strong intraday bullish signal; therefore, I anticipate that the price could increase to the 1.1003 level.
GBPCHF trade ideas

GBPCHF: Strong Bearish SignalGBPCHF has been in a prolonged consolidation since mid-June, remaining within a significant horizontal range on the 4-hour chart.
Following the weekend market opening, the pair appears to be strongly bearish.
The violation of a support level within this range suggests the end of a bearish accumulation phase, creating potential for further upward movement, with the next resistance level to watch at 1.0889.


GBP/CHF Daily AnalysisPrice has been testing support at 1.09400 for a number of days.
Failure to break lower could mean buyers step in and a possible range playing out with a potential target of 1.1180
If you agree with this analysis, look for a trade that meets your strategy rules.

GBPCHFLooking at this to go bullish so much that I want an early entry to hold the long term incoming bulls. Currently the triangle is expanding and we heading to its resistance/ceiling but as of now there isn't a confirmation here, just the overall analysis for long term as well.

GBPCHF: Pullback From Support 🇬🇧🇨🇭
GBPCHF is going to pull back from a wide daily support cluster.
I see a strong intraday bullish confirmation and a bullish
imbalance candle after the news.
Goal - 1.0986
❤️Please, support my work with like, thank you!❤️
I am part of Trade Nation's Influencer program and receive a monthly fee for using their TradingView charts in my analysis.

GBPCHF Analysis As our followers know (see the pinned idea below), we previously entered a short from this level and took profit successfully 💰
Now that level has been broken and we’re patiently waiting for a pullback to enter a buy position 📈
Let’s wait for confirmation before jumping in! ⏳
For detailed entry points, trade management, and high-probability setups, follow the channel:
ForexCSP

Range Bound GBPCHF Range Bound GBPCHF may rebound form the support. It has been trading in the same range/consolidation. May again publal back from this support.

GBP-CHF Support Ahead! Buy!
Hello,Traders!
GBP-CHF is going down now
And the pair will soon hit a
Horizontal support level below
Around 1.0933 from where
We will be expecting a
Local rebound and a move up
Buy!
Comment and subscribe to help us grow!
Check out other forecasts below too!
Disclosure: I am part of Trade Nation's Influencer program and receive a monthly fee for using their TradingView charts in my analysis.

GBP/CHF BULLS WILL DOMINATE THE MARKET|LONG
Hello, Friends!
GBP-CHF downtrend evident from the last 1W red candle makes longs trades more risky, but the current set-up targeting 1.096 area still presents a good opportunity for us to buy the pair because the support line is nearby and the BB lower band is close which indicates the oversold state of the GBP/CHF pair.
Disclosure: I am part of Trade Nation's Influencer program and receive a monthly fee for using their TradingView charts in my analysis.
✅LIKE AND COMMENT MY IDEAS✅

GBPCHF Is Going Up! Buy!
Please, check our technical outlook for GBPCHF.
Time Frame: 2h
Current Trend: Bullish
Sentiment: Oversold (based on 7-period RSI)
Forecast: Bullish
The price is testing a key support 1.095.
Current market trend & oversold RSI makes me think that buyers will push the price. I will anticipate a bullish movement at least to 1.098 level.
P.S
The term oversold refers to a condition where an asset has traded lower in price and has the potential for a price bounce.
Overbought refers to market scenarios where the instrument is traded considerably higher than its fair value. Overvaluation is caused by market sentiments when there is positive news.
Disclosure: I am part of Trade Nation's Influencer program and receive a monthly fee for using their TradingView charts in my analysis.
Like and subscribe and comment my ideas if you enjoy them!

GBP-CHF Bearish Breakout! Sell!
Hello,Traders!
GBP-CHF formed a H&S
Pattern and now we are
Seeing a strong bearish
Breakout of the neckline
Key level around 1.0933
Area and as the breakout
Is confirmed we will be
Expecting a further bearish
Move down towards the
Target below around 1.0867
Sell!
Comment and subscribe to help us grow!
Check out other forecasts below too!
Disclosure: I am part of Trade Nation's Influencer program and receive a monthly fee for using their TradingView charts in my analysis.

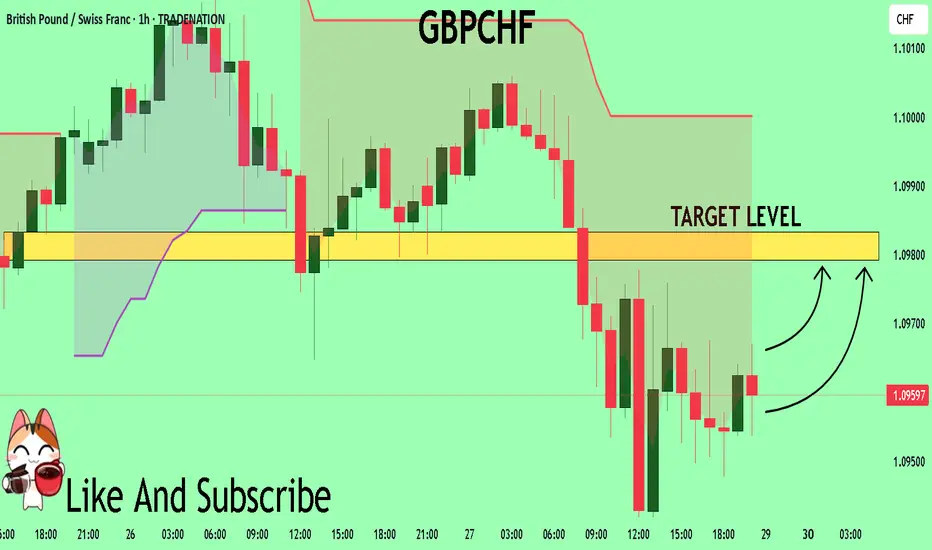
GBPCHF My Opinion! BUY!
My dear followers,
I analysed this chart on GBPCHF and concluded the following:
The market is trading on 1.0911 pivot level.
Bias - Bullish
Technical Indicators: Both Super Trend & Pivot HL indicate a highly probable Bullish continuation.
Target - 1.0951
About Used Indicators:
A super-trend indicator is plotted on either above or below the closing price to signal a buy or sell. The indicator changes color, based on whether or not you should be buying. If the super-trend indicator moves below the closing price, the indicator turns green, and it signals an entry point or points to buy.
Disclosure: I am part of Trade Nation's Influencer program and receive a monthly fee for using their TradingView charts in my analysis.
———————————
WISH YOU ALL LUCK

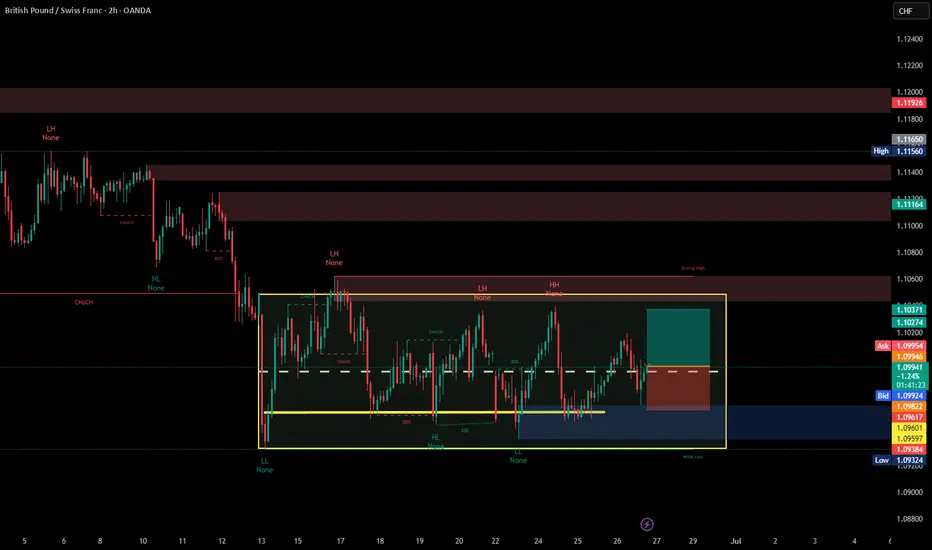
GBPCHF BuyStrong Sell-Off Previously:
The chart shows a sharp downtrend, confirmed by a Change of Character (CHoCH) marking a shift from bullish to bearish structure.
Multiple Lower Highs (LH) and Lower Lows (LL) further validate the downtrend.
Support Zone Identified:
The area marked in blue (buy zone) is a strong demand zone.
It's located at the range low where price has repeatedly tested and rejected (highlighted by Equal Lows (EQL)), suggesting strong liquidity and accumulation.
Shift in Market Structure:
Near the buy zone, a Break of Structure (BOS) and another CHoCH hint at a shift from bearish to bullish sentiment.
The price forms a Higher Low (HL), indicating buyers are gaining strength.
Risk/Reward Favorable:
The long position is placed within the demand zone.
The reward area (green box) is positioned towards the next resistance zone, aligning with a favorable risk/reward ratio.
BUY GBPCHFGBPCHF has found a strong demand zone previously tested . Price will reverse from this area.
Buy 1,09555
Target 1,104

GBPCHF Is Bearish! Sell!
Here is our detailed technical review for GBPCHF.
Time Frame: 4h
Current Trend: Bearish
Sentiment: Overbought (based on 7-period RSI)
Forecast: Bearish
The market is trading around a solid horizontal structure 1.100.
The above observations make me that the market will inevitably achieve 1.091 level.
P.S
We determine oversold/overbought condition with RSI indicator.
When it drops below 30 - the market is considered to be oversold.
When it bounces above 70 - the market is considered to be overbought.
Disclosure: I am part of Trade Nation's Influencer program and receive a monthly fee for using their TradingView charts in my analysis.
Like and subscribe and comment my ideas if you enjoy them!

GBPCHF Will Go Higher From Support! Buy!
The market is on a crucial zone of demand 1.097.
The oversold market condition in a combination with key structure gives us a relatively strong bullish signal with goal 1.100 level.
P.S
Please, note that an oversold/overbought condition can last for a long time, and therefore being oversold/overbought doesn't mean a price rally will come soon, or at all.
Disclosure: I am part of Trade Nation's Influencer program and receive a monthly fee for using their TradingView charts in my analysis.
Like and subscribe and comment my ideas if you enjoy them!

GBPCHF Technical Analysis! BUY!
My dear subscribers,
GBPCHF looks like it will make a good move, and here are the details:
The market is trading on 1.0959 pivot level.
Bias - Bullish
Technical Indicators: Both Super Trend & Pivot HL indicate a highly probable Bullish continuation.
Target - 1.0979
About Used Indicators:
The average true range (ATR) plays an important role in 'Supertrend' as the indicator uses ATR to calculate its value. The ATR indicator signals the degree of price volatility.
Disclosure: I am part of Trade Nation's Influencer program and receive a monthly fee for using their TradingView charts in my analysis.
———————————
WISH YOU ALL LUCK
GBP-CHF Rebound Ahead! Buy!
Hello,Traders!
GBP-CHF is hovering above
The wide horizontal demand
Level around 1.0926 from
Where we are already
Seeing a bullish rebound
So a further local bullish
Move up is to be expected
Buy!
Comment and subscribe to help us grow!
Check out other forecasts below too!
Disclosure: I am part of Trade Nation's Influencer program and receive a monthly fee for using their TradingView charts in my analysis.

GBPCHF bearish for the week of 30 JuneI am planning to short GBPCHF next week. A Head and shoulder pattern in an existing bearish move signifies a continuation. My trade will be executed on H1 time frame with confluence factors that support a bearish continuation.
A break below the neck line and pull back followed by a strong bearish candle would be ideal.
This is not a trade recommendation; it’s merely my own analysis. Trading carries a high level of risk so carefully managing your capital and risk is important. If you like my idea, please give a “boost” and follow me to get even more.
It’s not whether you are right or wrong, but how much money you make when you are right and how much you lose when you are wrong – George Soros

Retail is 86% Long on GBPCHF… But Smart Money Is Setting a Trap📊 1. RETAIL SENTIMENT
Long Positions: 86% – Average Entry: 1.1196
Short Positions: 14% – Average Entry: 1.0999
Current Price: 1.1010
Analysis:
Retail positioning is heavily skewed towards longs, with the average long entry significantly above the current market price. This creates vulnerability to downside pressure through stop-loss hunting or a bearish squeeze. Such extreme retail bias often acts as a contrarian signal: smart money may continue pushing the price lower to flush out retail traders before any meaningful reversal occurs.
🧾 2. COMMITMENTS OF TRADERS – COT REPORT (June 10, 2025)
🔹 British Pound (GBP)
Non-Commercials (Speculators): Net Long increasing by +7.4K → now at +51.6K
Commercials (Hedgers): Net Short decreasing by -13.9K → now at -60.5K
Total Open Interest: Decreased by -19K
Interpretation:
Speculators are maintaining strong long exposure on GBP, while commercials are covering some shorts—potentially signaling a short-term pause in bullish momentum. However, the drop in overall open interest suggests possible consolidation or short-term uncertainty.
🔹 Swiss Franc (CHF)
Non-Commercials: Net Shorts reduced by -2.7K
Commercials: Net Longs increased by +2.5K
Total Open Interest: Increased by +5.6K
Interpretation:
The CHF is gaining strength. Commercial participants are increasing their long exposure while speculators reduce their shorts—this positive divergence supports a bullish outlook on CHF, especially against retail-heavy long pairs like GBP.
📈 3. CHF SEASONALITY – JUNE
Average CHF Performance in June:
20-Year Avg: +0.0099
15-Year Avg: +0.0138
10-Year Avg: +0.0099
5-Year Avg: +0.0039
Analysis:
Historically, June is a seasonally strong month for the Swiss Franc. This seasonal bias aligns with current macro conditions, reinforcing the bullish case for CHF.
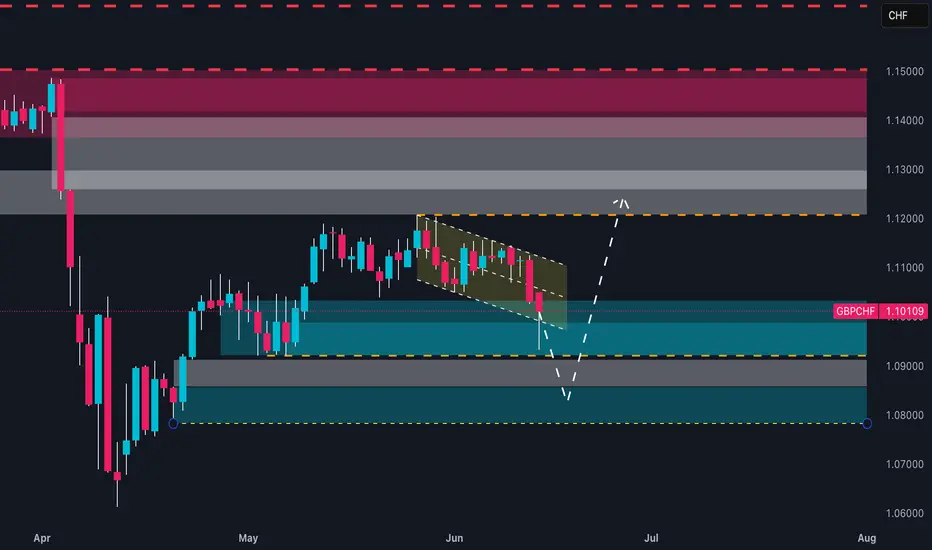
📊 4. TECHNICAL ANALYSIS (Daily Chart)
Pattern: Descending channel with a recent false breakdown and re-entry
Key Support Zone: 1.0980–1.1000 → tested and defended with a bullish wick
Target Resistance: 1.1170–1.1200 → prior retail cluster, supply zone, and average long entry
Scenario: A confirmed breakout of the channel could trigger a short squeeze toward 1.1170–1.1200
📌 STRATEGIC OUTLOOK
The current GBP/CHF setup is technically and sentimentally delicate. The price sits on a major daily demand zone, while sentiment and macro flows suggest downside pressure remains in play—but also allow room for a potential contrarian rally (short squeeze).
👉 Action Plan:
Wait for intraday/daily confirmation:
Go long above 1.1045 (breakout confirmation) → target 1.1170
Go short below 1.0980 (bearish continuation) → target 1.0860
GBPCHF Buy Trade IdeaHello Traders
In This Chart GBPCHF HOURLY Forex Forecast By FOREX PLANET
today GBPCHF analysis 👆
🟢This Chart includes_ (GBPCHF market update)
🟢What is The Next Opportunity on GBPCHF Market
🟢how to Enter to the Valid Entry With Assurance Profit
This CHART is For Trader's that Want to Improve Their Technical Analysis Skills and Their Trading By Understanding How To Analyze The Market Using Multiple Timeframes and Understanding The Bigger Picture on the Charts

Rectangle ChannelHey traders, here’s one to watch closely 👇
GBPCHF is consolidating in a rectangle channel structure, marked by clear highs and lows — a classic coiled spring waiting for resolution.
📌 Key Notes:
Price has respected horizontal boundaries repeatedly
We’ve now broken above the top of the range with a reaction off point D
Both upside and downside breakouts remain valid — the key is confirmation
🔍 What to Watch:
A surge in volume and close above 1.10142 or below 1.09510 will confirm breakout direction
Fibs projected from XA and ABCD legs show both upside and downside targets
Range extension levels already plotted for reference
No prediction. Just structure and breakout readiness.
— C. Dela | #TradeChartPatternsLikeThePros.
