EUR-GBP Local Long! Buy!
Hello,Traders!
EUR-GBP keeps moving
Down but I don't see any strong
Bearish pressure and so as the
Pair is about to retest a horizontal
Support level around 0.8435
We will be expecting a local
Bullish rebound and a move up
Buy!
Comment and subscribe to help us grow!
Check out other forecasts below too!
Disclosure: I am part of Trade Nation's Influencer program and receive a monthly fee for using their TradingView charts in my analysis.
GBPEUR trade ideas

EUR_GBP POTENTIAL LONG|
✅EUR_GBP will be retesting a support level of 0.8428
From where I am expecting a bullish reaction
With the price going up but we need
To wait for a reversal pattern to form
Before entering the trade, so that we
Get a higher success probability of the trade
LONG🚀
✅Like and subscribe to never miss a new idea!✅
Disclosure: I am part of Trade Nation's Influencer program and receive a monthly fee for using their TradingView charts in my analysis.

EUR/GBP DESCENDING TRIANGLE BEARISH PETTERNCurrent Price Action: The pair is hovering around 0.8300, with support near 0.8280.
Bearish Confirmation: A sustained break below 0.8478 could target the 55-day EMA at 0.8455, reinforcing the bearish outlook.
Market Sentiment: The broader trend suggests that the rise from 0.8221 may have completed, meaning further downside movement is possible.
Technical Indicators: Volume contraction within the triangle indicates weakening bullish momentum, increasing the likelihood of a bearish breakout.
Target Levels: If the breakdown occurs, the next major support lies near 0.8221, which was a previous low.
Trading Strategy
Entry Point: Consider short positions if EUR/GBP breaks below 0.8478 with strong volume confirmation.
Stop Loss: Place stops above 0.8527, which is a key resistance level.
Profit Target: Initial target at 0.8450, with extended downside potential toward

Potential Buy Opportunity on EURGBPReasons I think this pair will rise:
- Price approaching previous resistance turned support.
- Bullish RSI divergence on hourly chart
- RSI Oversold on Hourly
- Potential Trend line confirmation with third touch
- Price may rise as it is in the Fibonacci golden ratio.
What do you think?

EURGBP Will Go Lower From Resistance! Sell!
Here is our detailed technical review for EURGBP.
Time Frame: 9h
Current Trend: Bearish
Sentiment: Overbought (based on 7-period RSI)
Forecast: Bearish
The market is approaching a significant resistance area 0.848.
Due to the fact that we see a positive bearish reaction from the underlined area, I strongly believe that sellers will manage to push the price all the way down to 0.838 level.
P.S
Overbought describes a period of time where there has been a significant and consistent upward move in price over a period of time without much pullback.
Disclosure: I am part of Trade Nation's Influencer program and receive a monthly fee for using their TradingView charts in my analysis.
Like and subscribe and comment my ideas if you enjoy them!

EUR/GBP Short 9th May 25We are currently in a downtrend on the 4H and 1H charts, with some decent movement still left to go before hitting the demand zone at 0.83850.
Once it hits this demand zone I will be looking for a rally or reversal which will likely bring us back to a state of equilibrium.
TRADE IDEA :
SHORT FROM SUPPLY
RISK ENTRY -
ENTRY :0.84927
SL : 0.85113
TP : 0.83858
Like trade will look similar to this but will wait for confirmation on the 15m once price action gets into the supply zone.

EURGBP SHORT FORECAST Q2 W19 D9 Y25EURGBP SHORT FORECAST Q2 W19 D9 Y25
Professional Risk Managers👋
Welcome back to another FRGNT chart update📈
Diving into some Forex setups using predominantly higher time frame order blocks alongside confirmation breaks of structure.
Let’s see what price action is telling us today!
💡Here are some trade confluences📝
✅Weekly order block
✅15' order block
✅Intraday bearish breaks of structure
✅Tokyo ranges to be filled
🔑 Remember, to participate in trading comes always with a degree of risk, therefore as professional risk managers it remains vital that we stick to our risk management plan as well as our trading strategies.
📈The rest, we leave to the balance of probabilities.
💡Fail to plan. Plan to fail.
🏆It has always been that simple.
❤️Good luck with your trading journey, I shall see you at the very top.
🎯Trade consistent, FRGNT X

Bearish Look for potential Reversal bearish candlestick Patterns formation upon the retest of 1 hour supply zone

EUR-GBP Will Grow! Buy!
Hello,Traders!
EUR-GBP made a retest
Of the wide horizontal
Support area around 0.8458
From where we are already
Seeing a bullish rebound
So we are locally bullish
Biased and will be expecting
A further bullish move up
Buy!
Comment and subscribe to help us grow!
Check out other forecasts below too!
Disclosure: I am part of Trade Nation's Influencer program and receive a monthly fee for using their TradingView charts in my analysis.

uptrendThe price is expected to stabilize above the resistance level and then begin an upward trend. Otherwise, a continuation of the downward trend to the support trend line is possible.


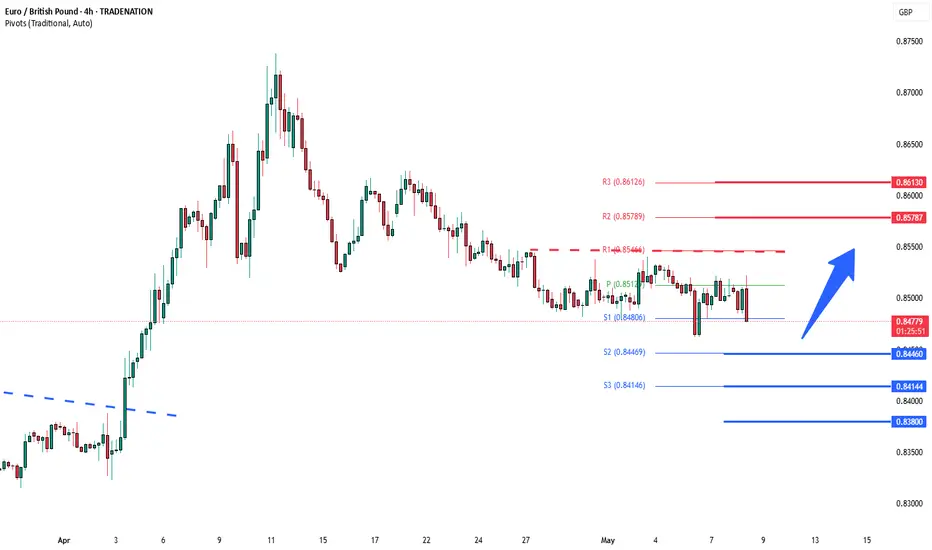
EURGBP INTRADAY range bound - BoE rate decisionTrend: Bullish
Current Price Action: Sideways consolidation within an overall rising trend.
Key Support Level: 0.8446
Key Resistance Levels: 0.8556, 0.8578, 0.8613
Bullish Scenario:
If the price pulls back and finds support at 0.8446, a bounce from this level could trigger a move towards 0.8556, and potentially extend to 0.8578 and 0.8613 in the longer term.
Bearish Scenario:
A confirmed break and daily close below 0.8446 would invalidate the bullish outlook. This could lead to further downside toward the next support levels at 0.8414 and 0.8380.
Conclusion:
The EUR/GBP pair remains in a bullish trend overall. Traders should watch for a reaction at the 0.8446 level—support holding could confirm bullish continuation, while a break below may signal deeper retracement.
This communication is for informational purposes only and should not be viewed as any form of recommendation as to a particular course of action or as investment advice. It is not intended as an offer or solicitation for the purchase or sale of any financial instrument or as an official confirmation of any transaction. Opinions, estimates and assumptions expressed herein are made as of the date of this communication and are subject to change without notice. This communication has been prepared based upon information, including market prices, data and other information, believed to be reliable; however, Trade Nation does not warrant its completeness or accuracy. All market prices and market data contained in or attached to this communication are indicative and subject to change without notice.
EURGBP SHORT FORECAST Q2 W19 D8 Y25EURGBP SHORT FORECAST Q2 W19 D8 Y25
Professional Risk Managers👋
Welcome back to another FRGNT chart update📈
Diving into some Forex setups using predominantly higher time frame order blocks alongside confirmation breaks of structure.
Let’s see what price action is telling us today!
💡Here are some trade confluences📝
✅Weekly order block
✅15' order block
✅Intraday bearish breaks of structure
✅Tokyo ranges to be filled
🔑 Remember, to participate in trading comes always with a degree of risk, therefore as professional risk managers it remains vital that we stick to our risk management plan as well as our trading strategies.
📈The rest, we leave to the balance of probabilities.
💡Fail to plan. Plan to fail.
🏆It has always been that simple.
❤️Good luck with your trading journey, I shall see you at the very top.
🎯Trade consistent, FRGNT X

EURGBP: Bearish Forecast & Bearish Scenario
It is essential that we apply multitimeframe technical analysis and there is no better example of why that is the case than the current EURGBP chart which, if analyzed properly, clearly points in the downward direction.
Disclosure: I am part of Trade Nation's Influencer program and receive a monthly fee for using their TradingView charts in my analysis.
❤️ Please, support our work with like & comment! ❤️

Bullish Look for potential Reversal bullish candlestick formation upon the retest of daily demand zone.


EURGBP SHORT FORECAST Q2 W19 D7 Y25EURGBP SHORT FORECAST Q2 W19 D7 Y25
Professional Risk Managers👋
Welcome back to another FRGNT chart update📈
Diving into some Forex setups using predominantly higher time frame order blocks alongside confirmation breaks of structure.
Let’s see what price action is telling us today!
💡Here are some trade confluences📝
✅Weekly order block
✅15' order block
✅Intraday bearish breaks of structure
✅Tokyo ranges to be filled
🔑 Remember, to participate in trading comes always with a degree of risk, therefore as professional risk managers it remains vital that we stick to our risk management plan as well as our trading strategies.
📈The rest, we leave to the balance of probabilities.
💡Fail to plan. Plan to fail.
🏆It has always been that simple.
❤️Good luck with your trading journey, I shall see you at the very top.
🎯Trade consistent, FRGNT X

EURGBP - LongFrom a weekly standpoint EURGBP seems to be looking to be headed to the upside from my analysis. It has bounced of the 0.82850 price 3 times previously which acted as a strong support and in recent weeks has broken the 0.84800 price, rallied to 0.87300 and has retraced back to the 0.84800 range and is looking to ultimately head up to the 0.89000 price which has previously acted as strong resistance. I will be monitoring price to see how the current weekly candle closes, then head to the lower timeframes to look for the perfect buy entry. A weekly close above 0.84870 will act as my confirmation but all we need to do is wait and see what the market gives us. Please share your thoughts on this analysis provide your insights as well. Thanks

EUR/GBP Potential Bullish MoveHi Traders.
We see after a clear bullish impulse this pair is in a bigger correction right now. but slowly we see some bullish reversal signs. but for the last confirmation wait for the breakout out of the structure followed by some LTF correction to confirm this setup.

$EURGBP Interesting technicalsOANDA:EURGBP Interesting technical idea on this cross. Rejecting from a previous weekly level with a pinbar on the daily. Nice intraday level at .382 fib with a good target. Will need managed on an intraday timeframe.

EUR/GBP : Potential Short Opportunity !!Hey guys,
As you can see on the chart, price broke a major support zone and now we’re in the retest phase.
Price is showing bearish intent and could continue lower.
TP 1: 0.84733
TP 2: 0.84457
Not financial advice.

EUR/GBP Wedge Breakout (06.05.2025)The EUR/GBP Pair on the M30 timeframe presents a Potential Selling Opportunity due to a recent Formation of a Wedge Breakout Pattern. This suggests a shift in momentum towards the downside in the coming hours.
Possible Short Trade:
Entry: Consider Entering A Short Position around Trendline Of The Pattern.
Target Levels:
1st Support – 0.8476
2nd Support – 0.8463
🎁 Please hit the like button and
🎁 Leave a comment to support for My Post !
Your likes and comments are incredibly motivating and will encourage me to share more analysis with you.
Best Regards, KABHI_TA_TRADING
Thank you.

EURGBP, Bullish Trend, 68% fib Retracement, seasonalityBullish DIvergence
68% fib retracement completed
Sideways consolidation breakout and retest completed
EUR is fundamentally bullish whle rate cut is expected in GBP
Seasonality of GBP is bearish indicating bullish momentum in EURGBP
