Elliot wave Analysis - GBPINRwave 1 started from a significant low marked on chart,
wave 2 retraced to reach 50% level of wave 1 with a simple zig zag correction!!
GBPINR trade ideas

1H GBPINR 08.03.2020FX_IDC:GBPINR
1W and 1D chart interpretation are analysed in linked idea:
Continuation to 1W and 1D charts, 1H chart based trade setup is as follows
Trade Setup:
Time frame : 1H
Position type: Long
Entry: Upon price action retracing to "1H validated uptrend" line
Target 1: Until close below "1H validated uptrend" line in 1H chart
Stop loss: Below the future low at "1H validated uptrend" line.

GBPINR analysis 08.03.2020FX_IDC:GBPINR
1W chart interpretation:
1. Price action closed above the validated red resistance trend
2. Expected resistance around 98.0
3. Next support around 94.0
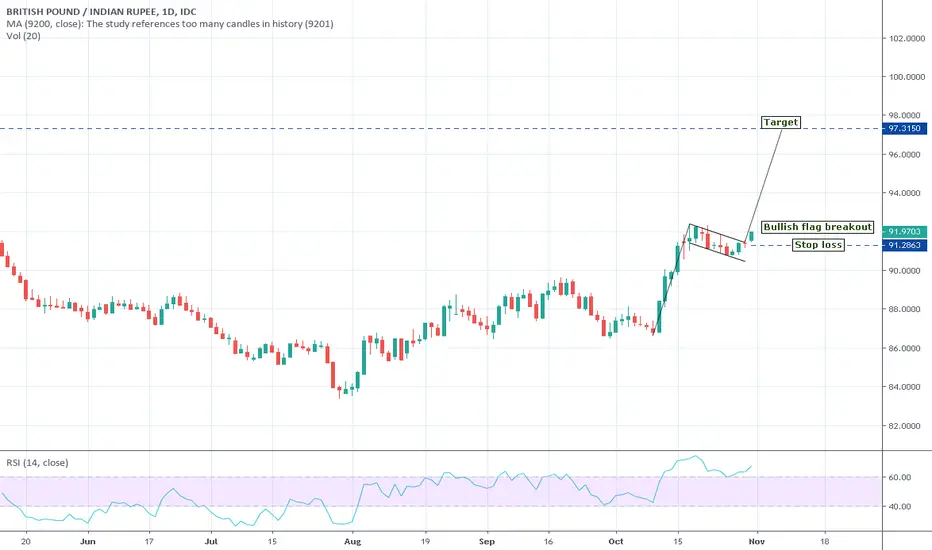
1D chart interpretation:
1. Validated current uptrend line is labelled as "1D current uptrend".
Trade Setup:
Time frame : Day
Position type: Long
Entry: Upon price action retracing to "1D current uptrend" line
Target 1: 98.0
Target 2: Upon weekly close above 98.9
Stop loss: 1.0 point below the future low at "1D current uptrend" line.


GBPINR ANALYSIS 04.01.2020FX_IDC:GBPINR
Daily chart interpretation 04.01.2020
1. Trend is Bullish inside recent green channel.
2. Price inside the green channel is under correction.
3. Correction trend is predicted to be inside yellow channel or blue channel.
4. Yellow channel is conforming.
5. Blue channel is yet to be confirmed and can be deleted if not confirmed.
6. As it is correction to uptrend, short or long positions can be possible opportunities inside correction channels in smaller time frames especially 1H.
7. Recent candles 30.12.2019 and 01.01.2020 inside the rectangle have tested resistance of yellow correction channel and are trending down.
8. Last candle on 03.01.2019 is blue candle which implies recent support. It can be used to spot correction to downtrend in 1H time frame and decide on entry and exit.
Hourly chart interpretation
Hourly chart interpretation
1. Interpretation of price action inside the yellow and blue major correction channels spotted in daily chart.
2. Price is under correction to downtrend and based on 03.01.2020 support candle spotted on daily chart, correction channel is expected to be inside dark blue channel.
3. Based on price action the downtrend is spotted inside the red channel. However it shall be confirmed only when the price breaks below dark blue correction channel.
Trade setup in Hourly chart
Position type: Sell
Entry: Break below dark blue correction channel
Target: Support trend line of yellow / blue / green channels spotted in daily chart (approx 92.0).
Stop loss: Above recent high

Flag breakout and retest in GBPUSDBullish flag breakout and retest in GBPUSD along with support of lower band of channel.

It seems bull overall this yearOverall it is most likely to go up during this year, Already bought this pair and waiting for another buy at 50% retracement on perfect setups.


GBPINR is looking for 81.00 level as support GBPINR is expected to continue bearish for couple of next days
I am looking for next level as 81.00 to see the GBP will resist before going down further

short @ 88As exit polls suggest victory for bjp expect rupee to trade stronger
so there can be a shorting opprtunity below support @ 88 in coming days

Consolidation before the Down moveGBPINR seems to have finished the corrective structure now and is on its way down. There is a possibility that the pair will consolidate towards the upside before the continuation of the down move. Waiting for a consolidation now...

Complex Correction- Next Leg, down move GBPINR is in a complex corrective structure. The sub waves have been color coded for ease of spotting them. The next move could be a down move to finish the C wave of the current structure in making. On the 1 hour time frame, I guess there's one move down. AS the structure develops, we get a clearer picture.

GBPINR TradesGBPINR Trades using Blue Sky Plus Indicator. Message to get a free trial of the indicator.

GBPINR - A HALF FORMED CYPHER.With warning and observation purpose: not well formed. target after 1/3 to 2/3.


nearing support area eye bounce for 99 or 94 then down hsclose to support area... how far retrenchment will determine next swing


Bullish momentum on GBPINRTenkan Sen has crossed Kijun Sen it an entry point for investors seeking alpha
CAUTION: Risk averse people you may wanna wait till the candle stick position themselves on top of the kumo but don't expect to achieve over and above ROI

Long GBP INR Long GBP-INR,
With a bullish engulfing candle the Trade had been set to make new highs but i fear a narrow wedge over long period of time hence to stay short after a point
Support near 82.48 region
Target: near 84.76 - 84.78
