GBP/JPY Bullish Flag (25.06.2025) The GBP/JPY pair on the M30 timeframe presents a Potential Buying Opportunity due to a recent Formation of a Bullish Flag Pattern. This suggests a shift in momentum towards the upside and a higher likelihood of further advances in the coming hours.
Possible Long Trade:
Entry: Consider Entering A Long Position around Trendline Of The Pattern.
Target Levels:
1st Resistance – 198.46
2nd Resistance – 199.00
🎁 Please hit the like button and
🎁 Leave a comment to support for My Post !
Your likes and comments are incredibly motivating and will encourage me to share more analysis with you.
Best Regards, KABHI_TA_TRADING
Thank you.
Disclosure: I am part of Trade Nation's Influencer program and receive a monthly fee for using their TradingView charts in my analysis.
GBPJPY trade ideas

GBPJPY: Bullish Impulse May Take Price To 205! 700+ Pips MoveGBPJPY is in steady bullish move in other words it is in impulse move; price has not yet exhausted and there is still extended bullish move to completed before bears takes control over. Please use accurate risk management while trading and do your own analysis.
LIKE
COMMENT
SHARE
Good luck.
Team Setupsfx_

GBP/JPY Triangle Breakout (25.06.2025)The GBP/JPY Pair on the M30 timeframe presents a Potential Selling Opportunity due to a recent Formation of a Triangle Breakout Pattern. This suggests a shift in momentum towards the downside in the coming hours.
Possible Short Trade:
Entry: Consider Entering A Short Position around Trendline Of The Pattern.
Target Levels:
1st Support – 195.96
2nd Support – 195.37
🎁 Please hit the like button and
🎁 Leave a comment to support for My Post !
Your likes and comments are incredibly motivating and will encourage me to share more analysis with you.
Best Regards, KABHI_TA_TRADING
Thank you.
Disclosure: I am part of Trade Nation's Influencer program and receive a monthly fee for using their TradingView charts in my analysis.

GBPJPY Eyes 200 BoJ Dovishness & Bullish UK SentimentGBPJPY pair has staged a decisive breakout from a multi-day consolidation zone, with technical momentum and macro fundamentals aligning in favor of further upside. Price action has respected a bullish continuation structure — a falling wedge followed by horizontal accumulation — and is now pressing toward the psychological 200.00 level. With the Bank of England holding firm on policy and the Bank of Japan maintaining its ultra-loose stance, GBPJPY presents one of the strongest carry trade setups in the market. Here's a breakdown of what’s driving this move and what to watch next:
📈 Current Bias: Bullish
The pair has confirmed a bullish breakout above the 198.80–198.95 resistance zone, targeting higher fib extensions at 199.40 and 200.00. Momentum is clearly on the bulls’ side as GBPJPY follows through on a textbook pattern breakout.
🔍 Key Fundamentals:
Bank of Japan’s Dovish Stance: The BoJ continues to resist any significant tightening, reaffirming yield curve control and negative real yields. This keeps the yen fundamentally weak, especially against higher-yielding currencies.
Bank of England’s Hawkish Hold: Despite global easing signals, the BoE remains cautious and data-dependent, with inflation still sticky in the UK. This underpins GBP strength relative to the yen.
Global Risk Appetite: Strong equity markets, especially the US500 rally, reduce demand for the safe-haven JPY and increase appetite for high-yielding cross pairs like GBPJPY.
⚠️ Risks to the Trend:
Safe-Haven Shocks: Any sudden geopolitical tension (e.g., Middle East, US-China trade rhetoric) may trigger JPY demand and reverse the bullish flow.
Unexpected BoE Dovish Pivot: A surprise in UK inflation or dovish commentary from the BoE could weaken GBP momentum.
JPY Intervention Risks: With the yen near historically weak levels, any threat or action from Japan’s Ministry of Finance or verbal intervention by BoJ officials could spark sudden volatility.
📅 Key News/Events Ahead:
Japan’s Tankan Survey (June 30): May influence BoJ tone.
UK Final Manufacturing PMI (July 3): A key gauge for growth momentum.
BoE Governor Bailey Speech (July 5): Any hints on policy trajectory will be market-moving.
US NFP & Global Risk Sentiment: Impacts broader carry trade appetite.
⚖️ Leader or Lagger?
GBPJPY is a leader — it often acts as the flagship pair for carry trade demand. Moves in GBPJPY frequently guide sentiment across other JPY pairs like CADJPY, AUDJPY, and NZDJPY, especially when driven by macro divergences. Its high beta to risk sentiment also makes it a prime barometer for global financial mood.
🎯 Conclusion:
GBPJPY has momentum, macro divergence, and a clean technical setup on its side. The breakout above consolidation favors a continued rally toward 199.40 and possibly 200.00. While geopolitical or policy shocks remain risks, the current backdrop supports staying bullish while above the 197.65 invalidation level.

GBPJPY: A Short-Term Bullish OutlookGBPJPY: A Short-Term Bullish Outlook
This move is more related to the BOJ’s uncertainty about rising inflation, and the Bank of Japan is not taking further actions.
On the other hand, one day the BOJ says it will raise interest rates again, and the next day it says the opposite. They are losing credibility.
However, the BOJ is not good at keeping its promises and does not want to make the yen stronger anytime soon.
GBPJPY created a new record high, confirming a new upward move. If the price manages to maintain this pattern, the rise should become clearer and exhibit bullish momentum.
Key target areas: 198.90; 190.40 and 200
You may find more details in the chart!
Thank you and Good Luck!
PS: Please support with a like or comment if you find this analysis useful for your trading day
Disclosure: I am part of Trade Nation's Influencer program and receive a monthly fee for using their TradingView charts in my analysis.

GBPJPY H4 XABCD Short at Market TP Below Market🔸Hello traders, let's review the 4 hour chart for GBPJPY. Strong gains off the lows recently, however price getting overextended and expecting reversal later at/near PRZ/D.
🔸Speculative XABCD structure defined by point X 199 point A 188 point B 195.20 point C 186.80 point D/PRZ 198.40/80 .
🔸Currently most points validated, point D/PRZ validated as well.
Short sell at market SL over point D/PRZ TP details see chart
🔸Recommended strategy for GJ traders: Short Sell at Market
SL over point D/PRZ TP1 193.30 TP2 191.00 TP3 188.80.
🎁Please hit the like button and
🎁Leave a comment to support our team!
RISK DISCLAIMER:
Trading Futures , Forex, CFDs and Stocks involves a risk of loss.
Please consider carefully if such trading is appropriate for you.
Past performance is not indicative of future results.
Always limit your leverage and use tight stop loss.

GBPJPY I Intraday Short from Top of the ChannelWelcome back! Let me know your thoughts in the comments!
** GBPJPY Analysis - Listen to video!

GBP/JPY Best Place To Buy Very Clear , Let`s Get This 200 Pips !Here is my 4H T.F Chart and if we check we will see that we have a very good support area very near the price now and we have already a good breakout and the price never retest the broken res and new supp so i`m waiting the price to retest it and give me any bullish price action and then we can buy it and targeting from 100 to 200 pips . and if we have a daily closure below my support then this idea will not be valid .

GBP-JPY Resistance Ahead! Sell!
Hello,Traders!
GBP-JPY keeps growing
In a strong uptrend and
The pair is locally overbought
So after the pair hits the
Horizontal resistance level
Around 199.803 we will
Be expecting a local
Bearish correction
Sell!
Comment and subscribe to help us grow!
Check out other forecasts below too!
Disclosure: I am part of Trade Nation's Influencer program and receive a monthly fee for using their TradingView charts in my analysis.

GBPJPY Potential UpsidesHey Traders, in the coming week we are monitoring GBPJPY for a buying opportunity around 198.100 zone, GBPJPY is trading in an uptrend and currently is in a correction phase in which it is approaching the trend at 198.100 support and resistance area.
Trade safe, Joe.

GBPJPY My analysis on GBPJPY, I'm expecting a reversal after price gets to our zone. Apply proper risk management if you want to follow

GBPJPY sitting at resistance – Is a drop to 193.360 likely?GBPJPY is sitting right at a key daily resistance zone. This is a level where it has struggled to break through and reversed strongly to the downside. So this makes it definitely one to monitor, especially if you’re eyeing potential short setups.
If we start seeing signs that the price is getting rejected here: like long wicks, strong bearish candles, it could be the early indication of another move lower. My focus is on a moderate drop toward the 193.360 area, similar to what we’ve seen in past pullbacks. Nothing too dramatic, just a simple downside play if sellers step in again.
But if we get a strong breakout? That changes everything: it would hint that bulls are taking full control. This area is pretty important and could give us a better idea of where price is headed next.
Just sharing my thoughts on support and resistance, this isn’t financial advice. Always confirm your setups and manage your risk properly.
Disclosure: I am part of Trade Nation's Influencer program and receive a monthly fee for using their TradingView charts in my analysis.

GBPJPY: Let It Come Lower Before It Goes HigherGBPJPY swept the highs, broke structure, and is now giving signs of a clean retracement. There’s a visible FVG just below, and a small liquidity pocket that hasn’t been touched yet.
If price drops into that zone and respects it, we could see a strong bounce that takes us right back into the highs and beyond.
This setup looks like a simple buy-the-dip scenario , but only if the zone reacts cleanly. No rush. Let price come down. Watch for confirmation before thinking long.
Don’t chase it. Let it unfold.

Edge of the Wedge || GBPJPY
Simply Breakout and retest of the Edge of the Wedge
Entry: 198
Tp1: 200
TP2: 202
TP3: 204
SL: 196
A classic trend following setup

GBPJPY Major Resistance Breakout Ahead📈 GBP/JPY Technical Analysis – 4H Time Frame 🔍
GBPJPY has maintained its ascending structure and recently broke above the previous supply zone at 196.900, signaling bullish strength.
🎯 Entry Idea:
Watch for a retracement to the 196.900 zone — now turned potential demand — for a possible long entry.
📌 Technical Targets:
1st Target: 198.600 (key resistance)
2nd Target: 200.000 (psychological resistance level)
The breakout confirms bullish momentum — a clean retest could offer a solid risk-to-reward setup.
💬 Like, follow, and drop your thoughts in the comments!
📢 Join us for more real-time updates and smart trade setups.
— With love,
Livia 😜✨

GBP_JPY WILL GROW|LONG|
✅GBP_JPY made a pullback
From the resistance above just
As we predicted, however, the
Pair made a retest of the horizontal
Support below around 196.500 and
We are already seeing a beautiful
Rebound so as the pair is in the
Uptrend we will be expecting
A further bullish move up
LONG🚀
✅Like and subscribe to never miss a new idea!✅
Disclosure: I am part of Trade Nation's Influencer program and receive a monthly fee for using their TradingView charts in my analysis.

GBPJPY ForecastLooking long up to 200.00 levels then seeking bearish PA to test the June lows. This is only validated on bearish PA on H4 or Daily.

GJ Showing Bearish Pressure.Hi there,
GJ looks bearish on the M30 chart, with a price target of 196.850 and a bias of 196.419.
If the price reverses and breaks through 198.010, that will invalidate the bias.
Happy Trading,
K.
Not trading advice

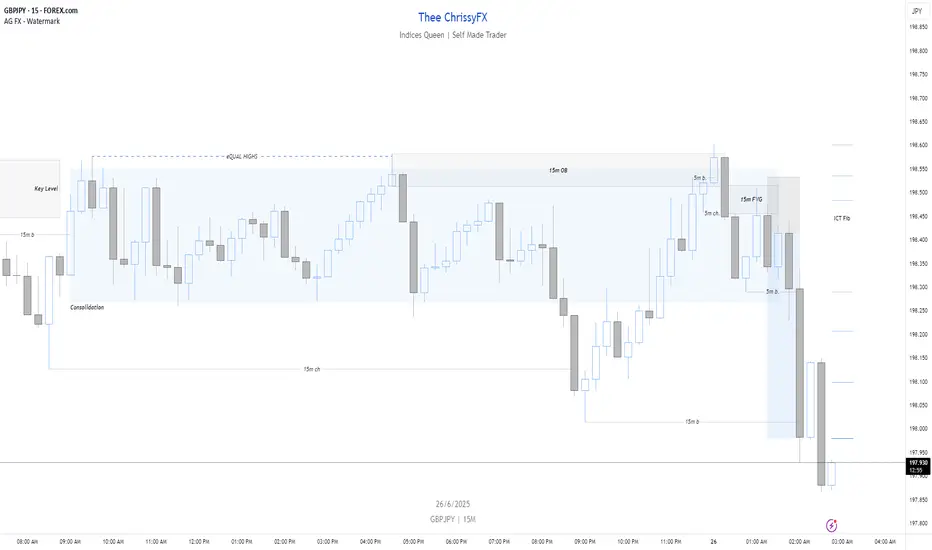
GBPJPY Shorts 6/26/25Priced formed a consolidation on Key Level 198.500 creating eQUAL Highs earlier in the day. Price broke out of the consolidation creating a bearish choch on the 15m timeframe. Price made a steep pull back into the consolidation once more tapping into a 15m OB while also taking out BSL the eQUAL High left behind. Within the 15m OB and key level there was a bearish 5m b/ch which created a 15m FVG. I drew a Fib from the 5m high/low which aligned with the 15m FVG and scaled down to the 1m time frame. From there I waited for a MsS/ch and entered the trade taking profit at the -1 deviation.
#GBPJPY Buy 196.732#GBPJPY Buy 196.732
SL 196.132
TP 196.932
TP 197.732
TP 199.132
Trade at your own risk
Protect your capital
The Wizard 🧙♂️ SWFX

GBP/JPY 4 hr. likely to drop towards 197!Market Sentiment @ 197!
Forex market sentiment can be measured using various tools and indicators. One of the most popular methods of measuring sentiment is using sentiment indicators. These indicators provide insights into market sentiment , such as the percentage of traders who are bullish or bearish on a particular currency.
Forex Sentiment
One of the main advantages of using forex sentiment analysis is that it can help traders make more informed trading decisions. By understanding the overall sentiment of the market, traders can better anticipate price movements, identify potential trading opportunities, and manage risk more effectively.
What is Forex Sentiment?
Forex Sentiment is the feeling or perception of market participants towards a currency pair. It is an essential aspect of forex trading, as it plays a crucial role in determining the direction of the market. Forex sentiment is driven by a wide range of factors, including economic data, geopolitical events, news events, and market trends.
While there are various methods of measuring sentiment, traders should use sentiment analysis in conjunction with other technical and fundamental analysis tools to make informed trading decisions.


GBP/JPY BULLISH BIAS RIGHT NOW| LONG
Hello, Friends!
It makes sense for us to go long on GBP/JPY right now from the support line below with the target of 198.556 because of the confluence of the two strong factors which are the general uptrend on the previous 1W candle and the oversold situation on the lower TF determined by it’s proximity to the lower BB band.
Disclosure: I am part of Trade Nation's Influencer program and receive a monthly fee for using their TradingView charts in my analysis.
✅LIKE AND COMMENT MY IDEAS✅
