#GBPJPY: Buyers and Sellers Both Has Equal Chances! Hey there! So, GBPJPY is at a pivotal moment, and we might see a mix of buying and selling activity in the market. Since the bulls aren’t exactly sure what to do next, here’s what we think:
- The GBPJPY pair is having a tough time breaking through the 194 region. The Japanese yen (JPY) is holding steady, making it hard to predict what will happen next. This has made trading JPY pairs a real challenge.
- Looking back at how prices have behaved in similar situations can give us some clues about what might happen in the future. But it’s important to do thorough research before we start trading. Just because something happened in the past doesn’t mean it will happen again.
- The Japanese yen (JPY) also tends to go down when the US dollar (USD) goes up. Since we’re bullish on the DXY index in the coming days, we think the JPY will probably take a hit, and it could go down a lot. It’s also worth keeping an eye on the GBP, which has been one of the most popular currencies since the market opened earlier today.
- In the meantime, we suggest setting two take-profit targets: one at 197 and another at 199. These levels are likely to see a lot of selling activity.
Now, let’s talk about what sellers should do:
- The price is currently in favour of sellers since it dropped from 195.50 to 193.50. And since the last two daily candles closed with strong bearish volume, it looks like the price is going to keep going down.
- If the price breaks below 190.50, that would be a great opportunity for sellers to make some money.
Good luck and trade safely!
Thank you for your unwavering support! 😊
If you’d like to contribute, here are a few ways you can help us:
- Like our ideas
- Comment on our ideas
- Share our ideas
Team Setupsfx_
❤️🚀
GBPJPY trade ideas

GBPJPY - Monday's Action Could Spark Upside MoveThe GBP/JPY pair is currently positioned at a critical juncture around the 193.902 level, sitting near important support zones that have been highlighted on the chart. The currency pair has shown considerable volatility over the past month, with price action oscillating between well-defined support and resistance levels, creating a clear range-bound structure. As we approach Monday's trading session, the focus will be on whether the current support level can withstand any potential selling pressure. If this support zone holds firm and buyers step in to defend these levels, we could see a significant move to the upside, potentially targeting the upper resistance zone around the 196+ area that has previously capped rallies. The technical setup suggests that a successful defense of support could trigger renewed bullish momentum, making Monday's price action crucial for determining the pair's short-term directional bias and whether it can break out of its recent consolidation pattern.
Disclosure: I am part of Trade Nation's Influencer program and receive a monthly fee for using their TradingView charts in my analysis.

GBPUSD reaches resistance zone: Watching for potential reversalOANDA:GBPJPY has reached a pretty significant resistance level, that has been an obvious turning point in the past, with several strong reversals from the area. So naturally, I’m watching to see how price reacts here again.
If we get confirmation of rejection (what I usually watch for: like a bearish engulfing candle, long upper wicks or signs of increased selling pressure), I’ll be looking for short setups from there.
🟥 My sell idea is based on the expectation that this resistance will hold. I would be targeting a move down toward the 192.000 level, which I feel is a realistic and clean target, especially if price respects this structure again.
But if price breaks above and starts holding strong above the zone, then I’ll back off the bearish bias and reassess, and I’d consider the bearish idea invalidated, with potential for further upside 🚀
Just sharing how I see the chart right now, not financial advice 💕✨

GBPJPY Rejected at Resistance - Bearish Move Ahead?GBPJPY Rejected at Resistance - Bearish Move Ahead?
On the 4-hour chart, GBPJPY tested a strong resistance zone near 196.40, and sellers quickly stepped in.
Over the last 12 hours, the price has moved consistently downward, confirming selling pressure in this area.
The formation of three consecutive red candles on the 4-hour timeframe adds value to the bearish outlook. GBPJPY could decline to 194.20, and possibly even further to 192.40.
⚠️PS: This trade carries high risk due to the uncertain stance of the Bank of Japan (BOJ) policies.
You may find more details in the chart!
Thank you and Good Luck!
❤️PS: Please support with a like or comment if you find this analysis useful for your trading day❤️
Disclosure: I am part of Trade Nation's Influencer program and receive a monthly fee for using their TradingView charts in my analysis.

GBPJPY - Bearish Control, Again!Hello TradingView Family / Fellow Traders. This is Richard, also known as theSignalyst.
📉As per our last GBPJPY analysis (attached on the chart), it rejected the upper red trendline and traded lower.
What's next?
GBPJPY is currently retesting the upper bound of the falling red channel again.
Moreover, the green zone is a strong structure and resistance.
🏹 Thus, the highlighted red circle is a strong area to look for sell setups as it is the intersection of structure and upper red trendline acting as a non-horizontal resistance.
📚 As per my trading style:
As #GBPJPY is around the red circle zone, I will be looking for bearish reversal setups (like a double top pattern, trendline break , and so on...)
📚 Always follow your trading plan regarding entry, risk management, and trade management.
Good luck!
All Strategies Are Good; If Managed Properly!
~Rich
Disclosure: I am part of Trade Nation's Influencer program and receive a monthly fee for using their TradingView charts in my analysis.

GBPJPY Potential UpsidesHey Traders, in the coming week we are monitoring GBPJPY for a buying opportunity around 193.300 zone, GBPJPY is trading in an uptrend and currently is in a correction phase in which it is approaching the trend at 193.300 support and resistance area.
Trade safe, Joe.

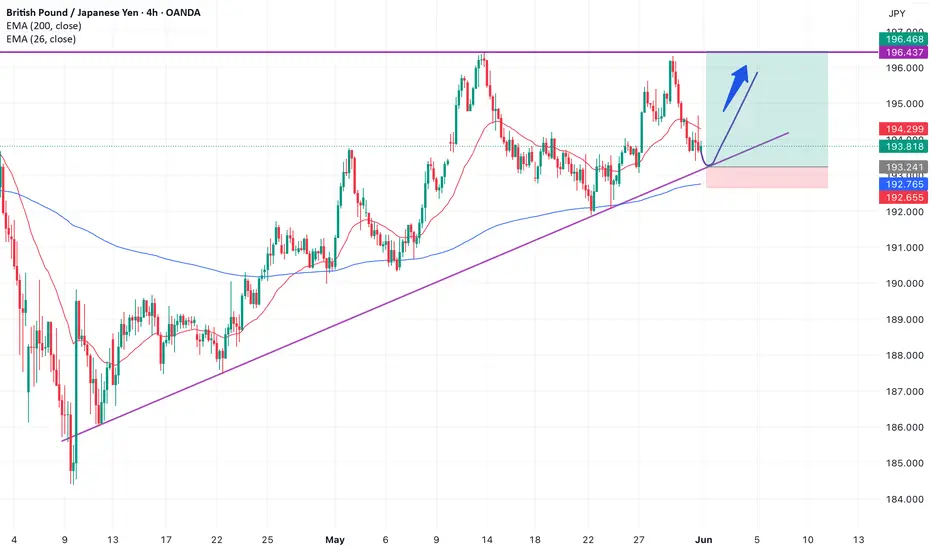
Lingrid | GBPJPY Support Zone Bounce - High Probability SetupFX:GBPJPY is currently retracing after printing a strong higher high just above 196, with the price now approaching the 193.6 support level. A bounce is likely from this minor support or slightly lower, where an upward trendline intersects with the pullback zone. The chart hints at a potential bullish continuation toward the 195.0 target if the structure holds. Momentum will need to reassert quickly to confirm a recovery scenario.
📈 Key Levels
Buy zone: 193.3–193.6
Buy trigger: confirmation bounce above 193.6
Target: 195.0
Sell trigger: breakdown below 193.3
💡 Risks
Failure to reclaim 193.6 support may extend the pullback to 191.9
Bearish momentum from the recent top could overpower rebound attempts
Resistance at 195 could stall further upside even if support holds
Traders, if you liked this idea or if you have your own opinion about it, write in the comments. I will be glad 👩💻

GBP/JPY 4H Chart Analysis – Bullish Channel Setup📈 Trend:
Price is moving in an ascending channel
🔵 Support line below
🔴 Resistance line above
---
Key Zones & Levels:
📍 Demand Zone (Buy Area):
Between 191.753 – 194.016
Price might bounce here before continuing up
🔵 Likely pullback expected here
🎯 Target Point:
202.500
🚀 If price respects the demand zone, this is the upside target
🟢 Entry Point:
Around 193.964 – 194.016
Optimal buying zone before the projected rise
❌ Stop Loss:
Below 191.700
🛑 Placed to minimize losses if price breaks down
---
Indicators:
📉 EMA (70):
Currently at 192.816
✅ Acting as dynamic support
---
Trade Plan Summary:
🔄 Wait for a retracement into the Demand Zone
🛒 Enter long near 193.964
⛔ Stop loss at 191.700
🎯 Target at 202.500

GBPJPY - BEARISH MOVE !Hello Traders !
The GBPJPY failed to create a new higher high!
The price broke the higher low (change of character).
So, I expect a bearish move📉
______________
TARGET: 192.790🎯

GJ shortI’m short from this level at 195.45. Resistance moved sideways and finally intercepted the main trend line of resistance. Price has been rejecting this level. Final TP as of now is 184.9. With the 3 & 6 month candles closing that may change.

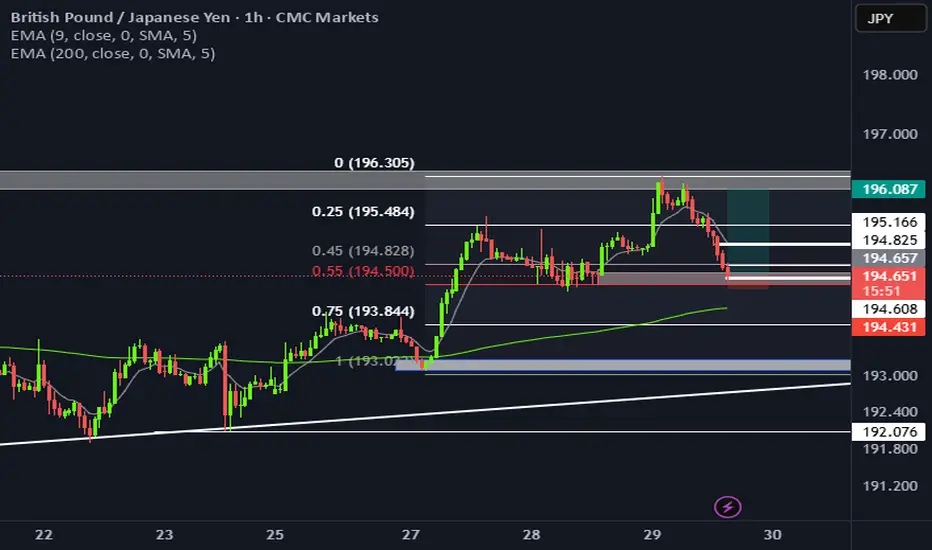
GBP_JPY RISING SUPPORT|LONG|
✅GBP_JPY is trading along the rising support
And as the pair will soon retest it
I am expecting the price to go up
To retest the supply levels above at 194.500
LONG🚀
✅Like and subscribe to never miss a new idea!✅
Disclosure: I am part of Trade Nation's Influencer program and receive a monthly fee for using their TradingView charts in my analysis.

Gbp/jpy analysis According to the chart, we can see that the trend is upward, and we should wait until the price reaches the trendline before buying. It is important to set a stop below the blue line, which represents the 200 EMA."
GBPJPY Long 02/06Price retraced into the 88 fib zone and took buyers liquidity, early in the week for sustained selling and there is still much more significant news to come. The previous week closed bullish albeit with a wick. Anticipating price to fill some of the wick on the weekly. Targets at 195.000.

GBP/JPY Elliott Wave Count Warns of Impending Sell-OffThe GBP/JPY pair has just completed a 5-wave downtrend, which ended around early April. Since then, the price has been moving higher in what appears to be a typical A-B-C corrective pattern — a common move that occurs after a major downtrend in Elliott Wave Theory.
We are currently in the final wave (C) of this correction, and within that, it appears that Wave 5 of C is now unfolding. This final wave appears to be nearing its end, and the price is approaching a strong resistance area between 196.813 and 197.513.
T1: 193.735
T2: 192.133
SL: 198.252
❌ Invalidation Level:
If the price closes above 198.252, this Elliott Wave count is likely wrong. That could mean the market is preparing for a bigger rally instead.

GBP/JPY) Bullish pullback analysis Read The ChaptianSMC trading point update
Tchnical analysis for GBP/JPY (British Pound / Japanese Yen) on the 4-hour timeframe. Here’s a breakdown of the trading idea and structure:
---
Key Technical Elements:
1. Support Zones:
Orderblock Zone (small yellow box near 192.15): Price is currently hovering around this area, which acts as a demand zone.
Main Support Level (larger yellow zone around 190.00): A deeper pullback may test this level if the orderblock fails.
2. EMA 200 (192.167):
Price is fluctuating around the 200 EMA, showing indecision.
A strong bounce above this moving average could indicate bullish momentum resuming.
3. RSI Indicator:
RSI is neutral (~47.80), leaving room for upside movement without being overbought.
4. Projected Price Path:
Two potential bullish scenarios:
A bounce from the orderblock leads straight to a rally.
A deeper dip into the support level forms a double bottom or liquidity grab, followed by a strong reversal.
5. Target Point:
The projection shows price rising to 196.368, which is a prior high and significant resistance.
---
Trade Idea Summary:
Bias: Bullish
Entry Zone:
Primary: Around 192.15 (orderblock)
Secondary (deeper entry): Around 190.00 (support level)
Confirmation: Bullish engulfing candle or strong wick rejection near entry + price reclaiming 200 EMA
Target: 196.368
Invalidation: Break and close below 189.80 (support zone violated)
Mr SMC Trading point
---
Risk Management & Notes:
Good R:R potential if entering near support with a stop below 189.80.
Watch for confirmation before entry — especially if price dips to the lower support.
Macroeconomic events (UK or Japan central bank decisions) could impact volatility.
Pales support boost 🚀 analysis follow)

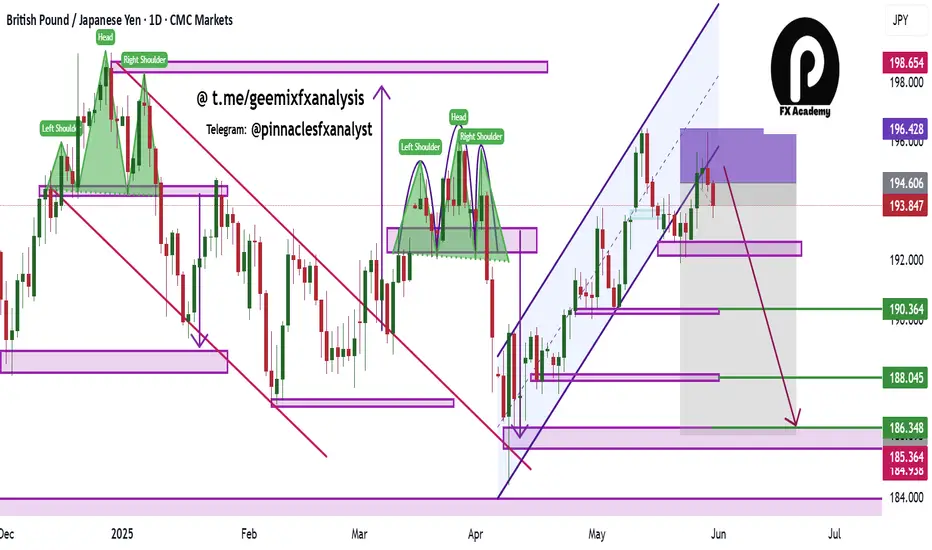
GBP/JPY Daily AnalysisGBP/JPY daily price action has been moving in a descending channel since November 2024.
This month, we have seen price enter the 196.000 zone at the top of the channel. What's also noticeable is the double rejection that has printed.
Here, it's possible that we could see a break down in price and a change of cycle IF we have reached a top again.
However, if we see price continue higher, the idea will be invalidated.
Look for a sell setup that meets your strategy rules if you agree with the analysis.

GBPJPYI believe my analysis will help expose how the price moves in the market. It is clear that the price moves forming different patterns giving hints as to what we could expect next.
The price has been moving in an ascending channel, it got broken and retested, I believe the price will eventually fall towards my arrow head.
GBPJPY - Swing TradeGBPJPY Swing Trade targeting the previous low. Nice 1:4 RR. SL above the weekly sell zone.

Potential bullish rise?GBP/JPY has reacted off the pivot and could rise to the 145% Fibonacci resistance.
Pivot: 194.43
1st Support: 193.80
1st Resistance: 195.61
Risk Warning:
Trading Forex and CFDs carries a high level of risk to your capital and you should only trade with money you can afford to lose. Trading Forex and CFDs may not be suitable for all investors, so please ensure that you fully understand the risks involved and seek independent advice if necessary.
Disclaimer:
The above opinions given constitute general market commentary, and do not constitute the opinion or advice of IC Markets or any form of personal or investment advice.
Any opinions, news, research, analyses, prices, other information, or links to third-party sites contained on this website are provided on an "as-is" basis, are intended only to be informative, is not an advice nor a recommendation, nor research, or a record of our trading prices, or an offer of, or solicitation for a transaction in any financial instrument and thus should not be treated as such. The information provided does not involve any specific investment objectives, financial situation and needs of any specific person who may receive it. Please be aware, that past performance is not a reliable indicator of future performance and/or results. Past Performance or Forward-looking scenarios based upon the reasonable beliefs of the third-party provider are not a guarantee of future performance. Actual results may differ materially from those anticipated in forward-looking or past performance statements. IC Markets makes no representation or warranty and assumes no liability as to the accuracy or completeness of the information provided, nor any loss arising from any investment based on a recommendation, forecast or any information supplied by any third-party.

GBPJPYLong position
- Hit demand zone for the 1hr mark
- exhausted wicks
- overall bullish trend
- buyers potentially stepping in to break through the upper supply zone
GBPJPY BuyPrice is in a bullish trend, a retracement has been made. Currently price is showing a continuation pattern to the upside

GBPJPY update!!Good day traders, I’m back with yet another beautiful setup on GJ and I really wish we can all monitor how price plays out and learn more about price signature.
For this setup I’ll explain more about it after the fact because it’ll help me make my point clearer and easily understandable.
Yet another gift..🎁🧧

GBPJPY What Next? BUY!
My dear subscribers,
This is my opinion on the GBPJPY next move:
The instrument tests an important psychological level 193.34
Bias - Bullish
Technical Indicators: Supper Trend gives a precise Bullish signal, while Pivot Point HL predicts price changes and potential reversals in the market.
Target - 194.37
About Used Indicators:
On the subsequent day, trading above the pivot point is thought to indicate ongoing bullish sentiment, while trading below the pivot point indicates bearish sentiment.
Disclosure: I am part of Trade Nation's Influencer program and receive a monthly fee for using their TradingView charts in my analysis.
———————————
WISH YOU ALL LUCK
