GBPJPY I Weekly CLS I Model 2 I H4 OB entry Hey, Market Warriors, here is another outlook on this instrument
If you’ve been following me, you already know every setup you see is built around a CLS Footprint, a Key Level, Liquidity and a specific execution model.
If you haven't followed me yet, start now.
My trading system is completely mechanical — designed to remove emotions, opinions, and impulsive decisions. No messy diagonal lines. No random drawings. Just clarity, structure, and execution.
🧩 What is CLS?
CLS is real smart money — the combined power of major investment banks and central banks moving over 6.5 trillion dollars a day. Understanding their operations is key to markets.
✅ Understanding the behavior of CLS allows you to position yourself with the giants during the market manipulations — leading to buying lows and selling highs - cleaner entries, clearer exits, and consistent profits.
📍 Model 1
is right after the manipulation of the CLS candle when CIOD occurs, and we are targeting 50% of the CLS range. H4 CLS ranges supported by HTF go straight to the opposing range.
"Adapt what is useful, reject what is useless, and add what is specifically your own."
— David Perk aka Dave FX Hunter ⚔️
👍 Hit like if you find this analysis helpful, and don't hesitate to comment with your opinions, charts or any questions.
GBPJPY trade ideas

GBPJPY I Expect a Rally from the Buy Zone in the 1H Time FrameDescription:
I'm viewing the 195.116–194.845 range on GBPJPY as a strong buy zone. My target is 196.088. Once the trade setup becomes active or the target is reached, I’ll be sharing an update here. Stay tuned!
I meticulously prepare these analyses for you, and I sincerely appreciate your support through likes. Every like from you is my biggest motivation to continue sharing my analyses.
I’m truly grateful for each of you—love to all my followers💙💙💙

GBPJPY Hello traders. A new buy opportunity has emerged on the GBPJPY pair. As you may have noticed, the pair has been rallying non-stop for the past few days, and even on the M15 and M30 charts, it hasn’t offered many pullback opportunities for entries. But it seems that opportunity is finally here. I’ve activated the trade and wanted to share it with you as well.
🔍 Trade Details
✔️ Timeframe: 15-Minute
✔️ Risk-to-Reward Ratio: 1:2.78
✔️ Trade Direction: Buy
✔️ Entry Price: 195.732
✔️ Take Profit: 196.145
✔️ Stop Loss: 195.588
🔔 Disclaimer: This is not financial advice. I’m simply sharing a trade I’ve taken based on my personal trading system, strictly for educational and illustrative purposes.
📌 Interested in a systematic, data-driven trading approach?
💡 Follow the page and turn on notifications to stay updated on future trade setups and advanced market insights.

GBP/JPY 2-Hour Chart - OANDA2-hour price movement of the British Pound (GBP) against the Japanese Yen (JPY) from OANDA, showing a current value of 196.248 with a slight decrease of 0.256 (-0.13%). The chart includes candlestick patterns, a highlighted resistance zone (pink), and a support zone (cyan), with key levels marked at 197.016, 196.348, 195.002, and 194.000. The time frame spans from June 6 to July 3, 2025.

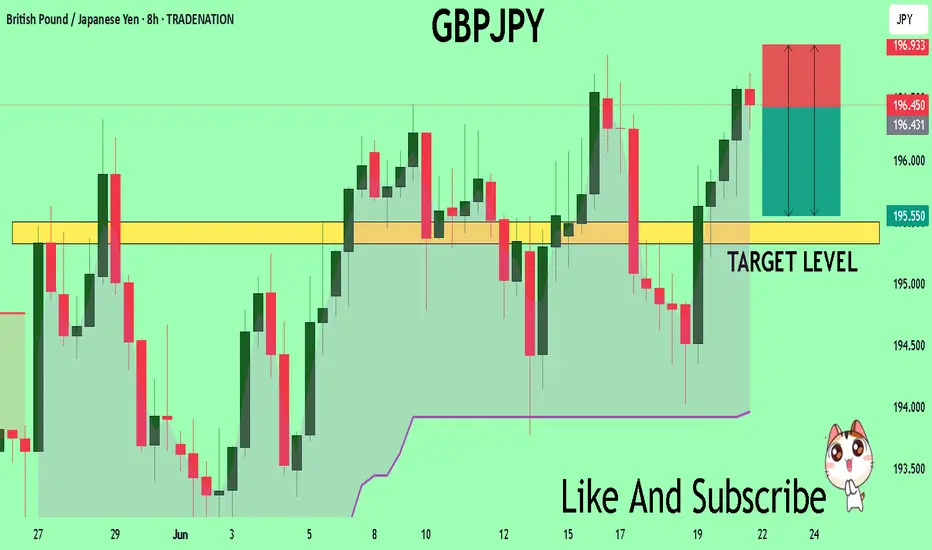
GBPJPY Massive Short! SELL!
My dear subscribers,
This is my opinion on the GBPJPY next move:
The instrument tests an important psychological level 196.43
Bias - Bearish
Technical Indicators: Supper Trend gives a precise Bearish signal, while Pivot Point HL predicts price changes and potential reversals in the market.
Target - 195.50
My Stop Loss - 196.93
About Used Indicators:
On the subsequent day, trading above the pivot point is thought to indicate ongoing bullish sentiment, while trading below the pivot point indicates bearish sentiment.
Disclosure: I am part of Trade Nation's Influencer program and receive a monthly fee for using their TradingView charts in my analysis.
———————————
WISH YOU ALL LUCK
18.06.25 Morning ForecastPairs on Watch -
FX:GBPJPY
FX:EURCAD
FX:CADJPY
A short overview of the instruments I am looking at for today, multi-timeframe analysis down to what I will be looking at for an entry. Enjoy!

GBP/JPY in Trouble? Smart Money Rotates Into Yen📊 1. COT Analysis
JPY (Japanese Yen):
Non-Commercial Net Long: +54,615 – showing strong long accumulation since March.
Recent Changes:
Long: -5,319
Short: +1,235
➡️ Mixed signals short-term, but overall net long positioning remains strong. Speculative funds are still heavily favoring the Yen, suggesting potential continued strength.
GBP (British Pound):
Non-Commercial Net Long: +51,634 (111,076 long – 59,442 short)
Recent Changes:
Long: +7,404
Short: -9,015
➡️ Specs are still net long on GBP, but exposure has slightly decreased. The divergence with the Yen is narrowing.
🔎 COT Summary:
Both currencies are being bought by speculators, but the JPY has shown more consistent long-term positioning. Net momentum appears to shift in favor of Yen strength, pointing to potential downside for GBP/JPY.
📅 2. Seasonality – June
Historically, June is a weak month for GBP/JPY, especially over 20y, 15y, 5y, and 2y windows.
Monthly average return is negative across all major historical timeframes (e.g. -1.2415 over 10 years).
➡️ Seasonality reinforces a bearish bias for June.
🧠 3. Retail Sentiment
Short: 52%
Long: 48%
➡️ Retail positioning is balanced, slightly skewed short. Not a strong contrarian signal, but also doesn’t support a bullish breakout scenario.
📉 4. Technical Analysis
Current Structure: Ascending channel from mid-May → currently testing lower boundary.
Key Zone: 195.600–196.520 is a major supply zone with multiple rejections.
Recent Candle Action: Bearish pin bar + engulfing candle → strong rejection from resistance.
Downside Targets:
First: 193.076
Second: 191.439
Break of the channel would further confirm a trend reversal.
➡️ Price action supports a short scenario with high reward-to-risk toward lower zones.

CHECK GBPJPY SIGNAL READ CAPTAINgbpjpy sell now ✅
entry point (196.600) (196.500)
TAKE PROFIT 1: (196.100)
TAKE PROFIT 2: (195.700)
LAST TARGET (195.200)
STOP LOSS (197.000)

CHECK GBPJPY SIGNAL READ CAPTAINgbpjpy buy now ✅
entry point (195.150) (195.050)
TAKE PROFIT 1: (195.400)
TAKE PROFIT 2: (195.750)
LAST TARGET (196.050)
STOP LOSS (194.700)

GBPJPY Bullish Move
Monthly Chart
Price respected the Major QP (190.00)
Price also formed a Triple Bottom
The previous monthly candle ended as a bullish engulfing
Short MAs are above Longer MAs and price is above both
Sentiment - Look for buys
Weekly Chart
Price found support at he weekly zone and made a bullish push
Price then sold off (retracement) and respected the 38.2 Fib Level and Minor AQ (192.5) before continuing the bullish trend
The price of the previous candle met resistance at the trend line & sold off but ultimately closed respecting the Minor QP (195.000).
This weeks candle found bullish support and closed bullish engulfing
Sentiment - Look for buys
Daily Chart
Price retraced and found support at the 50.0 Fib Level - confirming bullish trend continuation
Expecting price to continue bullish and test the 0.27 Fib, which also aligns with the Daily Supply Zone & Minor AQ (197.500).
Will look to enter long on lower time frame - 1H/2H
1 Hour Chart
Based on the RSI - a bearish divergence is present signaling some bearish pressure
This algins with the daily TF, as I am looking to enter long after a minor retracement on this timeframe.
Expecting to enter a long position near the 50.0-61.8 Fib area.

GBPJPY Bullish Setup: Reversal Brewing a Key Zone📈 **GBPJPY Bullish Setup: Reversal Brewing at Key Zone** 🔍
**Pair:** GBPJPY
**Timeframe:** 15m / 1H Confluence
**Bias:** Bullish (waiting for confirmation)
⚡️ **Key Technical Highlights:**
🔹 **1H Demand Zone** – Price is sitting inside a strong historical reversal area around **194.00–194.20**, where we've seen multiple prior bounces.
🔹 **Trendline Support** – Tapping a clean ascending 1H trendline that has held multiple times.
🔹 **Bullish Divergence (15m RSI)** – Momentum is shifting: while price made a lower low, RSI formed a higher low — classic divergence signaling potential reversal.
🔹 **Descending Channel Forming a Wedge** – Price action is coiling inside a falling wedge. Watching closely for a **bullish breakout** above channel resistance.
🔹 **Wick Rejections / Seller Exhaustion** – Repeated long wicks into the zone indicate sellers are losing steam.
🧠 **Bullish Setup Idea:**
✅ **Trigger:**
Look for a break above **194.80** (channel resistance + 0.0 fib)
Then a **higher low retest entry** near **194.40–194.50**
🎯 **Targets:**
* **TP1:** 195.28 – 195.50 (38.2%–50% fib + intraday resistance)
* **TP2:** 196.00 – 196.42 (78.6%–88.6% fib zone)
* **TP3:** 196.86 – 197.00 (full retracement + supply zone)
🛑 **Invalidation:**
* Break below **193.50 – 193.20** with bearish momentum
* RSI falling below 30 with strong bearish close
💬 Let me know if you're watching this level too — would love to hear your take!
\#GBPJPY #Forex #FXTrading #PriceAction #Divergence #BullishSetup #SmartMoney #SupplyAndDemand #TradingViewIdeas

CHECK GBPJPY SIGNAL READ CAPTAINgbpjpy sell now ✅
entry point (196.500) (196.600)
TAKE PROFIT 1: (196.100)
TAKE PROFIT 2: (195.700)
LAST TARGET(195.200)
STOP LOSS (197.000)

SELL GBPJPYGBP/JPY is showing signs of exhaustion at a key resistance zone (196.600–197.000).**
If bearish confirmation appears, a short opportunity may emerge targeting 194.000–194.500, which is a strong demand area. Watch closely for bearish price action and structure breaks to confirm your setup. Protect your position with a stop above 197.000 if you take the short.

#GBPJPY: 1170+ Massive Sell Opportunity! Get Ready For Big MoveDear Traders,
We have an excellent selling opportunity on GBPJPY, with over 1100+ selling move is likely to occur within next couple of weeks. Please use accurate risk management. For more chart related information read the chart carefully.

#GBPJPY: Buyers and Sellers Both Has Equal Chances! Hey there! So, GBPJPY is at a pivotal moment, and we might see a mix of buying and selling activity in the market. Since the bulls aren’t exactly sure what to do next, here’s what we think:
- The GBPJPY pair is having a tough time breaking through the 194 region. The Japanese yen (JPY) is holding steady, making it hard to predict what will happen next. This has made trading JPY pairs a real challenge.
- Looking back at how prices have behaved in similar situations can give us some clues about what might happen in the future. But it’s important to do thorough research before we start trading. Just because something happened in the past doesn’t mean it will happen again.
- The Japanese yen (JPY) also tends to go down when the US dollar (USD) goes up. Since we’re bullish on the DXY index in the coming days, we think the JPY will probably take a hit, and it could go down a lot. It’s also worth keeping an eye on the GBP, which has been one of the most popular currencies since the market opened earlier today.
- In the meantime, we suggest setting two take-profit targets: one at 197 and another at 199. These levels are likely to see a lot of selling activity.
Now, let’s talk about what sellers should do:
- The price is currently in favour of sellers since it dropped from 195.50 to 193.50. And since the last two daily candles closed with strong bearish volume, it looks like the price is going to keep going down.
- If the price breaks below 190.50, that would be a great opportunity for sellers to make some money.
Good luck and trade safely!
Thank you for your unwavering support! 😊
If you’d like to contribute, here are a few ways you can help us:
- Like our ideas
- Comment on our ideas
- Share our ideas
Team Setupsfx_
❤️🚀

GBPJPY → Assault on the resistance 196.400FX:GBPJPY under the pressure of the bull market breaks through the resistance with the aim of possible continuation of growth and retest of the liquidity zone
Against the background of the dollar growth, the Japanese yen is losing value, which in general may provide support for the currency pair GBPJPY
The currency pair, after a false breakout of the key resistance and a small correction, technically, the bullish structure has not broken. The price returns to the resistance at 196.400 and breaks it. If the bulls hold their defenses above the level, we can expect a rise
Resistance levels: 196.400, 198.24
Support levels: 195.94, 195.45
Consolidation above 196.400, retest and break of 196.93 may trigger continuation of the growth. Zones of interest 198.24, 198.94
Regards R. Linda!

Gbp/jpy short 23/06Price broke the recent swing highand has tapped into daily supply levels. Anticipating a retracement into 196.000 for a retest of the daily zone. Head and shoulders on lowered timeframes retested, and liquidity taken with swift move back below. Jpy is also a safe haven currency and geopolitical tentions rife could cause a drop from this price area.

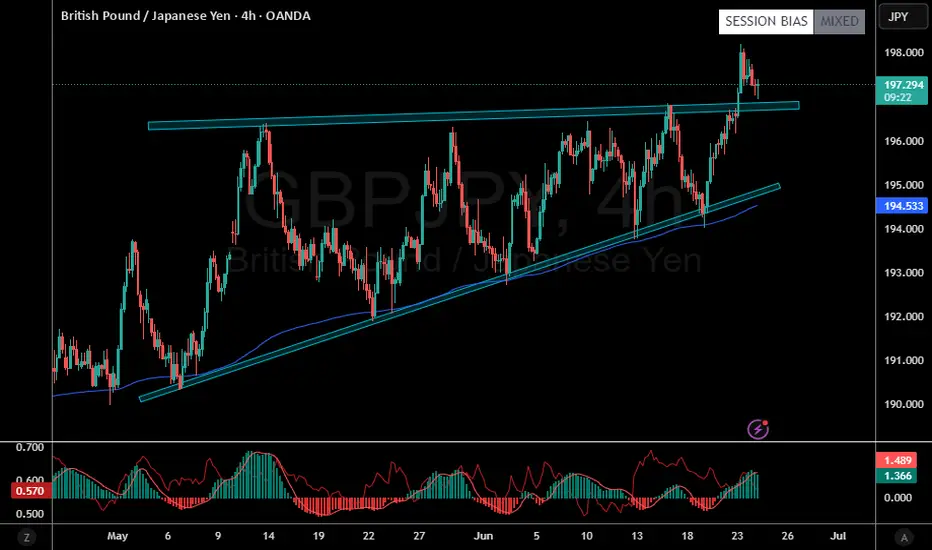
GBP/JPY - Breakout Brewing📊 GBP/JPY – Breakout Imminent?
Price is testing key resistance at the top of the range within this ascending channel.
We’re now at a critical decision point:
📈 A clean breakout above this supply zone could send us flying toward the 198.945 target – aligning with the channel top.
📉 A rejection, however, could trigger a drop back into demand at 192.352, offering a solid buy zone for continuation.
🧠 Patience is key here — wait for confirmation. Either way, volatility is expected next. Be ready. 🚨

GBPJPY Potentially BullishOANDA:GBPJPY has been on a bullish trajectory and with the current breakout to the upside signifying a potential bullish continuation. With this in mind, I will wait to see a proper re-test around the 196.839 and then see a price action confirmation before taking the trade. Until then, fingers crossed.
#GBPJPY
Disclaimer: Past results does not guarantee future results, do your due diligence.
#GBPJPY: 600+ Pips Swing Move, JPY To Drop! GBPJPY has successfully rejected the area previously identified in our analysis of GJ. We had anticipated a price rejection and reversal with a strong bullish impulse, which has materialised. Following the positive candle close on Friday, we anticipate a continuation of the bullish trend and potential reaching of the 200 mark.
When trading, it is crucial to prioritise risk management. Conduct your own analysis and utilise this information solely for educational purposes.
Three potential targets have been identified: 198, 200, and 202. A stop loss can be positioned below our buying zone, as indicated by the black-marked zone.
Your support, expressed through likes, comments, and shares, is greatly appreciated and encourages us to continue providing valuable content.
❤️🚀
Team Setupsfx_

CHECK GBPJPY SIGNAL READ CAPTAINgbpjpy buy now ✅
entry point (194.900) (194.800)
TAKE PROFIT 1: (195.200)
TAKE PROFIT 2: (195.600)
LAST TARGET (196.000)
STOP LOSS (194.400)

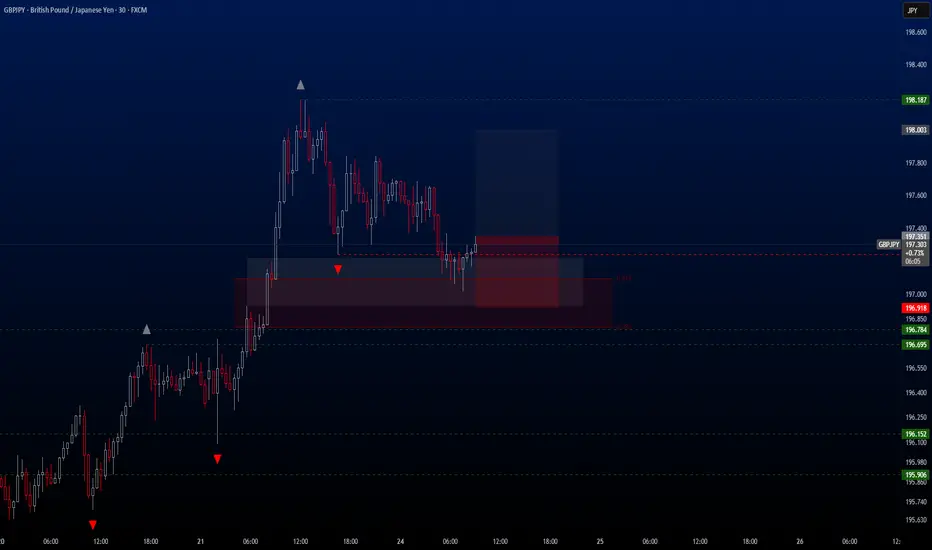
GBPJPY Hello traders.
The first trading opportunity of the day comes from the GBPJPY pair. The bullish scenario on this pair remains intact, and this is largely due to its strong correlation with USDJPY.
For the first time since May 17, USDJPY has climbed back to the 147.00 level, which has triggered momentum across all other JPY-related crosses. GBPJPY is one of the strongest beneficiaries of this movement, and we are now seeing a solid buy setup on the 30-minute chart.
I’ve personally entered the trade and am sharing the full breakdown with you below:
🔍 Trade Details
✔️ Timeframe: 30-Minute
✔️ Risk-to-Reward Ratio: 1:1.50
✔️ Trade Direction: Buy
✔️ Entry Price: 197.351
✔️ Take Profit: 198.003
✔️ Stop Loss: 196.918
🕒 If momentum weakens or the price stalls in a tight range, I will keep this trade open only until 23:00 (UTC+4). After that, I’ll close it manually—whether in profit or loss—depending on how price action evolves.
🔔 Disclaimer: This is not financial advice. I’m simply sharing a trade I’ve taken based on my personal trading system, strictly for educational and illustrative purposes.
📌 Interested in a systematic, data-driven trading approach?
💡 Follow the page and turn on notifications to stay updated on future trade setups and advanced market insights.
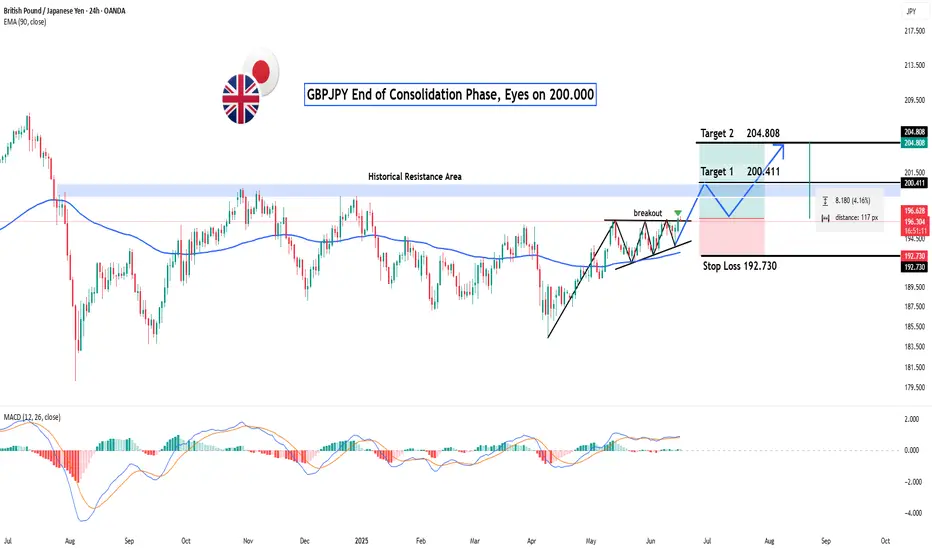
GBPJPY: End of Consolidation Phase, Eyes on 200.000?Hey Realistic Traders!
Could this be the beginning of a major bullish wave ?
Let’s Break It Down..
On the daily timeframe, GBPJPY has formed a Symmetrical Triangle Pattern, followed by a bullish breakout, a classic technical signal that typically marks the end of a consolidation phase and the start of a new bullish trend. This move is further confirmed by the appearance of a strong bullish candlestick, reflecting a surge in buying momentum.
Supporting this bullish scenario, the MACD indicator has also formed a bullish crossover, where the MACD line crosses above the signal line. This crossover is widely regarded as a momentum shift from bearish to bullish, strengthening the case for continued upward movement.
Given these technical signals, the price is likely to advance toward the first target at 200.411, with a potential extension to 204.808.
This bullish outlook remains valid as long as the price holds above the key stop-loss level at 192.730.
Support the channel by engaging with the content, using the rocket button, and sharing your opinions in the comments below.
Disclaimer: "Please note that this analysis is solely for educational purposes and should not be considered a recommendation to take a long or short position on OANDA:GBPJPY ".