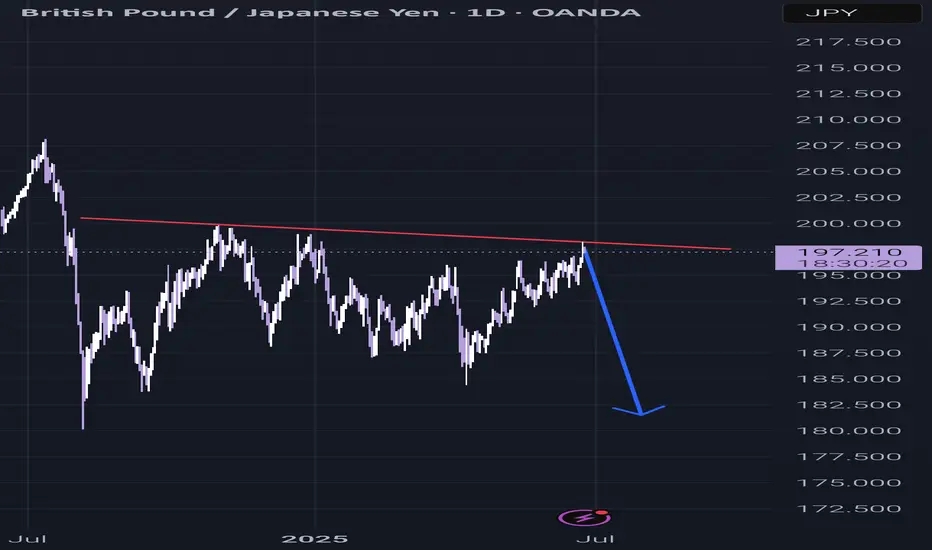
GJ sugar high VS reevesThe sugar high will wear off as the risk on geo tension premium evaporates & the fiscal liability hits from Reeves' autumn budget, it's a 1 to 5 reward and I'm betting the farm, or in my case the seedling! happy hunting
GBPJPY trade ideas

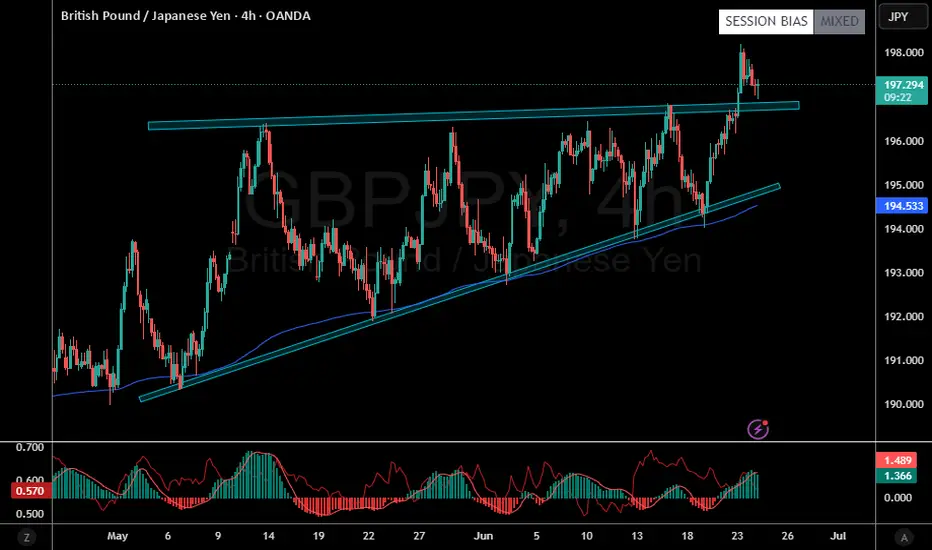
Edge of the Wedge || GBPJPY
Simply Breakout and retest of the Edge of the Wedge
Entry: 198
Tp1: 200
TP2: 202
TP3: 204
SL: 196
A classic trend following setup


GJ Showing Bearish Pressure.Hi there,
GJ looks bearish on the M30 chart, with a price target of 196.850 and a bias of 196.419.
If the price reverses and breaks through 198.010, that will invalidate the bias.
Happy Trading,
K.
Not trading advice

GJ-Wed-25/06/25 TDA-Bullish structure created, more upsidesAnalysis done directly on the chart
Follow for more, possible live trades update!
I often share my live trades in Tradingview public chat in London session, stay tuned!
Knowing when not to trade is as important as taking good trades.
Just like you can take good trades, good wins. Understanding when not
to trade, it can saves you from bad trades and avoidable losses.
Easy to say than done.
Active in London session!
Not financial advice, DYOR.
Market Flow Strategy
Mister Y

GBPJPY Hello traders.
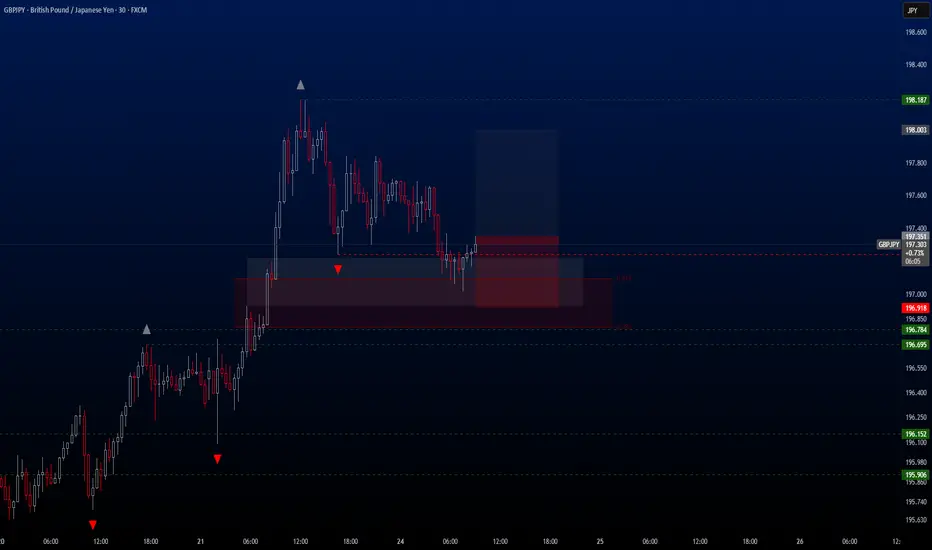
The first trading opportunity of the day comes from the GBPJPY pair. The bullish scenario on this pair remains intact, and this is largely due to its strong correlation with USDJPY.
For the first time since May 17, USDJPY has climbed back to the 147.00 level, which has triggered momentum across all other JPY-related crosses. GBPJPY is one of the strongest beneficiaries of this movement, and we are now seeing a solid buy setup on the 30-minute chart.
I’ve personally entered the trade and am sharing the full breakdown with you below:
🔍 Trade Details
✔️ Timeframe: 30-Minute
✔️ Risk-to-Reward Ratio: 1:1.50
✔️ Trade Direction: Buy
✔️ Entry Price: 197.351
✔️ Take Profit: 198.003
✔️ Stop Loss: 196.918
🕒 If momentum weakens or the price stalls in a tight range, I will keep this trade open only until 23:00 (UTC+4). After that, I’ll close it manually—whether in profit or loss—depending on how price action evolves.
🔔 Disclaimer: This is not financial advice. I’m simply sharing a trade I’ve taken based on my personal trading system, strictly for educational and illustrative purposes.
📌 Interested in a systematic, data-driven trading approach?
💡 Follow the page and turn on notifications to stay updated on future trade setups and advanced market insights.
GBPJPY fromed Symmetrical Triangle Enter on Breakout 🔻 Bias: Bearish
Lower highs and tightening range indicate weakening bullish momentum.
A confirmed break below the 196.345 support could trigger a bearish move.
Downside targets:
TP1: 195.60
TP2: 195.23
🔍 Invalidation:
Bullish breakout above 197.59 would negate this setup and suggest trend continuation.
Strategy: Wait for a clean breakout and retest for confirmation. Use tight SL above the triangle if entering short.

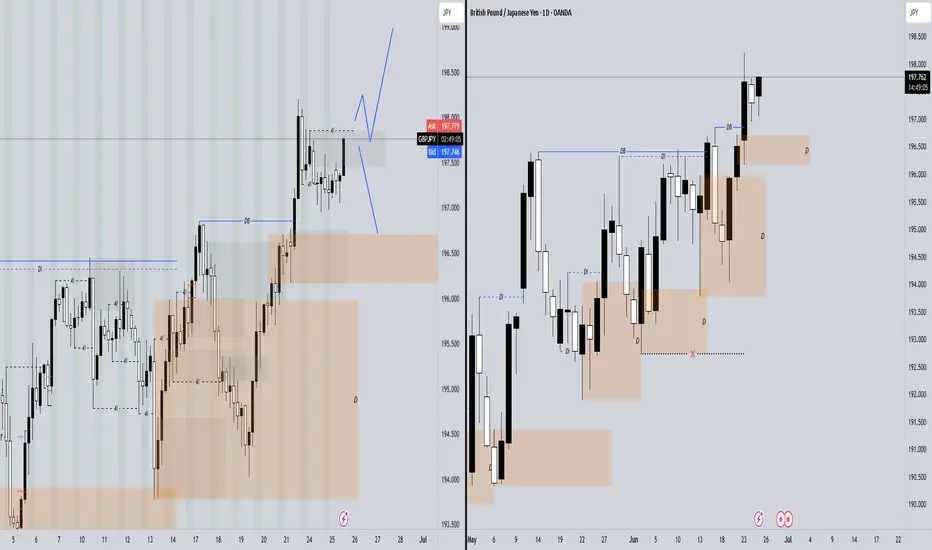
Counter pullback In EU at the moment price is very bullish looking at daily and 4hr time frame. In daily price has managed to break above the weak internal HH so after the break we must expect a counter pullback with LTF confirmation which we can see in 4hr where it has created fresh internal structure so I am expectating price to continue lower from its supply zone. But if price manages to break the structure to bullish I will be looking to buy from the newly formed demand zone.
GBP/JPY Triangle Breakout (25.06.2025)The GBP/JPY Pair on the M30 timeframe presents a Potential Selling Opportunity due to a recent Formation of a Triangle Breakout Pattern. This suggests a shift in momentum towards the downside in the coming hours.
Possible Short Trade:
Entry: Consider Entering A Short Position around Trendline Of The Pattern.
Target Levels:
1st Support – 195.96
2nd Support – 195.37
🎁 Please hit the like button and
🎁 Leave a comment to support for My Post !
Your likes and comments are incredibly motivating and will encourage me to share more analysis with you.
Best Regards, KABHI_TA_TRADING
Thank you.
Disclosure: I am part of Trade Nation's Influencer program and receive a monthly fee for using their TradingView charts in my analysis.

GBPJPY making bullish flag patternafter breaking daily resistance level the price is now retesting it if you open the chart on 1Hr tf you will see that price broke that resistance level with quite strong momentum and is retracing and if it gets a bounce from this level and break the flag pattern strongly then there are high chances that price will meet the price projection of flag pattern as there is no divergence and no other major sign of reversal it seems price action will be bullish

GBPJPY → Assault on the resistance 196.400FX:GBPJPY under the pressure of the bull market breaks through the resistance with the aim of possible continuation of growth and retest of the liquidity zone
Against the background of the dollar growth, the Japanese yen is losing value, which in general may provide support for the currency pair GBPJPY
The currency pair, after a false breakout of the key resistance and a small correction, technically, the bullish structure has not broken. The price returns to the resistance at 196.400 and breaks it. If the bulls hold their defenses above the level, we can expect a rise
Resistance levels: 196.400, 198.24
Support levels: 195.94, 195.45
Consolidation above 196.400, retest and break of 196.93 may trigger continuation of the growth. Zones of interest 198.24, 198.94
Regards R. Linda!

GBPJPY| Midweek OutlookEven though it’s midweek, I wanted to share an update on GBPJPY and walk you through the process so far.
Price has been showing clear bullish structure from the 4H down to the 30M, so I remained patient and waited for price to revisit and mitigate a bullish order block — and that’s exactly what we got.
Now that mitigation has played out, I’m watching closely for LTF confirmations to line up. Ideally looking for entry opportunities around 196.006 – 195.922, depending on how the lower timeframes react and confirm.
Not rushing anything — just executing based on structure, mitigation, and confirmation. I’ll continue updating as price develops.
#GBPJPY #SMC #OrderBlock #SmartMoneyConcepts #PriceAction #ForexTrading #GJSetup #MidweekOutlook #InducementKing #DayTrader
Bless Trading!


Short GJPrice has leave the price value area, from the price action I anticipate that price will go back to the diagonal line.

GBP/JPY 2-Hour Chart - OANDA2-hour performance of the British Pound (GBP) against the Japanese Yen (JPY) from OANDA, covering the period from June 4 to July 3, 2025. The current exchange rate is 197.308, reflecting a slight decrease of 0.364 (-0.18%). The chart highlights a recent upward trend with a notable peak followed by a decline, with key price levels marked at 197.471, 197.308, and 196.024.

GBPJPY Potentially BullishOANDA:GBPJPY has been on a bullish trajectory and with the current breakout to the upside signifying a potential bullish continuation. With this in mind, I will wait to see a proper re-test around the 196.839 and then see a price action confirmation before taking the trade. Until then, fingers crossed.
#GBPJPY
Disclaimer: Past results does not guarantee future results, do your due diligence.
GBPJPY Bullish Momentum AnalysisGBPJPY Bullish Momentum Analysis
The GBPJPY pair is currently under bullish pressure, having broken through key resistance levels suggesting the potential for further upside continuation. This movement is supported by a weakening Japanese yen, driven in part by the continued strength of the US dollar and rising global yields.
Resistance Levels 200.00
Support Levels 196.000
Technically Key resistance and small correction the bullish structure has not broken the price returns break and get there resistance.
You May find more detils in the chart Ps Support with like and comments for more analysis.

Pound-Yen Finds Support with Eyes on 198.1FenzoFx—GBP/JPY is forming bullish long-wick candlesticks near 196.8, just above key support at 196.5.
The market remains bullish above this zone, with potential to retest 198.1. A sustained move higher could extend the rally.
The bullish outlook is invalidated if GBP/JPY closes below 196.5.


GJ-Tue-24/06/25 TDA-Strong resistance area 198.180Analysis done directly on the chart
Follow for more, possible live trades update!
A good advise is always to have understanding of the whole picture,
once you identified the full picture then come down to little details
that shapes the big picture.
Example trading related: understanding the
Higher timeframe structure (htf). This is what
We call the "Top Down Analysis" (TDA).
Once you identified the big picture, you go to
lower timeframe structure (LTF), these are the little details.
Comment down below if you agree or disagree!
Active in London session!
Not financial advice, DYOR.
Market Flow Strategy
Mister Y

GBPJPY Elliott Wave Outlook: Impulse Pattern Approaching EndThe short-term Elliott Wave analysis for GBPJPY indicates that the cycle initiated from the April 9, 2025 low has reached a mature stage. The upward movement is unfolding as a five-wave impulse structure, a hallmark of Elliott Wave theory, signaling a strong bullish trend. Wave 1 concluded at 189.82, followed by a corrective pullback in Wave 2, which found support at 185.98. The subsequent rally in Wave 3, as depicted on the 1-hour chart, peaked at 196.84. Wave 4 then unfolded as a zigzag corrective structure. Its internal subdivisions completing as follows: Wave ((a)) declined to 194.75, and wave ((b)) rebounded to 195.33. Wave ((c)) finalized at 196, marking the completion of Wave 4 in the higher degree.
Currently, GBPJPY has resumed its ascent in Wave 5. From the Wave 4 low, the rally has so far developed in three waves. Wave (i) reached 196.7, followed by a dip in Wave (ii) to 196.09. Wave (iii) extended higher to 198.19. A corrective pullback in Wave (iv) is anticipated to find support within the 196.2–196.8 range, likely in a three-wave structure. Afterwards, one final push higher in Wave (v) should happen to complete Wave ((i)) of 5 in the higher degree. Following this, a larger-degree correction in Wave ((ii)) is expected to retrace the cycle from the June 19, 2025 low. Pullback is likely unfolding in a 3, 7, or 11-swing pattern before the pair resumes its upward trajectory.

SELL GBPJPY (SELL 197.100 , SL 200.100 , TP 194.100)GBPJPY will go down soon. It seems exhausted to go up since yesterday.
GBP/JPY Revisits 198.08All the way back in 2008, around the Financial Collapse, GBP/JPY posted a massive gap on the monthly chart and here we are, more than 16 years later, and that space on the chart continues to loom large.
The August 2008 close at 198.08 led into the September open at 193.61, and over the past couple of weeks those prices have played a big role in GBP/JPY price action, much as they have since last March when that zone finally came back into play when the gap was finally filled in April of last year.
Last week GBP/JPY had set up an ascending triangle formation, with resistance around the 196.50 area and a progression of higher-lows since April and through May and early-June. Bulls defended 193.61 on a pullback last week, and came back with a vengeance to drive a breakout into this week with that 198.08 level coming back into the picture to set the current highs.
If looking for Yen-weakness, I remain of the mind that this could be a more attractive venue than USD/JPY, further illustrated by the sizable pullback showing in the major pair today compared to the move in GBP/JPY. - js
