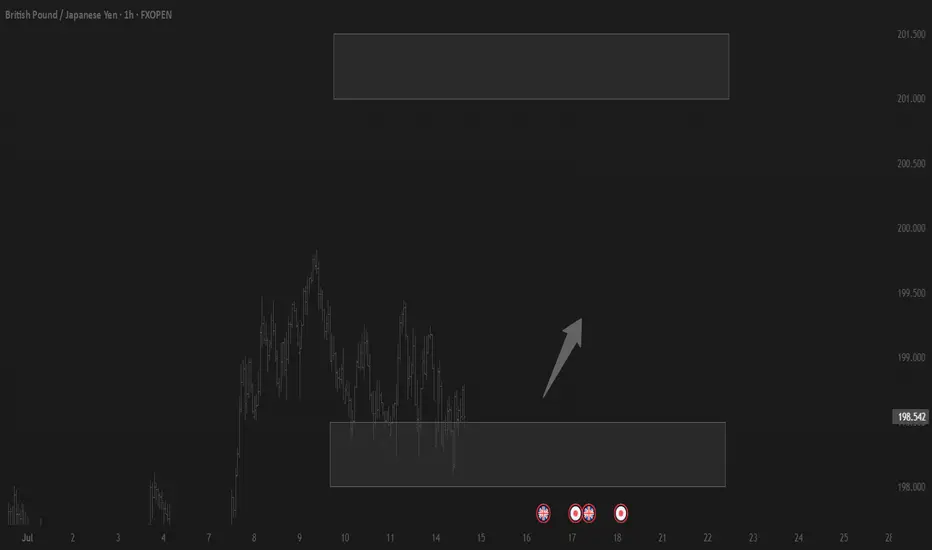
Another Home Run Trade? Risky & Conservative ApproachesFollowing up a MASSIVE win on the OANDA:EURJPY we may now have a similar trading opportunity setting up on the OANDA:GBPJPY
The premise is the same for this one as we're looking at a potential violation of structure followed by a Bullish continuation setup.
In this video, we'll look at where we think price can extend to, what needs to happen before we can make that prediction, and both a risky and conservative technique to get involved in the move.
Please let me know how you would approach this setup!
Akil
GBPJPY trade ideas

GBPUSD SELLFind a nice entry
Place trade based
Ensure risk management based on available funds
This is a 1:12 trade

GBP/JPY At Selling Area , Can We Sell It Now To Get 150 Pips ?Here is my opinion on GBP/JPY , The price at daily res area that forced the price to go down very hard last time and now the price retesting it , i want to see a good bearish price action on 4H T.F To get A Confirmation to can sell and i feel safe , we can enter now a sell trade with small lot size and when we have a good confirmation on bigger T.F We can add another entry , if we have a daily closure above my daily res then this idea will not be valid .

GBP/JPY - Potential TargetsDear Friends in Trading,
How I see it,
PIVOT @ 195.650
Psychological Resistance @ 200.000
1) Daily bull trend intact at this time
2) Resistance has the potential to force a correction
3) As long as price remains above PIVOT, bullish potential
remains high.
Keynote:
Monitor price action at your daily trend closely in case of a correction.
I sincerely hope my point of view offers a valued insight.
Thank you for taking the time to study my analysis.

GBPJPY is still in retracementWe can see from the graph GBPJPY is oscillating between the two S&R levels. For today we expect GJ to touch the demand zone and then go higher. Therefore we can expect GBPJPY in go further down and hit the demand zone because it is still retracing. The possibilities for the GJ are shown.

GBPJPY SELLThe break of the support level on the H4 is complete. Looking at the retest of the broken support for the continuation of the fall

GBPJPY Technical Outlook – July 15, 2025Looking for Impulse up!
GBPJPY has broken out of a classic bullish flag pattern on the 4H chart, signaling a potential continuation of the recent upside momentum. The breakout follows a strong impulse move from the 197.50 area, followed by a brief descending consolidation. Price has now closed above the flag structure, suggesting buyers are regaining control. A short pullback toward the breakout zone is possible before further upside toward the buy-side liquidity near 201.000. Equal highs are also resting just below this level, providing additional confluence for the upside target. As long as price holds above the 198.50–198.80 support area, the bullish outlook remains intact.
This analysis is intended for educational purposes only.
Learn & Earn!
Wave Trader Pro

GBPJPY buy trade hit take profit Congrats to BALE_FX vips membrs
We hit take profit Wednesday last week ...
GBPJPY buy trade profit hit Congratulations to those of us that took this trade we just hit take profit now

GBPJPY is still in pullbackGJ possibilities has been drawn on chart. GJ is in pullback still. It had developed liquidity around S&R Level and has taken. GJ may touch PD high today because it has already taken PD low. It may go towards the demand zone residing below PD low.

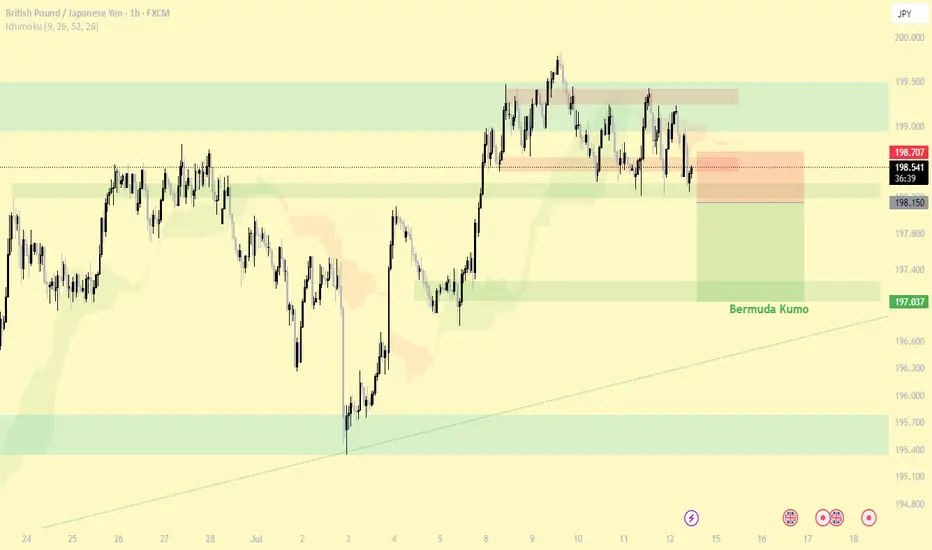
#GBP/JPY Monday 14 Jul 2025Reasons for entering the trade:
1- Breaking the last low of the high and the range area
2- Breaking the 4H support
3- Bermuda Kumo (4H)
Entry: 198.150
TP: 197.037
SL: 198.218
Why election risk means yen volatility could rise this weekThe Japanese yen remains vulnerable ahead of Japan’s Upper House election on July 20.
Polls suggest the ruling LDP-Komeito coalition may lose its Upper House majority. Such an outcome would further weaken Prime Minister Shigeru Ishiba’s position, with his government already operating as a minority in the Lower House.
Adding to the pressure, the U.S. is set to impose 25% tariffs on Japanese goods from August 1—part of a broader protectionist push.
GBPJPY Broke trend line is likely to go downGBPJPY was trending up but recently has broken the trendline support and price is likely to go down after a retest.
GBPJPY Will Grow! Buy!
Here is our detailed technical review for GBPJPY.
Time Frame: 1D
Current Trend: Bullish
Sentiment: Oversold (based on 7-period RSI)
Forecast: Bullish
The market is trading around a solid horizontal structure 198.531.
The above observations make me that the market will inevitably achieve 202.938 level.
P.S
The term oversold refers to a condition where an asset has traded lower in price and has the potential for a price bounce.
Overbought refers to market scenarios where the instrument is traded considerably higher than its fair value. Overvaluation is caused by market sentiments when there is positive news.
Disclosure: I am part of Trade Nation's Influencer program and receive a monthly fee for using their TradingView charts in my analysis.
Like and subscribe and comment my ideas if you enjoy them!

GBP JPY shorti was watching people analyses that I've arrived at an analyze for gbp jpy , the analyze was telling about gbp jpy going up buy i didn't follow , went on my chart and get my idea. the challenge is kinda funny lets see it will go up or down ...

GBP/JPY H4 | Yen weakness to persist?GBP/JPY is falling towards a pullback support and could potentially bounce off this level to climb higher.
Buy entry is at 197.98 which is a pullback support that aligns with the 38.2% Fibonacci retracement.
Stop loss is at 196.68 which is a level that lies underneath a swing-low support and the 61.8% Fibonacci retracement.
Take profit is at 199.75 which is a swing-high resistance.
High Risk Investment Warning
Trading Forex/CFDs on margin carries a high level of risk and may not be suitable for all investors. Leverage can work against you.
Stratos Markets Limited (tradu.com ):
CFDs are complex instruments and come with a high risk of losing money rapidly due to leverage. 63% of retail investor accounts lose money when trading CFDs with this provider. You should consider whether you understand how CFDs work and whether you can afford to take the high risk of losing your money.
Stratos Europe Ltd (tradu.com ):
CFDs are complex instruments and come with a high risk of losing money rapidly due to leverage. 63% of retail investor accounts lose money when trading CFDs with this provider. You should consider whether you understand how CFDs work and whether you can afford to take the high risk of losing your money.
Stratos Global LLC (tradu.com ):
Losses can exceed deposits.
Please be advised that the information presented on TradingView is provided to Tradu (‘Company’, ‘we’) by a third-party provider (‘TFA Global Pte Ltd’). Please be reminded that you are solely responsible for the trading decisions on your account. There is a very high degree of risk involved in trading. Any information and/or content is intended entirely for research, educational and informational purposes only and does not constitute investment or consultation advice or investment strategy. The information is not tailored to the investment needs of any specific person and therefore does not involve a consideration of any of the investment objectives, financial situation or needs of any viewer that may receive it. Kindly also note that past performance is not a reliable indicator of future results. Actual results may differ materially from those anticipated in forward-looking or past performance statements. We assume no liability as to the accuracy or completeness of any of the information and/or content provided herein and the Company cannot be held responsible for any omission, mistake nor for any loss or damage including without limitation to any loss of profit which may arise from reliance on any information supplied by TFA Global Pte Ltd.
The speaker(s) is neither an employee, agent nor representative of Tradu and is therefore acting independently. The opinions given are their own, constitute general market commentary, and do not constitute the opinion or advice of Tradu or any form of personal or investment advice. Tradu neither endorses nor guarantees offerings of third-party speakers, nor is Tradu responsible for the content, veracity or opinions of third-party speakers, presenters or participants.

GBPJPY RangingGBPJPY is still in the range. For this range we can trade between the zones drawn. It has taken previous day high already. There is S&R level and supply zone if gets buyer push and crosses previous week high we may expect further bullish momentum. Till now we can trade between zones if we see any bullish signs.

#GPBJPY bearish in 15Mwe have a downtrend line \
sell position @198.45
with clear stop @ 198.75
first target is 198.30
and next target is 197.40
we make the trilling stop after first part close

$GJ (GBPJPY) 1HPrice is currently forming a descending triangle pattern, with clear lower highs and a horizontal support zone.
Trendline resistance is actively being respected.
Liquidity is likely building below the horizontal support zone.
A false breakout or sweep above the trendline followed by rejection could trigger institutional distribution.
As long as the descending trendline holds, and no bullish BOS occurs, the structure remains bearish. Look for price to accumulate short positions before expansion.

GBPJPY Forecast (4H Chart) SELL!Price rejected the 199.2 resistance and is now retesting the supply zone (~198.6). Lower highs forming, signaling potential downside continuation.
🔮 Forecast: Bearish
📍 Signal: Sell below 198.600
🎯 TP: 194.900
⛔ SL: 200.050

Trading balanceTrading balance The price of the asset has rebounded from the balance zone. With the prospect of growth into the resistance zone.
STEAL THIS TRADE! GBP/JPY Long Setup(Thief Trader’s Secret Plan)💰 Thief Trader’s GBP/JPY Heist Alert – Stealthy Long Setup Loading!
🌍 Greetings, Profit Raiders!
Hola, Konnichiwa, Ni Hao, Privyet, Hallo, Bonjour!
📢 Attention Market Bandits & Chart Pirates—the GBP/JPY Beast is ripe for plunder! Time to execute the next Thief Trader Masterplan.
🎯 Entry Zone – Loot the Dip!
Current price = Open vault. Fire longs now or snipe pullbacks (15M/30M charts recent swing low level).
Pro Thief Move: Stack buy limits near swing lows/highs. Chart alerts = your secret weapon. 🔫
🛑 Stop Loss – Guard the Treasure!
Swing Thieves: Hide SL below 2H swing low of candle wick @ (~197.000).
Day Raiders: Adjust SL to your risk size & order count. No free rides!
🎯 Profit Target – Escape with the Cash!
Take the 202.000 bag or exit early if momentum fades.
🔪 Scalpers vs. Swingers – Choose Your Weapon!
Scalpers (Quick Strikes): Longs only. No distractions.
Swing Traders (Patient Hunters): Trail stops & lock in gains.
🌪️ Market Pulse – Bullish Winds Blowing!
Price battling MA Resistance? No panic. Bulls still rule thanks to:
Fundamentals + Macro Trends
COT Data + Sentiment Shift
Quant Scores & Intermarket Alignments
(Check Linnkss for the full heist blueprint.)
⚠️ News Trap Warning!
Upcoming high-impact events? Freeze trades or tighten stops. Trailing SL = your escape route.
🚨 Join the Thief Trading Crew!
Like 👍 or Boost 🚀 this idea to fuel our next raid.
Thief Trader Tactics = Daily Market Domination. Your support keeps the heists alive! 💰❤️
🤑 Stay Locked In – The Next Big Score is Coming…
Timing is everything. Watch the charts. Strike hard. Exit smarter.

British Pound / Japanese Yen (GBP/JPY) 4-Hour Chart Analysis4-hour performance of the British Pound against the Japanese Yen (GBP/JPY) via OANDA data. The current price is 199.352, reflecting a 0.129 (0.06%) increase. The chart highlights a recent upward trend, with key support levels around 198.107 and 198.994, and resistance near 200.415. A breakout above the recent high is indicated, suggesting potential for further gains.

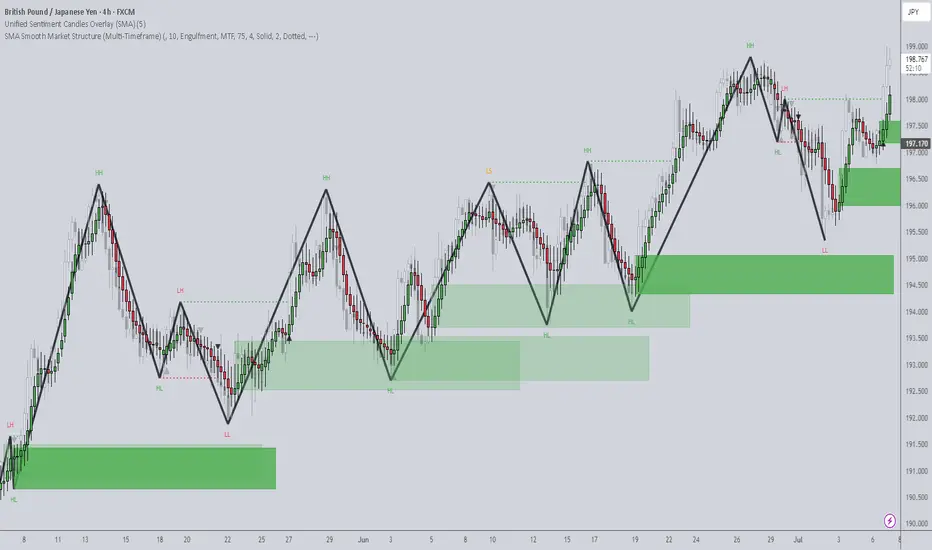
Timeframes: Why They’re Fundamentally Flawed (And What To Do)When analyzing price action, timeframes serve as a convenient lens through which traders attempt to make sense of the market. They help us categorize price movement — bullish , bearish , ranging , trending , and so on — within a structured framework. But here’s the reality: candlesticks themselves aren’t real . Much like clocks or calendars, they’re simply man-made constructs — tools we've invented to measure and scale something intangible: time . I know that might sound a bit abstract, but stay with me.
While traders commonly rely on standard timeframes like the Daily, 4H, 1H, 15M , etc., it’s important to recognize that price doesn’t conform to these rigid intervals. The market moves continuously, and the “spaces between” those timeframes — like a 27-minute or 3-hour chart — are just as real . These non-standard timeframes often offer better clarity depending on the speed and rhythm of the market at any given moment.
This begs the question: How do we keep up with this ever-shifting pace? Do we constantly toggle between similar timeframes to recalibrate our analysis? Do we measure volatility? Amplitude? Period length? There’s no clear consensus, which leads to inefficiency — and in trading, inefficiency costs.
In my view, the solution lies in blending multiple nearby timeframes into a single, adaptive framework . We need a representation of price action that adjusts automatically with the speed of the market. And the answer is surprisingly simple — literally . It’s called the Simple Moving Average (SMA) .
Think an SMA is just a line representing past highs, lows, or closes? It’s much more than that. When used creatively, the SMA becomes a dynamic lens that filters noise, reveals trend clarity, and smooths out irregularities in price behavior. Rather than relying on a single metric, we can combine multiple SMA variations — highs, lows, opens, closes — into one composite view of the market . This gives us a continuously adjusting snapshot of average price action.
Once we adopt this approach, everything starts to click.
• Engulfing patterns become more reliable
• Liquidity sweeps occur less frequently
• Supply and demand zones become more precise
• Market structure begins to make consistent sense
With SMA-based price action , our strategies don’t just become clearer — they become smarter .
Want to See It in Action?
If you’re interested in applying this concept to your own trading strategy, check out my TradingView profile: The_Forex_Steward . There, you’ll find the SMA Price Action indicator used in the examples shown, as well as tools that apply this methodology to:
• Supply and Demand
• Market Structure
• Market Balance Levels
• Velocity & Momentum
• And more to come!
If you found this idea helpful, be sure to follow the page. I’ll be releasing more exclusive indicators and trading concepts soon — so stay tuned!