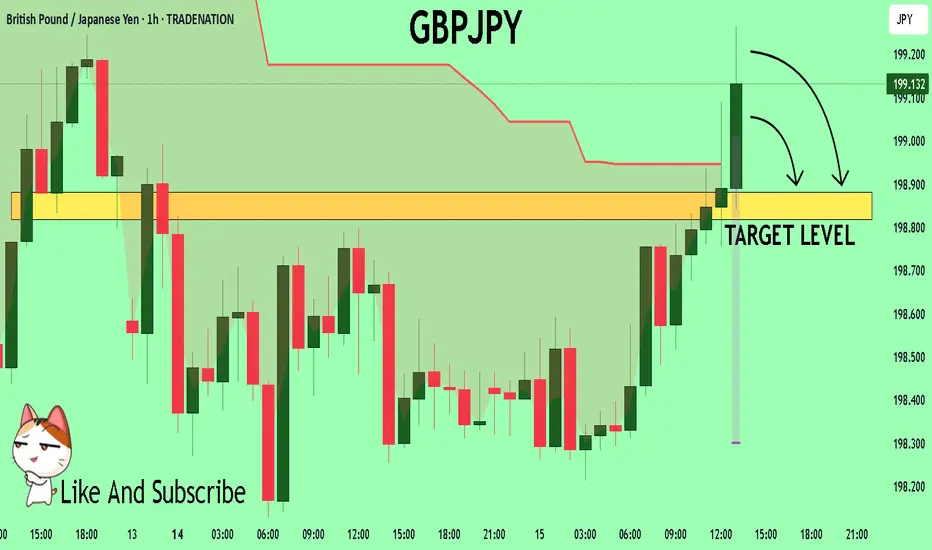
Long gbpjpyYou can buy Gbpjpy now or play it safe and wait until price comes to entry level which is the current today's high by using buystops
GBPJPY trade ideas

Another Home Run Trade? Risky & Conservative ApproachesFollowing up a MASSIVE win on the OANDA:EURJPY we may now have a similar trading opportunity setting up on the OANDA:GBPJPY
The premise is the same for this one as we're looking at a potential violation of structure followed by a Bullish continuation setup.
In this video, we'll look at where we think price can extend to, what needs to happen before we can make that prediction, and both a risky and conservative technique to get involved in the move.
Please let me know how you would approach this setup!
Akil

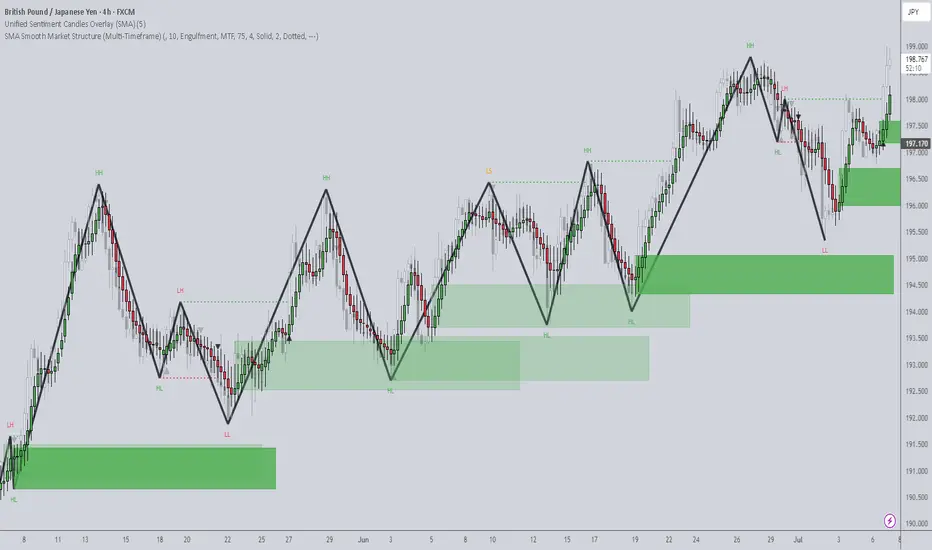
Timeframes: Why They’re Fundamentally Flawed (And What To Do)When analyzing price action, timeframes serve as a convenient lens through which traders attempt to make sense of the market. They help us categorize price movement — bullish , bearish , ranging , trending , and so on — within a structured framework. But here’s the reality: candlesticks themselves aren’t real . Much like clocks or calendars, they’re simply man-made constructs — tools we've invented to measure and scale something intangible: time . I know that might sound a bit abstract, but stay with me.
While traders commonly rely on standard timeframes like the Daily, 4H, 1H, 15M , etc., it’s important to recognize that price doesn’t conform to these rigid intervals. The market moves continuously, and the “spaces between” those timeframes — like a 27-minute or 3-hour chart — are just as real . These non-standard timeframes often offer better clarity depending on the speed and rhythm of the market at any given moment.
This begs the question: How do we keep up with this ever-shifting pace? Do we constantly toggle between similar timeframes to recalibrate our analysis? Do we measure volatility? Amplitude? Period length? There’s no clear consensus, which leads to inefficiency — and in trading, inefficiency costs.
In my view, the solution lies in blending multiple nearby timeframes into a single, adaptive framework . We need a representation of price action that adjusts automatically with the speed of the market. And the answer is surprisingly simple — literally . It’s called the Simple Moving Average (SMA) .
Think an SMA is just a line representing past highs, lows, or closes? It’s much more than that. When used creatively, the SMA becomes a dynamic lens that filters noise, reveals trend clarity, and smooths out irregularities in price behavior. Rather than relying on a single metric, we can combine multiple SMA variations — highs, lows, opens, closes — into one composite view of the market . This gives us a continuously adjusting snapshot of average price action.
Once we adopt this approach, everything starts to click.
• Engulfing patterns become more reliable
• Liquidity sweeps occur less frequently
• Supply and demand zones become more precise
• Market structure begins to make consistent sense
With SMA-based price action , our strategies don’t just become clearer — they become smarter .
Want to See It in Action?
If you’re interested in applying this concept to your own trading strategy, check out my TradingView profile: The_Forex_Steward . There, you’ll find the SMA Price Action indicator used in the examples shown, as well as tools that apply this methodology to:
• Supply and Demand
• Market Structure
• Market Balance Levels
• Velocity & Momentum
• And more to come!
If you found this idea helpful, be sure to follow the page. I’ll be releasing more exclusive indicators and trading concepts soon — so stay tuned!
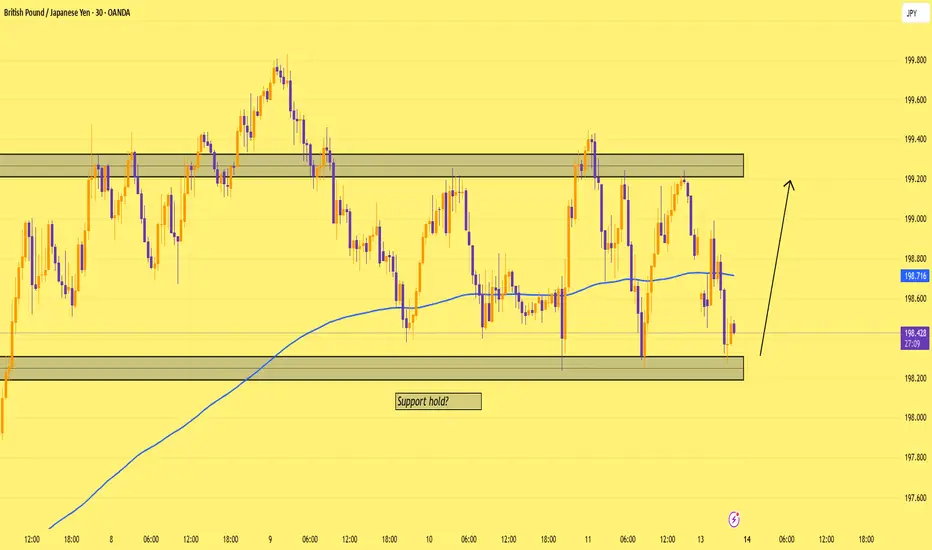
GBPJPY: The Bounce Begins?Price holding the range low and bouncing near support
As long as we stay above 198.200, I’m watching for bullish continuation 📈
Structure still intact — next reaction zone marked above ✅
check the trendConsidering the price behavior in the current resistance area, possible scenarios have been identified.
If the price breaks through the resistance area, the continuation of the upward trend will be likely. Otherwise, a downward trend is possible with the support trend line broken.

GBPJPY ENTRY CHARTOn this Pair, we are still BEARISH, as its strength shifted yesterday, JPY is gaining STRENGTH, also we have a DAILY BEARISH CLOSE, we have a CHOCH on the HOURLY, ewith a LTF CONFIRMATION, with other confluences on this pair, you can add to your watch-list,if this matches with your idea, and don't forget to apply a good risk on this idea, and dont forget the rules of moving B.E after +1r

GBPJPY long and shortOn this Pair we see a pattern within a pattern ... ascending within an ascending channel
first touch second touch which is the middle section waiting for the third touch to complete the structure to go to the downside.

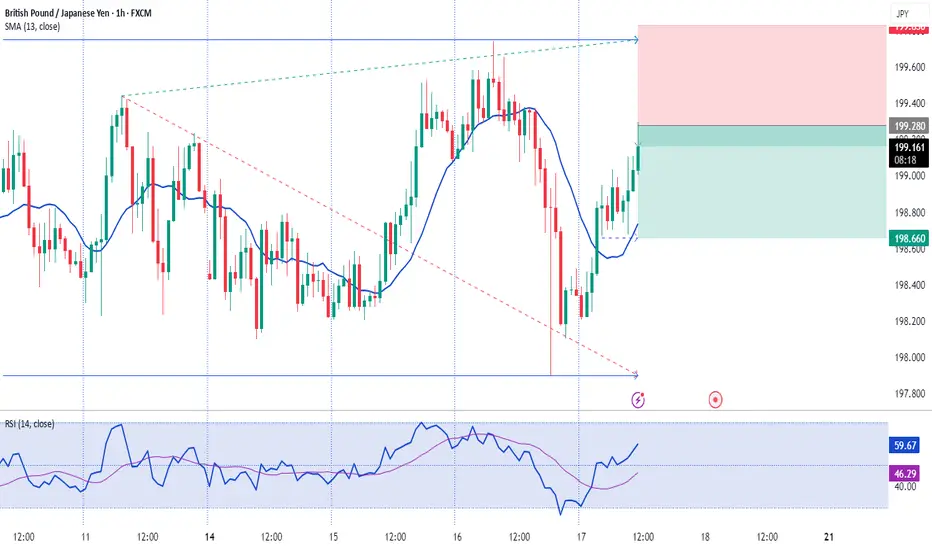
GBPJPY A Fall Expected! SELL!
My dear subscribers,
My technical analysis for GBPJPY is below:
The price is coiling around a solid key level - 199.16
Bias - Bearish
Technical Indicators: Pivot Points Low anticipates a potential price reversal.
Super trend shows a clear sell, giving a perfect indicators' convergence.
Goal - 198.88
About Used Indicators:
By the very nature of the supertrend indicator, it offers firm support and resistance levels for traders to enter and exit trades. Additionally, it also provides signals for setting stop losses
Disclosure: I am part of Trade Nation's Influencer program and receive a monthly fee for using their TradingView charts in my analysis.
———————————
WISH YOU ALL LUCK
GBPJPY BUY IDEAWe have 2 POI levels we are watching closely on this pair and we plan to react accordingly bases on priceaction on these levels.


correctionIt is expected that after some correction and fluctuation, the continuation of the upward trend will form and the resistance area will be broken.
If the price breaks through the support area, the continuation of the downward trend is likely.

GBPJPY – Eyeing new highs as bullish structure holdsGBPJPY continues to trade within a steady ascending channel and has recently bounced from short-term support around 198.200. If price breaks above 199.400, bullish momentum could strengthen, targeting the previous high near 200.800 — a key resistance zone that has been rejected before.
From a fundamental perspective, expectations that the Bank of England will maintain high interest rates to combat inflation are supporting the pound. Meanwhile, investor sentiment remains cautious toward the yen following dovish signals from the Bank of Japan. If upcoming UK economic data is positive, GBPJPY may continue climbing in the sessions ahead.

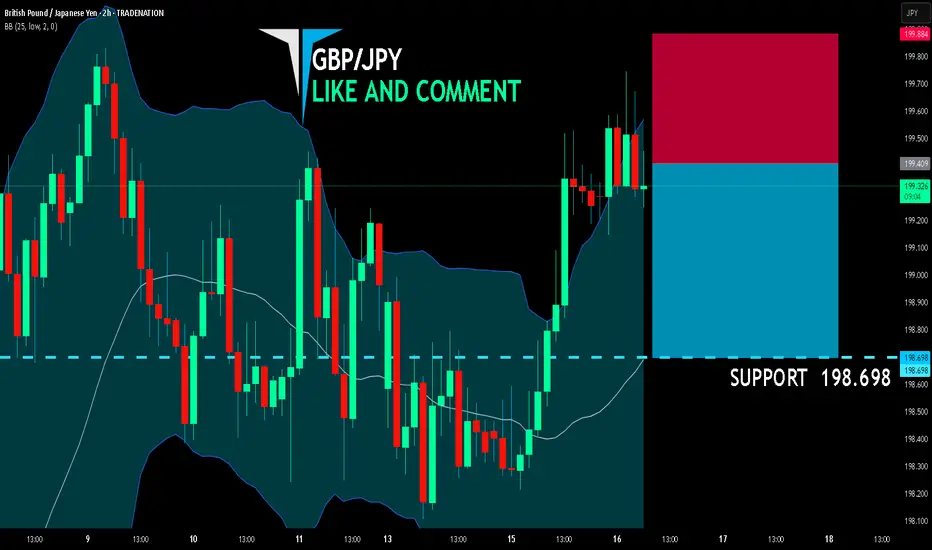
GBP/JPY BEARISH BIAS RIGHT NOW| SHORT
GBP/JPY SIGNAL
Trade Direction: short
Entry Level: 199.409
Target Level: 198.698
Stop Loss: 199.884
RISK PROFILE
Risk level: medium
Suggested risk: 1%
Timeframe: 2h
Disclosure: I am part of Trade Nation's Influencer program and receive a monthly fee for using their TradingView charts in my analysis.
✅LIKE AND COMMENT MY IDEAS✅
GBPJPYSell. Market Execution. trade 1:2. risk 0.50%
Enter in Sell because Market retest Seller's Zone.

eurnzd sell signal. Don't forget about stop-loss.
Write in the comments all your questions and instruments analysis of which you want to see.
Friends, push the like button, write a comment, and share with your mates - that would be the best THANK YOU.
P.S. I personally will open entry if the price will show it according to my strategy.
Always make your analysis before a trade

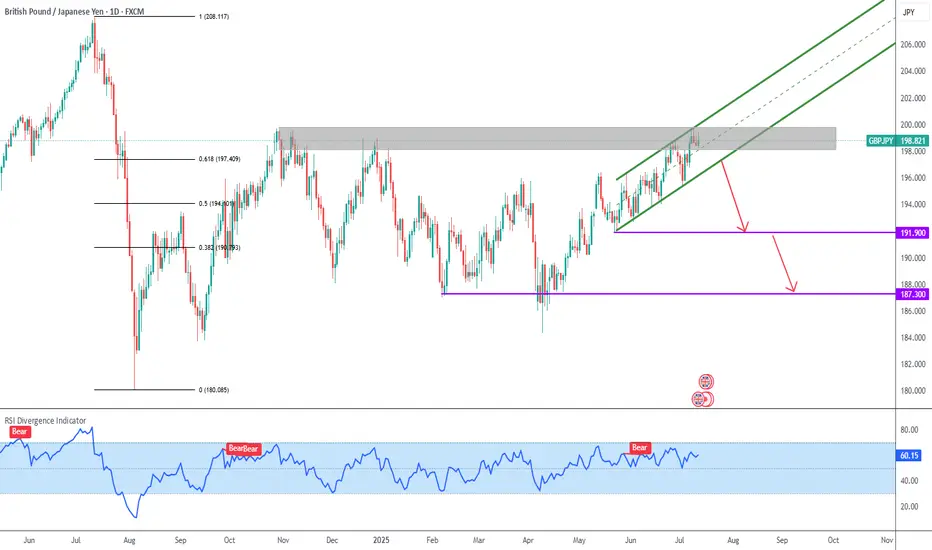
GBPJPY Ascending Channel
The grind to the upside is losing strength, and I´m waiting for a break of the green ascending channel to the downside.
Initial targets are the base of the ascending channel (at 191.900) and close to the recent pivot low (at 187.300)
buy jg from pivotgood RR buy from pivot
pre NY open
this is my trading strategy, trade on pivots point

GBPJPY AccumulatingGBPJPY is building liquidity. We can see it around these zones. So trading between the zones will be wonderful. We can not say anything about the direction of GBPJPY right now because it is oscillating between the zones. The clear picture can be trade zones for scalping. No any potential move seen here.

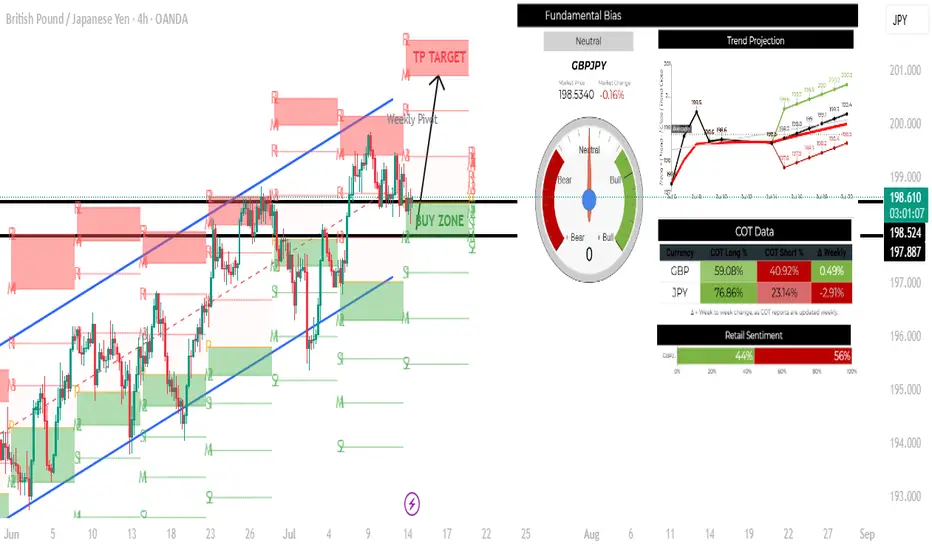
GBPJPY H4 LONG SETUP: 14-18 JULY 2025TECHNICAL ANALYSIS
This pair is bullish and its in a beautiful upward channel creating higher highs and higher lows. Price is currently in the weekly buy zone which is also the current support area. Bulls will be looking to go long here and hope to take price all the way to the projected take profit target.
FUNDAMENTAL ANALYSIS
The currency pair GBPJPY has a score of 2, indicating that the base currency is stronger than the quote currency. However, the pair shows neutrality with the trend projection being to the upside. COT shows institutional positioning is long both pairs, the market and price, however, is bullish.
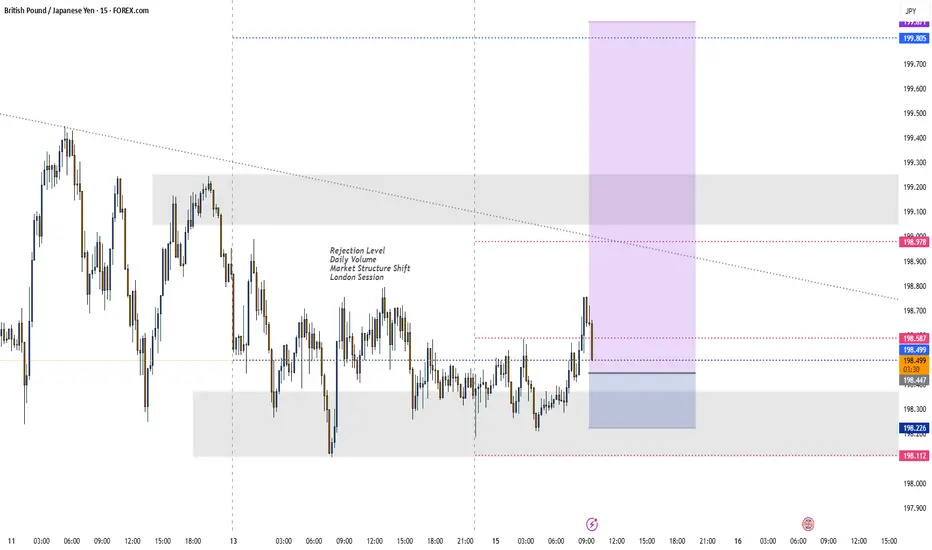
BUYTrend Line Break
Previous Day Volume
Rejection Point
Untapped Order Point
Asian Session
High Structure Swing

GBPJPY - Bullish BiasHTF Overview (4H): Price broke bullish structure with clean directional intent. Order flow remains aligned to the upside with no immediate signs of weakness.
MTF Refinement (30M): Zoomed into 30M for deeper structure clarity. Observing price actively reaching for sell-side liquidity (SSL) below a key low — a classic inducement setup forming.
Execution Plan: Waiting for a liquidity sweep below the SSL. Once swept, I’ll monitor the nearby 30M OB for mitigation. LTF confirmations (1M/5M CHoCH or BOS) will be needed before committing to a long entry.
Mindset: Patience over prediction — let liquidity do its job, then ride with smart money.
Bless Trading!
