GBPJPY trade ideas


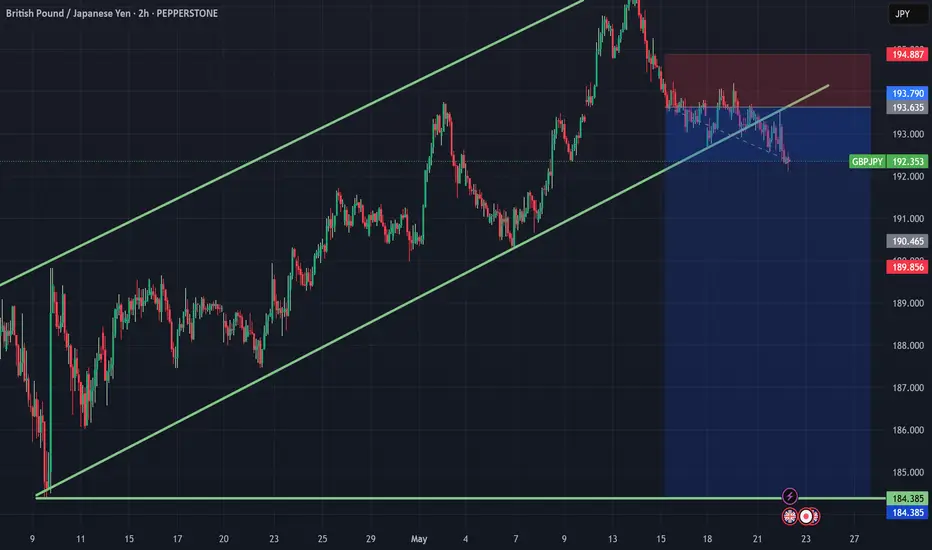
check the trendAs long as the price fluctuates above the green support level, a continuation of the uptrend is likely. Otherwise, a continuation of the downtrend to the next support level and the previous low is possible.

GBP/JPY Holds Key Support as Bullish Momentum BuildsA bullish setup has emerged on GBP/JPY, with recent price action suggesting bullish momentum is building. With GBP strengthening against USD, GBP/JPY may present a higher-probability bullish scenario compared to USD/JPY in the near term (though this also looks bullish to my eyes over the near term).
GBP/JPY held above key moving averages midweek. GBP/JPY failed to close below its 200-day SMA on both Wednesday and Thursday, while yesterday’s session also respected support at the 50-day EMA and the 192.00 handle.
Momentum indicators support the bullish case, with the daily RSI trading above 50 after rebounding from its most oversold level in six weeks.
As long as prices hold above Thursday’s low, bulls may look for a retest of the cycle highs near 196.00.
** Please note that Japan's CPI data drops in >30 minutes **
Matt Simpson, Market Analyst at City Index and Forex.com

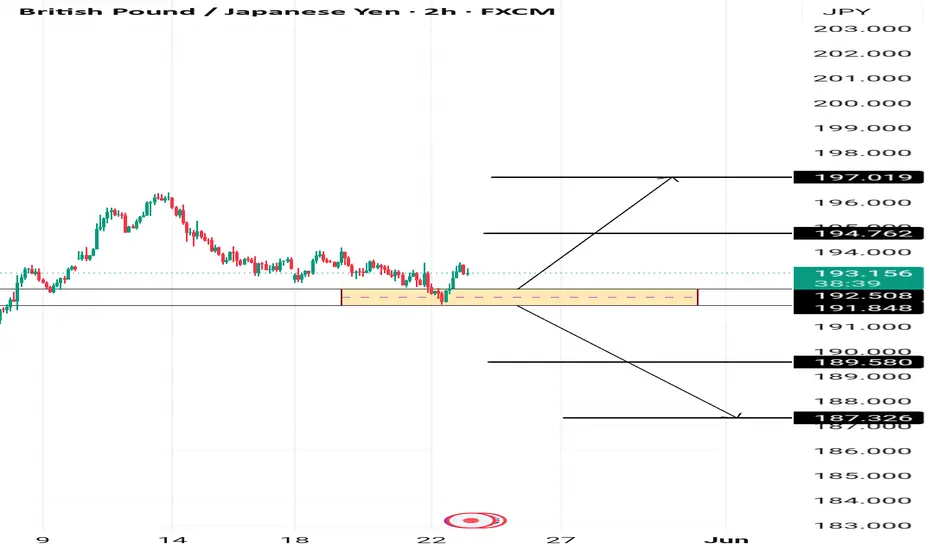
GbpJpy bouncing off Pivot areaGBPJPY bounced off the pivot area between 191.848 and 192.508 witg furthur bullish momentum expected towards 194.76 and 197.01 .
However a break below this area could open the door for bearish movement towards 189.58 and 187.32 .
GBPJPY Technical Analysis! BUY!
My dear followers,
I analysed this chart on GBPJPY and concluded the following:
The market is trading on 193.04 pivot level.
Bias - Bullish
Technical Indicators: Both Super Trend & Pivot HL indicate a highly probable Bullish continuation.
Target - 193.32
About Used Indicators:
A super-trend indicator is plotted on either above or below the closing price to signal a buy or sell. The indicator changes color, based on whether or not you should be buying. If the super-trend indicator moves below the closing price, the indicator turns green, and it signals an entry point or points to buy.
Disclosure: I am part of Trade Nation's Influencer program and receive a monthly fee for using their TradingView charts in my analysis.
———————————
WISH YOU ALL LUCK

GBPJPYGBP/JPY 10-Year Bond Yield Differential and Carry Trade Outlook (May 21, 2025)
Current Bond Yields and Interest Rate Differential
UK 10-year gilt yield: 4.77%
Japan 10-year JGB yield: 1.53%
Interest rate differential: 3.24% (GBP yield - JPY yield)
Key Factors Influencing Carry Trade Dynamics
For GBP (UK):
The UK’s 10-year yield rose to 4.77%, its highest since April 2025, driven by hotter-than-expected inflation data (CPI at 3.5% YoY) and reduced expectations for Bank of England (BoE) rate cuts in 2025. Markets now price in only 34 basis points of cuts for the year .
The BoE’s cautious stance supports GBP strength, as higher yields attract foreign capital.
For JPY (Japan):
Japan’s 10-year JGB yield remains low at 1.53%, despite rising to a 17-year high earlier in 2025. The Bank of Japan (BoJ) continues gradual policy normalization but faces economic headwinds (Q1 GDP contraction of 0.2% QoQ) .
BoJ’s potential rate hikes and reduced bond purchases could strengthen the yen, adding risk to JPY-funded carry trades .
Carry Trade Reaction
Opportunity for GBP/JPY Carry Trade
The 3.24% yield spread makes GBP/JPY attractive for carry traders, who borrow low-yielding JPY to invest in higher-yielding GBP assets.
Historical precedent (e.g., 2021–2024) shows such spreads often lead to sustained GBP/JPY rallies, provided volatility remains low .
Risks and Challenges
JPY Strength Risks: BoJ’s tightening bias and safe-haven demand (amid U.S.-China trade tensions) could trigger sharp JPY appreciation, eroding carry profits .
GBP Volatility: UK inflation uncertainty and fiscal risks could destabilize gilt yields, increasing GBP volatility.
Intervention Risks: Japanese authorities have signaled willingness to curb excessive JPY weakness, raising the cost of carry trades .
Strategic Response for Carry Traders
Hedging: Use options (e.g., JPY call/put risk reversals) to protect against sudden yen strength while retaining exposure to the yield spread .
Selective Positioning: Focus on short-term trades to avoid prolonged exposure to BoJ policy shifts or UK economic data surprises.
Summary Table
Factor GBP Impact JPY Impact Carry Trade Implication
Yield Spread 4.77% 1.53% Attractive 3.24% differential
BoE Policy Cautious on cuts – Supports GBP strength
BoJ Policy – Gradual tightening Risk of JPY appreciation
Geopolitical Risks – Safe-haven JPY demand Limits GBP/JPY upside
Conclusion
Carry traders are likely to favor GBP/JPY due to the wide yield spread, but will mitigate risks through hedging and close monitoring of BoJ interventions, UK inflation trends, and geopolitical developments. The trade’s profitability hinges on stable or widening yield differentials and subdued JPY safe-haven demand.
#GBPJPY #FOREX


GBPJPY What Next? SELL!
My dear friends,
Please, find my technical outlook for GBPJPY below:
The instrument tests an important psychological level 193.17
Bias - Bearish
Technical Indicators: Supper Trend gives a precise Bearish signal, while Pivot Point HL predicts price changes and potential reversals in the market.
Target - 192.71
About Used Indicators:
Super-trend indicator is more useful in trending markets where there are clear uptrends and downtrends in price.
Disclosure: I am part of Trade Nation's Influencer program and receive a monthly fee for using their TradingView charts in my analysis.
———————————
WISH YOU ALL LUCK


BosThr first bos from stoploss hunt will always give us an entry but the bos will give you a sniper late entry

Pound-yen struggles despite higher British inflationSome renewed demand for havens has supported the yen over the last few days as American bonds were downgraded. Recent Japanese data have been mostly mixed, with investment likely up somewhat although 20 May’s balance of trade unexpectedly showed a deficit. British data have been more positive, with inflation particularly reaching a high of more than a year and lowering the probability of immediate further cuts by the BoE.
14 May’s rejection of ¥196 seems to have been decisive, with the price having moved fairly consistently down since then and back below the 200 SMA. The slow stochastic is very close to neutral and volume remains low compared to early in April. Consolidation in the value area between the 100 and 200 SMAs looks possible in the near future unless there’s a particular surprise from Japanese inflation.
The weekly chart shows an overall sideways trend since the fourth quarter of 2024, which is a normal situation for a major forex pair. The main release coming up for pound-yen specifically is Japanese consumer confidence on 29 May.
This is my personal opinion, not the opinion of Exness. This is not a recommendation to trade.

GBPJPY Update. May 22thAlthough price didn’t follow my initial trade setup exactly, it’s still doing precisely what could be expected. Knowing which levels to focus on — and how to anticipate reactions — is crucial to avoid chasing trades. Let the market do its work.
I’m still looking for buy setups (mid to long term) as long as a main key level remains intact. This is not defined by new lows alone, but by how price behaves according to my system.
There’s still an area of imbalance within the current structure — that remains my main target.
Keep following this trade to see how the market unfolds.
Pay close attention to the levels I’ve marked — they’re not random. Each one serves a purpose

GBPJPY - Important BreakdownHello Traders !
The GBPJPY failed to create a new higher high.
The price broke the support line!
So, I expect a bearish move📉
________________
TARGET: 190.680🎯

GBP/JPY Elliott Wave Completion + AO Divergence @ Zone 4.23 | BUHey traders! 👋
Here’s an exciting setup on GBP/JPY (1H) — we might be at the early stage of a major reversal, and you’ll want this on your radar. Let's break it down with Elliott Wave theory, the Awesome Oscillator (AO), and some powerful Fibonacci confluence.
🧠 Elliott Wave Count – 5-Wave Impulse Completed
We have a clean 5-wave bearish impulsive structure:
1️⃣ Wave (1): Sharp drop kicks off the trend.
2️⃣ Wave (2): Classic pullback, respecting structure.
3️⃣ Wave (3): Longest and most powerful wave down.
4️⃣ Wave (4): Corrective triangle/flat with weakening bear momentum.
5️⃣ Wave (5): Final push into a key demand zone, but lacks strength.
🛑 What makes this special? Wave (5) lands right into “Zone 4.23” — a Fibonacci extension (423.6%) of the corrective leg — acting as a magnet for price exhaustion.
📊 AO Divergence – Early Warning Signal!
Check the Awesome Oscillator (AO):
Price makes lower lows (Wave 3 → Wave 5)
AO makes higher lows — textbook bullish divergence 🔍
This is smart money exhaustion: the bears are running out of steam, even though price is still pushing lower. When momentum diverges from price, a reversal is highly probable.
📌 ZONE 4.23 – Fibonacci Confluence + Demand Zone
This zone (191.900 – 192.300) is no ordinary support. It combines:
📐 423.6% Fibonacci extension (a powerful exhaustion level)
🟦 Historical demand zone from previous impulsive rally
🤖 Price reacting instantly on touch = algorithmic buying likely
⚠️ What Comes Next – Break of Structure (BOS) = Entry Trigger
We’re not rushing in blindly. Here’s the plan:
Wait for BOS: Price must break above Wave (4) structure (~193.200).
AO flips green: Extra confirmation of new bullish momentum.
Retest of BOS or Zone 4.23: That’s our golden buy entry.
Target Zone: Use Fibonacci retracement of full Wave 1–5 down. First targets:
🎯 38.2% = 193.800
🎯 61.8% = 194.900
🎯 Full correction = 196.000+
🎯 Conclusion: This Is a Setup with EDGE
✅ Completed Elliott Wave
✅ AO Divergence = Hidden strength
✅ Fibonacci 4.23 Confluence
✅ Demand Zone bounce
✅ Clear BOS-based entry plan
🔥 Are You Ready for the Reversal?
Drop a comment if you're watching this setup too 👇
Like ❤️ + Follow if you want more clean, actionable Elliott Wave + AO confluence setups like this!
📈 Let’s catch the move before the crowd reacts.
#GBPJPY #ElliottWave #AO #Divergence #ForexTrading #TechnicalAnalysis #BuySetup #SmartMoney #Fib4.23 #BreakOfStructure #TrendReversal

GJ-Thu-22/05/25 TDA-Multiple 4hS tapped, PMI news incoming!Analysis done directly on the chart
Follow for more, possible live updates!
Multiple 4hS tapped, PMI news incoming,
the PMI releases will determine how price
will move today.
Not financial advice, DYOR.
Market Flow Strategy
Mister Y

SELL NOW GBPJPY!!!!!!!Bearish rising wedge pattern and yes we already have a breakouts and a retest just a free ride down to the sell side am in on sell hold till a perfect drop of +200pips atleast
Falling towards 38.2% Fibonacci support?GBP/JPY is falling towards the pivot and could bounce to the 1st, pullback resistance.
Pivot: 191.56
1st Support: 190.35
1st Resistance: 193.65
Risk Warning:
Trading Forex and CFDs carries a high level of risk to your capital and you should only trade with money you can afford to lose. Trading Forex and CFDs may not be suitable for all investors, so please ensure that you fully understand the risks involved and seek independent advice if necessary.
Disclaimer:
The above opinions given constitute general market commentary, and do not constitute the opinion or advice of IC Markets or any form of personal or investment advice.
Any opinions, news, research, analyses, prices, other information, or links to third-party sites contained on this website are provided on an "as-is" basis, are intended only to be informative, is not an advice nor a recommendation, nor research, or a record of our trading prices, or an offer of, or solicitation for a transaction in any financial instrument and thus should not be treated as such. The information provided does not involve any specific investment objectives, financial situation and needs of any specific person who may receive it. Please be aware, that past performance is not a reliable indicator of future performance and/or results. Past Performance or Forward-looking scenarios based upon the reasonable beliefs of the third-party provider are not a guarantee of future performance. Actual results may differ materially from those anticipated in forward-looking or past performance statements. IC Markets makes no representation or warranty and assumes no liability as to the accuracy or completeness of the information provided, nor any loss arising from any investment based on a recommendation, forecast or any information supplied by any third-party.

GBPJPY | Rising WedgeGBPJPY has made a rising wedge pattern with prior bearish divergence.It is a good sign of downward trend and a short trade can be taken either by sell stop order or an instant order.

GBP JPY Chart Showing Double top trendGBP JPY Showing double top trend in the chart after Diavergenc and I am taking my trade.

GBP Sell IdeaPrice has been forming lower highs and lower lows all week. The support area has been broken on H1, and a retest has been done. A close of the H4 candle below the support would confirm a sell. We wait and watch.
Risk - 30 pips
Reward - Your decision

GBPJPY Will Move Higher! Long!
Here is our detailed technical review for GBPJPY.
Time Frame: 1D
Current Trend: Bullish
Sentiment: Oversold (based on 7-period RSI)
Forecast: Bullish
The market is trading around a solid horizontal structure 192.740.
The above observations make me that the market will inevitably achieve 197.573 level.
P.S
The term oversold refers to a condition where an asset has traded lower in price and has the potential for a price bounce.
Overbought refers to market scenarios where the instrument is traded considerably higher than its fair value. Overvaluation is caused by market sentiments when there is positive news.
Disclosure: I am part of Trade Nation's Influencer program and receive a monthly fee for using their TradingView charts in my analysis.
Like and subscribe and comment my ideas if you enjoy them!

GBP/JPY – Bearish Trend Continuation Setup After ReversalPair: GBP/JPY
Market Trend: Bearish (Confirmed Reversal)
Entry Type: Sell Limit
Entry Price (EP): 192.725
Stop Loss (SL): 194.285
Take Profit 1 (TP1): 191.024 (1:1)
Take Profit 2 (TP2): 189.262 (1:2)
Lot Size: 0.09
Risk/Reward:
Trade 1: Risk $100 / Reward $100 (1:1)
Trade 2: Risk $100 / Reward $200 (1:2)
Total Risk: $200
Total Potential Reward: $300
📉 Trade Overview:
After a clear trend reversal from bullish to bearish, GBP/JPY has started forming lower highs and lower lows, signaling strength in the bearish momentum.
We're entering a Sell Limit trade on a pullback to a key resistance level, aligned with the newly formed downtrend.
SL is placed safely above recent swing highs
TP1 targets a conservative zone for early profit
TP2 allows us to ride the momentum deeper into the trend
🔍 Why This Setup?
✅ Confirmed Trend Shift – Market structure has flipped, confirming a bearish trend.
✅ Resistance-Based Entry – Selling on a pullback adds higher probability to the trade.
✅ Smart Risk Management – Trade split into 1:1 and 1:2 for both safety and profitability.
✅ Clear Technical Levels – SL and TPs aligned with prior price action and liquidity zones.
📌 Strategy Note:
Staying disciplined during trend reversals is key. We’re executing on structure, not emotion. Price is more likely to respect resistance after momentum shift — and we’re positioned with calculated risk.
🔗 Hashtags:
#GBPJPY #ForexTrading #BearishTrend #SellLimit #TrendReversal #PriceAction #ForexSetup #TechnicalAnalysis #RiskReward #SmartTrading #FXMarket #TradingStrategy #ForexSignals
