A SHORT SHORT B4 LONG LONG GBPJPY SHORT FORECAST Q2 W21 D20 Y25 A SHORT SHORT B4 LONG LONG LONG
GBPJPY SHORT FORECAST Q2 W21 D20 Y25
Professional Risk Managers👋
Welcome back to another FRGNT chart update📈
Diving into some Forex setups using predominantly higher time frame order blocks alongside confirmation breaks of structure.
Let’s see what price action is telling us today!
💡Here are some trade confluences📝
✅Weekly order block rejection
✅Daily order block rejection
✅Intraday 15' order blocks
✅Tokyo ranges to be filled
🔑 Remember, to participate in trading comes always with a degree of risk, therefore as professional risk managers it remains vital that we stick to our risk management plan as well as our trading strategies.
📈The rest, we leave to the balance of probabilities.
💡Fail to plan. Plan to fail.
🏆It has always been that simple.
❤️Good luck with your trading journey, I shall see you at the very top.
🎯Trade consistent, FRGNT X
GBPJPY trade ideas

GJ-Tue-20/05/25 TDA-Uncertainty ahead of GBP CPI!Analysis done directly on the chart
Follow for more, possible live trades update!
Knowledge per se won't make you money, it is
applying the knowledge and in this case in trading
doing live trades will help you to possibly make money.
Not financial advice, DYOR.
Market Flow Strategy
Mister Y

GJ| gearing up for the smackdown.Entry loading..... don't blink.
Price dancing near the zone.... just waiting on that tap so we can rip through 30M highs. Precision only.
Bless Trading!

GBP/JPY 1H Chart Analysis – Bullish Breakout PotentialPublished on May 20, 2025, this 1-hour GBP/JPY chart highlights a key technical setup. The price has been consolidating within a tight range after a sharp decline, forming a potential accumulation zone between 193.47 and 193.80 (yellow rectangle). Multiple tests of the "BOS" (Break of Structure) levels indicate strong support and resistance zones, with a recent "CHOCH" (Change of Character) signaling a shift in momentum.
The price is now approaching a critical resistance at 193.80. A breakout above this level could confirm a bullish trend, potentially targeting 195.00 and beyond (blue arrow). Traders should watch for a strong close above 193.80 with increased volume to validate the breakout. Conversely, a rejection at this level may lead to a retest of the lower support at 193.47.
Key Levels:
Support: 193.47
Resistance: 193.80
Potential Target: 195.00+
Stay cautious of false breakouts and monitor price action closely! #GBPJPY #Forex

GBPJPY Rising Wedge Bearish Reversal Pattern with Trade PlanGBPJPY Rising Wedge Bearish Reversal Pattern with Trade Plan

GBP/JPY Long to 195gbpjpy long to 195 area. keep on watch
💡 Key Considerations Before Going Long GBP/JPY
Factor Impact on GBP/JPY Long Trade
BoE hawkish stance Bullish for GBP (supports long)
BoJ dovish policy Bearish for JPY (supports long)
Strong UK data Bullish for GBP (supports long)
Risk-on sentiment Traders move out of JPY into riskier assets
Geopolitical events Could boost JPY if risk-off sentiment dominates

GBP/JPY) bullish trend analysis Read The ChaptianSMC trading point update
Technical analysis setup for the GBP/JPY pair on a 4-hour timeframe. Here's the breakdown of the trading idea:
---
Key Concepts Highlighted:
1. Support Trend Level (Yellow Zone):
The yellow zone marks a strong confluence area:
Horizontal support from previous price reactions.
Trendline support that has held multiple times.
Close to the 200 EMA (at 191.833), which acts as dynamic support.
2. Bullish Reversal Pattern:
The chart shows a rounded bottom/cup-like structure forming at support—often a sign of accumulation before a reversal.
Price is expected to bounce from this support zone and move higher within the ascending channel.
3. Target Point Projection:
The projected move is around 515.8 pips, targeting the 197.949 level.
This target aligns with the upper boundary of the ascending trend channel.
4. RSI (Relative Strength Index):
RSI is around 43–44, near oversold territory, suggesting potential bullish momentum if a bounce occurs.
Mr SMC Trading point
Conclusion:
This setup suggests a potential long (buy) opportunity:
Entry near the 193.0–193.5 zone (support/trendline confluence).
Stop loss likely below the 200 EMA (~191.5 area).
Target arounSMC trading point update
Technical analysis setup for the GBP/JPY pair on a 4-hour timeframe. Here's the breakdown of the trading idea:
---
Key Concepts Highlighted:
1. Support Trend Level (Yellow Zone):
The yellow zone marks a strong confluence area:
Horizontal support from previous price reactions.
Trendline support that has held multiple times.
Close to the 200 EMA (at 191.833), which acts as dynamic support.
2. Bullish Reversal Pattern:
The chart shows a rounded bottom/cup-like structure forming at support—often a sign of accumulation before a reversal.
Price is expected to bounce from this support zone and move higher within the ascending channel.
3. Target Point Projection:
The projected move is around 515.8 pips, targeting the 197.949 level.
This target aligns with the upper boundary of the ascending trend channel.
4. RSI (Relative Strength Index):
RSI is around 43–44, near oversold territory, suggesting potential bullish momentum if a bounce occurs.
Mr SMC Trading point
Conclusion:
This setup suggests a potential long (buy) opportunity:
Entry near the 193.0–193.5 zone (support/trendline confluence).
Stop loss likely below the 200 EMA (~191.5 area).
Target around 197.95, offering a good risk/reward ratio.
The idea is based on trend continuation, a bounce from confluence support, and RSI support for bullish reversal.
Pales support boost 🚀 analysis follow )

Gbp/Jpy Intra-day Analysis 19-May-2025Price action on GBP/JPY has shown upward momentum after reaching the 193 level and failing to break below it.
Possible scenarios include:
• A retest of the 193.6 area, where failure to close below this level could suggest continued bullish pressure. In such a case, attention may shift toward the 194.7 region as a potential level of interest. Sustained momentum could see the pair approach the 196 area, though a move back toward 193.6 remains possible if upward pressure fades
• Around 196, price behavior could become more reactive. This area may attract interest from market participants watching for signs of reversal, particularly if technical patterns suggest a slowdown in upward momentum. Should that occur, a move toward 194.8 may come into focus.
Disclaimer: easyMarkets Account on TradingView allows you to combine easyMarkets industry leading conditions, regulated trading and tight fixed spreads with TradingView's powerful social network for traders, advanced charting and analytics. Access no slippage on limit orders, tight fixed spreads, negative balance protection, no hidden fees or commission, and seamless integration.
Any opinions, news, research, analyses, prices, other information, or links to third-party sites contained on this website are provided on an "as-is" basis, are intended only to be informative, is not an advice nor a recommendation, nor research, or a record of our trading prices, or an offer of, or solicitation for a transaction in any financial instrument and thus should not be treated as such. The information provided does not involve any specific investment objectives, financial situation and needs of any specific person who may receive it. Please be aware, that past performance is not a reliable indicator of future performance and/or results. Past Performance or Forward-looking scenarios based upon the reasonable beliefs of the third-party provider are not a guarantee of future performance. Actual results may differ materially from those anticipated in forward-looking or past performance statements. easyMarkets makes no representation or warranty and assumes no liability as to the accuracy or completeness of the information provided, nor any loss arising from any investment based on a recommendation, forecast or any information supplied by any third-party.

Gj outlook 1h structure has already shifted bullish📈.
Waiting for a retracement for a suitable entry trigger at those zones ✔️
This is a high probability setup

OPENING RANGE CONCEPTSIve traded many concepts and this seems and happens daily, you get your 1:3 max daily on any instrument even on crypto. This just one of my analysis. Theres still more to it.

Check the trend The price is expected to fluctuate above the current support level and then start an uptrend. A break of the support level will cause the downtrend to continue to the next support level.


GG outlook4hPrice is trading at the lower part of the trendline✅.
Price is bullish overally📈.
Will only be looking for buys.🔥

GJ-Mon-19/05/25 TDA-Possible scalp buy to 4hR 193.630Analysis done directly on the chart
Follow for more, possible live trades update!
Unless it's systematic approach to trading, all
manual execution trade come from some form
of price action trading. (different people call it
in different ways) If you have a different idea,
comment down below! Let's have a good discussion!
Not financial advice, DYOR.
Market Flow Strategy
Mister Y

GBPJPY Signal : 1H / 4H Beautiful buy !!!Hello Traders! 👋
What are your thoughts on GBPJPY ?
Symbol : GBPJPY H1
Market price : 193.20
BUY limit : 192.40 - 192.00
Tp1 :193.40
Tp2 : 194.60
Tp3 : 196.40
Tp4 : 199.60
Sl : 190.80
Don’t forget to like and share your thoughts in the comments! ❤️
Remember this is a position that was found by me and it is a personal idea not a financial advice, you are responsible for your loss and gain.

GBPJPY H1 I Bearish ContinuationBased on the H4 chart, the price is rising toward our sell entry level at 193.55, a pullback resistance that aligns with the 78.6 Fibo retracement.
Our take profit is set at 193.05, a pullback support.
The stop loss is set at 193.88, above a swing high resistance.
High Risk Investment Warning
Trading Forex/CFDs on margin carries a high level of risk and may not be suitable for all investors. Leverage can work against you.
Stratos Markets Limited (tradu.com):
CFDs are complex instruments and come with a high risk of losing money rapidly due to leverage. 63% of retail investor accounts lose money when trading CFDs with this provider. You should consider whether you understand how CFDs work and whether you can afford to take the high risk of losing your money.
Stratos Europe Ltd (tradu.com):
CFDs are complex instruments and come with a high risk of losing money rapidly due to leverage. 63% of retail investor accounts lose money when trading CFDs with this provider. You should consider whether you understand how CFDs work and whether you can afford to take the high risk of losing your money.
Stratos Global LLC (tradu.com):
Losses can exceed deposits.
Please be advised that the information presented on TradingView is provided to Tradu (‘Company’, ‘we’) by a third-party provider (‘TFA Global Pte Ltd’). Please be reminded that you are solely responsible for the trading decisions on your account. There is a very high degree of risk involved in trading. Any information and/or content is intended entirely for research, educational and informational purposes only and does not constitute investment or consultation advice or investment strategy. The information is not tailored to the investment needs of any specific person and therefore does not involve a consideration of any of the investment objectives, financial situation or needs of any viewer that may receive it. Kindly also note that past performance is not a reliable indicator of future results. Actual results may differ materially from those anticipated in forward-looking or past performance statements. We assume no liability as to the accuracy or completeness of any of the information and/or content provided herein and the Company cannot be held responsible for any omission, mistake nor for any loss or damage including without limitation to any loss of profit which may arise from reliance on any information supplied by TFA Global Pte Ltd.
The speaker(s) is neither an employee, agent nor representative of Tradu and is therefore acting independently. The opinions given are their own, constitute general market commentary, and do not constitute the opinion or advice of Tradu or any form of personal or investment advice. Tradu neither endorses nor guarantees offerings of third-party speakers, nor is Tradu responsible for the content, veracity or opinions of third-party speakers, presenters or participants.

GBP_JPY GROWTH AHEAD|LONG|
✅GBP_JPY is going down now
But a strong support level is ahead
Thus I am expecting a rebound
And a move up towards the target above 194.000
LONG🚀
✅Like and subscribe to never miss a new idea!✅
Disclosure: I am part of Trade Nation's Influencer program and receive a monthly fee for using their TradingView charts in my analysis.

GBPJPY is Holding above the SupportHello Traders
In This Chart GBPJPY HOURLY Forex Forecast By FOREX PLANET
today GBPJPY analysis 👆
🟢This Chart includes_ (GBPJPY market update)
🟢What is The Next Opportunity on GBPJPY Market
🟢how to Enter to the Valid Entry With Assurance Profit
This CHART is For Trader's that Want to Improve Their Technical Analysis Skills and Their Trading By Understanding How To Analyze The Market Using Multiple Timeframes and Understanding The Bigger Picture on the Charts

GBPJPY - Poised for Rebound at Major Trendline Support?The GBP/JPY pair is currently trading around the 193.41 level, showing consolidation after a notable correction from its recent peak of approximately 196.30. The clearly defined ascending trendline, which has supported price action since mid-April, remains the critical technical feature to monitor. As the price approaches this trendline support, traders should watch for potential bullish reactions that could propel the currency pair back toward the upper resistance zone marked by the pink rectangle near 196.50. The green arrow suggests a potential path forward with an expected bounce from the trendline followed by renewed upward momentum. However, any decisive break below this trendline would invalidate the bullish structure and possibly trigger a deeper correction toward the lower support zone around 190.50, highlighted by the light blue rectangle.
Disclosure: I am part of Trade Nation's Influencer program and receive a monthly fee for using their TradingView charts in my analysis.

GBPJPY SELLRanging market on weekly chart, weekly resistance respected
Bearish pressure seen on the daily chart with the last candle bearish, downtrend on H4. Price is currently consolidating on H1. Break of support on H1 and retest for entry.
Risk - 30 pips
Reward - 71 pips
...Mrwarm cares

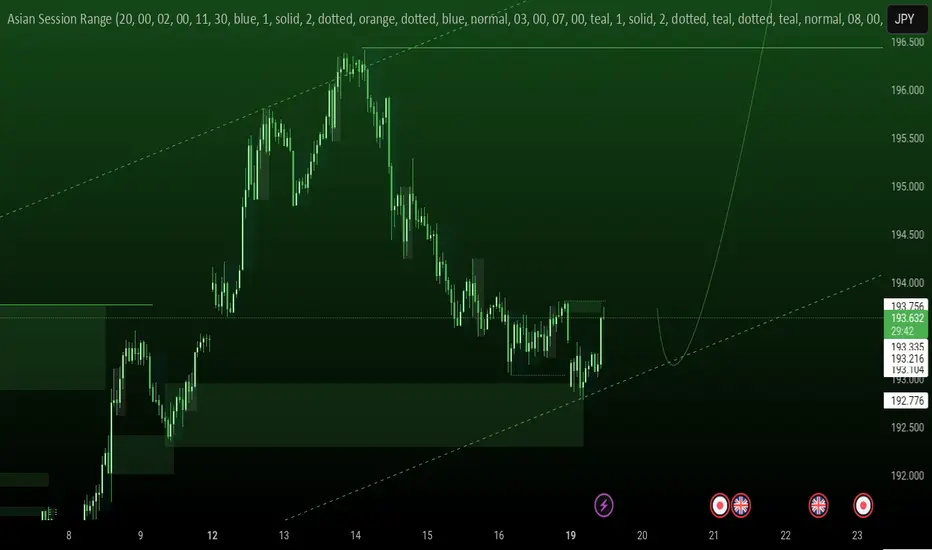
WHERE PRICE GOES...WE FOLLOW GBPJPY LONG FORECAST Q2 W21 Y25WHERE PRICE GOES...WE FOLLOW
GBPJPY LONG FORECAST Q2 W21 Y25
Professional Risk Managers👋
Welcome back to another FRGNT chart update📈
Diving into some Forex setups using predominantly higher time frame order blocks alongside confirmation breaks of structure.
Let’s see what price action is telling us today!
💡Here are some trade confluences📝
✅Weekly order block rejection
✅Daily order block rejection
✅Intraday 15' order blocks
✅Tokyo ranges to be filled
🔑 Remember, to participate in trading comes always with a degree of risk, therefore as professional risk managers it remains vital that we stick to our risk management plan as well as our trading strategies.
📈The rest, we leave to the balance of probabilities.
💡Fail to plan. Plan to fail.
🏆It has always been that simple.
❤️Good luck with your trading journey, I shall see you at the very top.
🎯Trade consistent, FRGNT X

GBP/JPY Buy OpportunityA potential buy signal is forming on GBP/JPY due to a break above a key supply zone. This breakout indicates strong bullish momentum, suggesting further upside potential.
