GBPJPY: Consolidation Phase Targeting the Main TrendHey Traders, in today's trading session we are monitoring GBPJPY for a buying opportunity around 189.600 zone, GBPJPY is trading in an uptrend and currently is in a correction phase in which it is approaching the trend at 189.600 support and resistance area.
Trade safe, Joe.
GBPJPY trade ideas

GBPJPY Sell swing ideaFollowing the harmonic pattern strategy. for it to be true. we should wait for a reversal pattern because it's alot of points. and then when the market shifts, we enter.
support and resistances plays a big role in it.
happy trading

“GBPJPY Surges 200+ Pips After Breakout – More Gains Coming?”GBPJPY Hits +200 Pips After Classic Breakout – More Upside Ahead?
Description:
In a recent analysis shared here, GBPJPY followed through perfectly after breaking out of a bullish triangle pattern. The pair surged over +200 pips, breaching the key resistance zone around 191.00 and now trading near 193.20.
This breakout aligns with strong bullish momentum on the daily chart. While a minor pullback may occur, the next potential upside targets are 195.00, followed by the major 200.00 psychological level, where historical resistance lies.
As long as price holds above the 190.00 support zone, the bullish scenario remains valid. Traders may watch for intraday corrections to rejoin the uptrend.
Follow for more updates and trade setups across major FX pairs.

GBPJPY LONG SETUP UPDATE: FULL TAKE-PROFIT ARCHIVED Excellent execution! Our 1:2 full take-profit target has been reached. Well done! Enjoy the profits and let's look forward to the next trading opportunity.

GBPJPY INTRADAY rising wedge capped at 192.87The GBPJPY pair is exhibiting a bearish sentiment, reinforced by the ongoing downtrend. The key trading level to watch is at 192,87 which represents the current intraday swing high.
In the short term, an oversold rally from current levels, followed by a bearish rejection at the 192.87 resistance, could lead to a downside move targeting support at 190.15 with further potential declines to 188.70 and 187.50 over a longer timeframe.
On the other hand, a confirmed breakout above the 192.87 resistance level and a daily close above that mark would invalidate the bearish outlook. This scenario could pave the way for a continuation of the rally, aiming to retest the 193.65 resistance, with a potential extension to 194.40 levels.
Conclusion:
Currently, the GBPJPY sentiment remains bearish, with the 192.87 level acting as a pivotal resistance. Traders should watch for either a bearish rejection at this level or a breakout and daily close above it to determine the next directional move. Caution is advised until the price action confirms a clear break or rejection.
This communication is for informational purposes only and should not be viewed as any form of recommendation as to a particular course of action or as investment advice. It is not intended as an offer or solicitation for the purchase or sale of any financial instrument or as an official confirmation of any transaction. Opinions, estimates and assumptions expressed herein are made as of the date of this communication and are subject to change without notice. This communication has been prepared based upon information, including market prices, data and other information, believed to be reliable; however, Trade Nation does not warrant its completeness or accuracy. All market prices and market data contained in or attached to this communication are indicative and subject to change without notice.

GBPJPY 4h Long Setup Clear bullish structure with clean higher highs and higher lows intact
Price formed a bull flag after a strong impulse leg showing continuation potential
Breakout of the flag confirms momentum with aggressive bullish candle and volume
Entry : 192.459
SL : 188.167
TP : Trail 195.898
RR 1 : 3.1
Market is flowing with bullish pressure and breakout indicates wave extension
No counter structure in sight, trend continuation expected
Let the market breathe and move

GBPJPY Top-down analysis Hello traders, this is a complete multiple timeframe analysis of this pair. We see could find significant trading opportunities as per analysis upon price action confirmation we may take this trade. Smash the like button if you find value in this analysis and drop a comment if you have any questions or let me know which pair to cover in my next analysis.

GBPJPY...SHORT OANDA:GBPJPY
This is a technical scenario, not a guaranteed prediction. The zone is becoming a key area of interest. No confirmation, no trade.
If confirmed breakout and retest occur, I’ll look to trade in alignment with the new structure.

GBPJPY long entry Predicting the price would reach the channel top line. Bullish pattern + broke the key level and retesting. This is only my idea, I will share the results later.

GBP/JPY Eyeing 19.200 After Bullish Pennant FormationGBP/JPY 30-Minute Chart Analysis
Pattern: Bullish Pennant
Target: 192.200
Market Structure:
The chart illustrates a classic bullish pennant:
A strong bullish impulse (flagpole) led price sharply from around 189.400 to 191.400.
This was followed by a tight consolidation phase, forming a pennant with converging trendlines.
The consolidation shows a battle between buyers and sellers, but within a bullish context, it's a sign of potential continuation.
Technical Outlook:
The price recently bounced off the pennant's lower trendline, showing buyers defending support.
A breakout above the pennant resistance near 191.400 would confirm bullish continuation.
The consolidation is occurring near recent highs, indicating bulls are in control and preparing for the next leg up.
Projection & Target:
Flag pole height: Approximately 200 pips.
Breakout projection: From 191.400 breakout zone, add 200 pips.
Target: 192.200
Trade Plan:
Entry: After a confirmed breakout above 191.400 (preferably with volume or a strong candle close).
Stop-Loss: Below recent swing low or pennant support (190.800).
Take-Profit: 192.200

GJ-Thu-1/05/25 TDA-BoJ rate unchanged, clean move up!Analysis done directly on the chart
We will never catch every single move.
It's true sometimes can be frustrating but,
learn to control yourself and not FOMOing
is a psychological skill. We often times
underestimate how important is psychology
in trading!
Not financial advice, DYOR.
Market Flow Strategy
Mister Y

GBPJPY LONG SETUP UPDATE: 1:1 PROFIT ACHIEVED With our 1:1 profit target achieved, we'll now aim for a 1:2 ratio. To lock in some gains, let's secure half of the profits and allow the remaining position to run towards the full take-profit level.
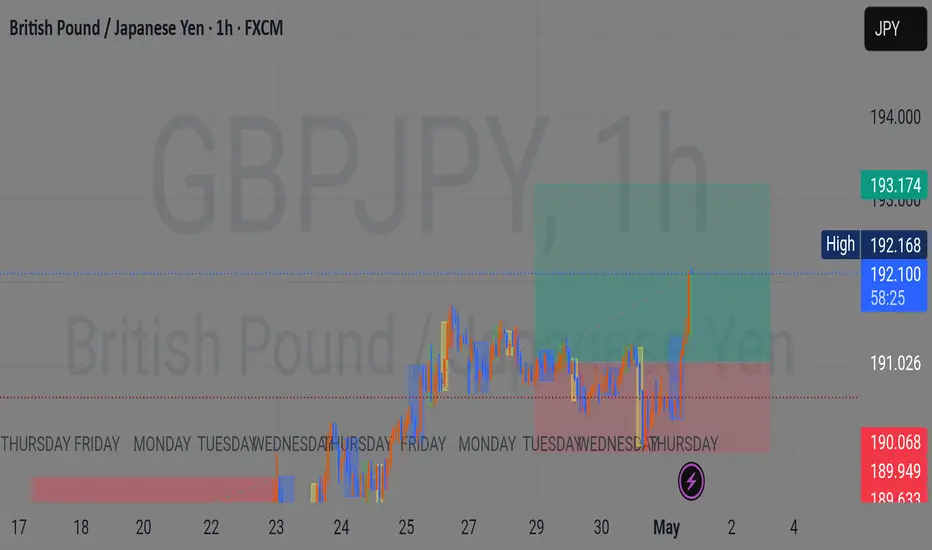
GBPJPY – May 1st OutlookDuring the Asian session, GBPJPY finally broke out of the bullish wedge we highlighted yesterday and is now breaching the key 192.000 buy level.
We’re watching for a break + retest/continuation setup here on the lower timeframes. A clean confirmation opens the move toward 193.000 — a solid 100 pip range before reassessing.

TRADING PLAN: GBPJPY LONG TRADE SETUP Given the bullish sentiment in GJ today, and the successfully breaking out of the Asian session high, we'll take a long position. Our initial target is a 1:1 risk-reward ratio, followed by a 1:2 ratio after securing some profits.

GBPJPY BUY ANALYSISPEPPERSTONE:GBPJPY , buy analysis, the content of this post contains a well detailed GBPJPY buy analysis from dailytf till h2. The reason why im looking to buy, the reason to my SL including TP levels, are all explained on this post.

GBPJPY PLAnpossible whipsaw today to continue the move up,il be keeping close eye not to trade against the bullish trend too long
