BUYPrevious Day Low
Trend Line Rejection
Divergence Volume
London Session
Previous Week High Breach
Market Structure Shift Bullish
GBPJPY trade ideas

4H CHoCH Formed – Short from Supply with CautionHello Traders,
Today we’ve seen a Change of Character (CHoCH) form on the 4-hour chart after price broke above the higher time frame’s weak high (HH) from yesterday. This suggests we’re now in a bearish counter-trend pullback phase. Trading short from the 4H supply zone with lower time frame (LTF) confirmation presents a high-probability setup.
However, keep in mind that on the daily chart, price is reacting from a Fair Value Gap (FVG) or imbalance zone, meaning there’s still a chance price could push higher. So using LTF confirmation before entering shorts is essential.

IDEA TRADE GBPJPY LONG POSITION Hi Traders
Pair: GBPJPY
📈 Position: LONG (BUY)
✅ Entry: 198.600
🔺 SL: 198.250 (-35 pips )
🎯 Take Profits:
• TP 1: 198.950
• TP 2: 199.300
• TP 3: 199.650 Trailing SL)

GJ-Wed-09/07/25 TDA-Asian push, price hit our 4hR 199.723Analysis done directly on the chart
Follow for more, possible live trades update!
I often share my live trades in Tradingview public chat in London session, stay tuned!
When you have a specific trading time during the day,
it's can be frustrating when moves happen outside of
your trading time. But remember this is part of the game,
we will never catch every single move on the chart.
Don't force the entries, learn to get used to it.
Premise:
A simple idea plan (like Tradingview public posts) won't describe everything.
No one can predict how market will move, it's always good to react to how it moves.
It gives an idea of how price might move, but no one come from FUTURE.
So I always encourage people to openly and actively discuss in real time.
For example discussing on Tradingview public chat (and more).
I don't give signals blindly, people should learn
and understand the skill.
Following blindly signals you won't know how to
manage the trade, where precisely put sl and tp,
lot size and replicate the move over time.
That's why you need active real time discussions.
Trading is not get rich quick scheme!
Active in London session!
Not financial advice, DYOR.
Market Flow Strategy
Mister Y

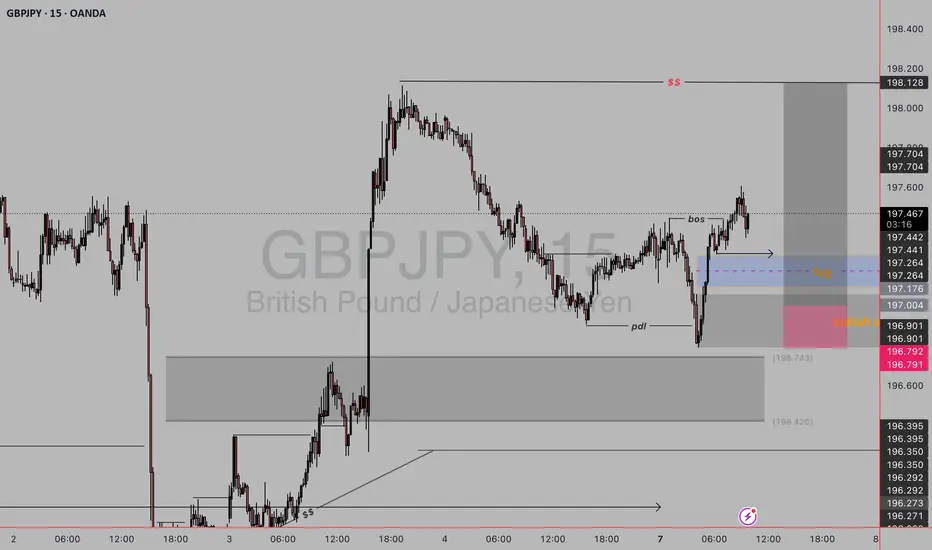
gbpjpy sell setup🔍 Key Concepts in This Setup:
1. Break of Structure (BOS) – Bullish Shift
The BOS shows that price has broken above a previous swing high, signaling a shift from bearish to bullish market structure.
This confirms bullish intent and opens the door for pullback buys.
2. Fair Value Gap (FVG) – Blue Zone
This imbalance zone is created when price aggressively moves up, leaving a gap.
Price is expected to return to this area to fill orders before continuing up.
3. Bullish Order Block – Orange Zone
A bullish order block (OB) is marked just below the FVG.
It represents the last bearish candle before a bullish impulse — an area where institutions may re-enter long positions.
4. PDL Sweep (Previous Day Low)
Price took out the previous day’s low (PDL) and then reversed.
This is a liquidity grab – a classic smart money move before shifting bullish.
5. Premium to Discount Retracement
Price moved from a discount zone after sweeping lows and breaking structure.
Now waiting for a retracement back into a discounted FVG/OB zone to enter a buy.
✅ Buy Entry Plan:
Entry Zone: Around the FVG + OB confluence (196.90–197.10 area).
Confirmation: You might wait for bullish PA (price action) like a bullish engulfing or lower-timeframe BOS at the FVG.
Stop Loss: Below the order block or just under 196.79.
Target: Back to recent highs near 198.10 or even the supply zone (SS) above it.
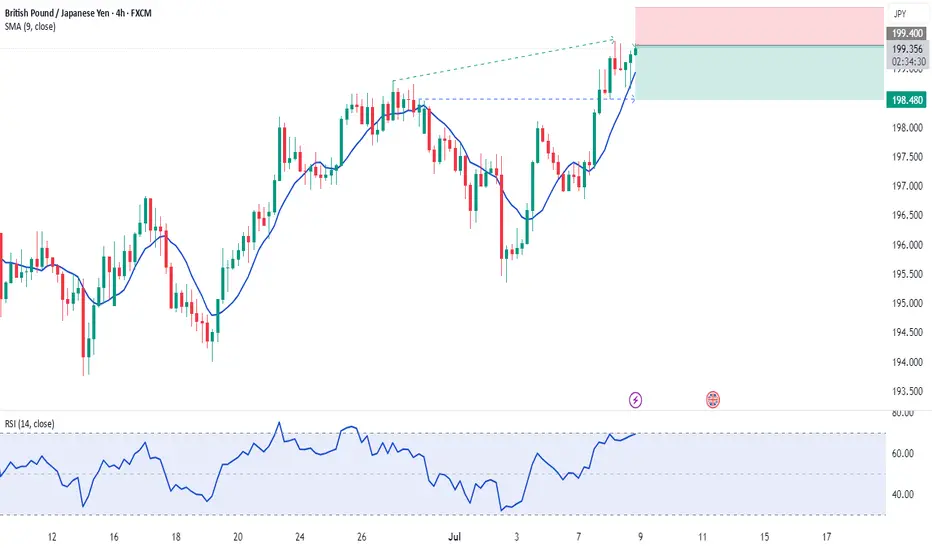
GBP/JPY BEARISH AB = CD PATTERN Potential Short Opportunity fromMarket Structure
Price formed a Higher High (HH) and is now completing a Bearish AB=CD harmonic
pattern
The Potential Reversal Zone (PRZ) has been tapped
RSI shows bearish divergence at the second HH, suggesting weakening bullish
momentum
Technical Details:
Pattern: Bearish AB=CD with clear symmetry
Key zone: PRZ between 198.684 and 199.128
Bearish RSI divergence adds extra confluence
Potential Sell Stop strategy below structure for safer entry confirmation
Bias Bearish (Pattern Completion + Divergence)
Short bias is activated only on the confirmation, either by sell-stop break or strong
rejection candles inside PRZ
If the price breaks above 199.128, the bearish setup is invalidated
Trade Plan
Action Level / Condition
Sell Entry Below 198.684 (Sell Stop Trigger Zone)
Stop Loss Above 199.128 (invalidation of PRZ)
Target 1 198.066
Final Tp 197.564
✅ Wish you best of luck and happy trading!

GBPJPY...LONGPrice is nearing a critical level around . No setup, no trade. For me, a solid plan always comes before any prediction.
If the zone is broken and confirmed with a retest, I’ll adjust my plan accordingly for a possible reverse trade.

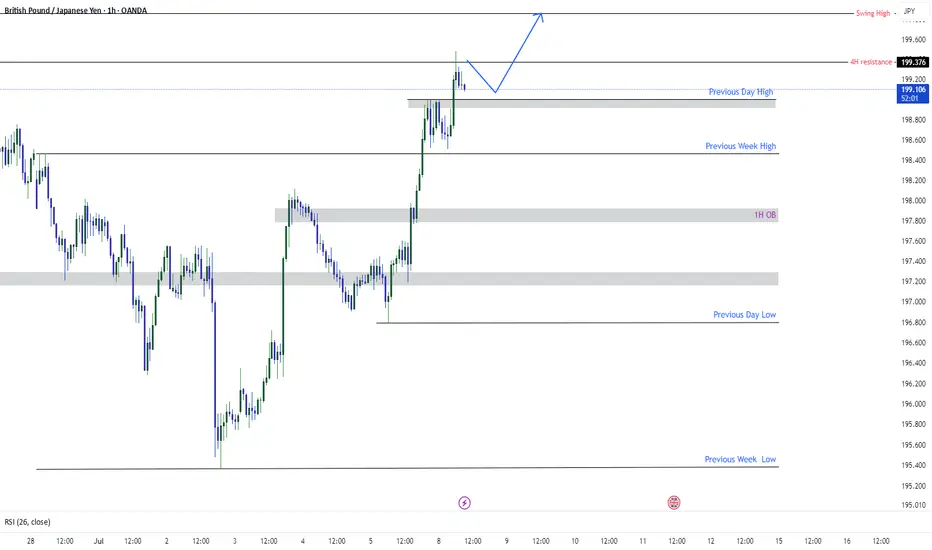
GBPJPY Targeting SwingGBPJPY has currently broken previous day high and wants to target the swing high which is 199.857 after retracing form previous 4H resistance GJ wants to travel to swing high. Chart is showing everything clearly. do not make things complex. Simplify as much as you can.
BUYPrevious Day Low
Trend Line Rejection
Divergence Volume
London Session
Previous Week High Breach
Market Structure Shift Bullish
Watch
Trade
Manage
Smile

British Pound / Japanese Yen - 4H Chart (OANDA)4-hour chart from OANDA displays the GBP/JPY currency pair's price movement, with the current price at 199.248 (+0.024 or +0.01%). The chart highlights a recent upward trend, breaking through a resistance level around 199.274, with buy and sell indicators at 199.274 and 199.220 respectively. Key price levels include a high of 199.923 and a low of 198.188, with the chart spanning from June to early August 2025.

GBPJPY Shown Good Pullback after hitting Swing HighAs share earlier GJ show good bullish move and hit swing high. After hitting swing has given a good pull back and entered into the trade. The engulfing hourly candle showing strong pullback which will possibly go further down to retest a demand zone and an area.

GBPJPY OutlookClean Sweep Event (SE) tapped liquidity, followed by a Trend Signature Shift (TSS) hinting bullish reversal. Eyes on price retesting the LRP zone before targeting Primary Liquidity at 198.800, with extended focus on the OCZ/W-PIZ zone above 199.500.

GBPJPY BullishAfter exiting a correction, the first impulse (Wave 1) appears. I expect a retracement of at least 50% of the Fibonacci.
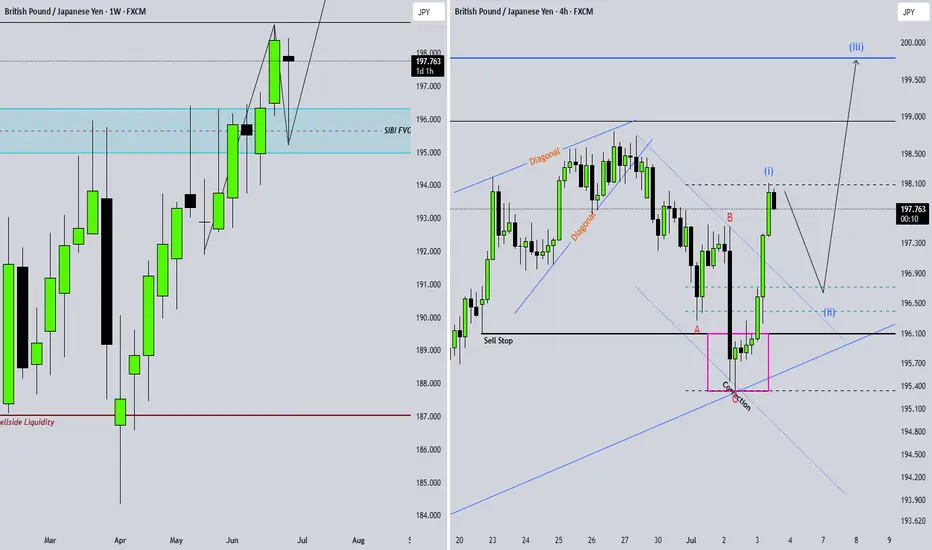
possibility of uptrendAs long as the price is above the green support range, the continuation of the upward trend is likely. Upon reaching the 100% level, a correction trend will probably form.

sell GBPJPYprice rejected the supply with pressure, i think the supply is increasing and buyers have lost momentum.

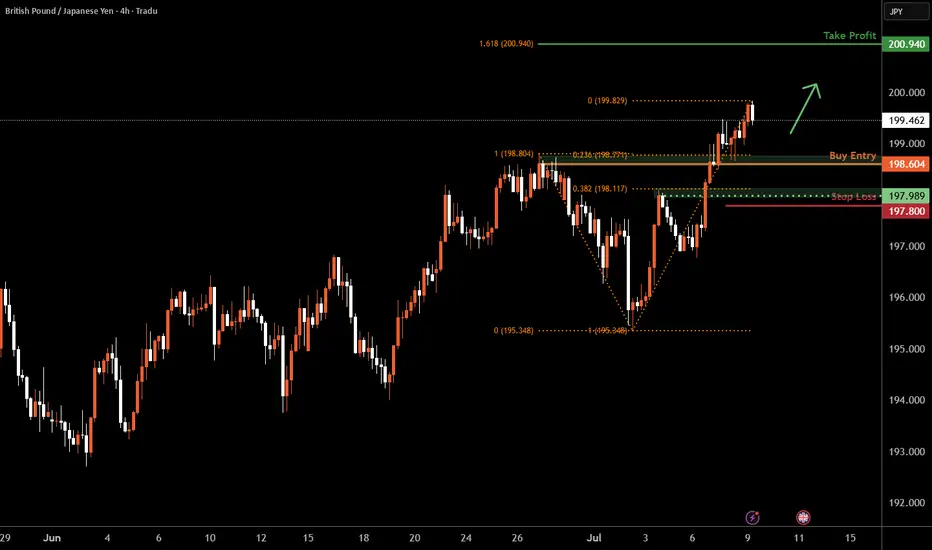
GBP/JPY H4 | Falling toward a pullback supportGBP/JPY is falling towards a pullback support and could potentially bounce off this level to climb higher.
Buy entry is at 198.60 which is a pullback support that aligns with the 23.6% Fibonacci retracement.
Stop loss is at 197.80 which is a level that lies underneath a pullback support and the 38.2% Fibonacci retracement.
Take profit is at 200.94 which is a resistance that aligns with the 161.8% Fibonacci extension.
High Risk Investment Warning
Trading Forex/CFDs on margin carries a high level of risk and may not be suitable for all investors. Leverage can work against you.
Stratos Markets Limited (tradu.com ):
CFDs are complex instruments and come with a high risk of losing money rapidly due to leverage. 63% of retail investor accounts lose money when trading CFDs with this provider. You should consider whether you understand how CFDs work and whether you can afford to take the high risk of losing your money.
Stratos Europe Ltd (tradu.com ):
CFDs are complex instruments and come with a high risk of losing money rapidly due to leverage. 63% of retail investor accounts lose money when trading CFDs with this provider. You should consider whether you understand how CFDs work and whether you can afford to take the high risk of losing your money.
Stratos Global LLC (tradu.com ):
Losses can exceed deposits.
Please be advised that the information presented on TradingView is provided to Tradu (‘Company’, ‘we’) by a third-party provider (‘TFA Global Pte Ltd’). Please be reminded that you are solely responsible for the trading decisions on your account. There is a very high degree of risk involved in trading. Any information and/or content is intended entirely for research, educational and informational purposes only and does not constitute investment or consultation advice or investment strategy. The information is not tailored to the investment needs of any specific person and therefore does not involve a consideration of any of the investment objectives, financial situation or needs of any viewer that may receive it. Kindly also note that past performance is not a reliable indicator of future results. Actual results may differ materially from those anticipated in forward-looking or past performance statements. We assume no liability as to the accuracy or completeness of any of the information and/or content provided herein and the Company cannot be held responsible for any omission, mistake nor for any loss or damage including without limitation to any loss of profit which may arise from reliance on any information supplied by TFA Global Pte Ltd.
The speaker(s) is neither an employee, agent nor representative of Tradu and is therefore acting independently. The opinions given are their own, constitute general market commentary, and do not constitute the opinion or advice of Tradu or any form of personal or investment advice. Tradu neither endorses nor guarantees offerings of third-party speakers, nor is Tradu responsible for the content, veracity or opinions of third-party speakers, presenters or participants.

Shorty GbpJpyLook for liquidity sweep at the end of each trend
Mark your retracement zones
Use Fibonacci to find your sl and tp zones
Rule of your deposit
Try to set sl at 10% of your deposit
Use a reasonable lot size
AND MAKE A TRADE

GBPJPY Extremely BullishAs described earlier GJ is extremely bullish and wants to target previous swing. current trading at 199.400 and travelling to the 199.857 which is previous swing high. In my yesterday's analysis I have given clue of GJ's being retracing and accumulating and going up again same is showing. We can see a pullback after taking swing high.

GBPJPY: Bearish Forecast & Outlook
Looking at the chart of GBPJPY right now we are seeing some interesting price action on the lower timeframes. Thus a local move down seems to be quite likely.
Disclosure: I am part of Trade Nation's Influencer program and receive a monthly fee for using their TradingView charts in my analysis.
❤️ Please, support our work with like & comment! ❤️

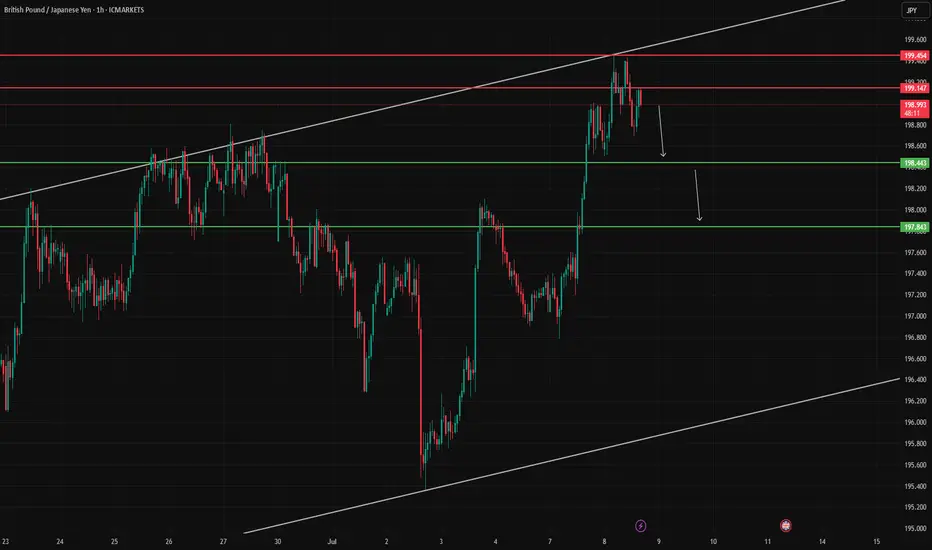
GBPJPY – Rejected from Upper Channel LineGBPJPY has failed to break above the upper channel resistance at 199.454. The pair is now showing signs of bearish rejection.
Targets to watch:
🔻 First: 198.443
🔻 Second: 197.843
Invalidation above 199.454 would negate the setup.
GBP/JPYGBP/JPY has been bullish since April, since then price has reached a significant key area at 199.000-200.000. Over the next few days/weeks i shall be watching this pair to see if price rejects this key zone or if its able to push through. This will determine my next move as to whether we go short or long.
