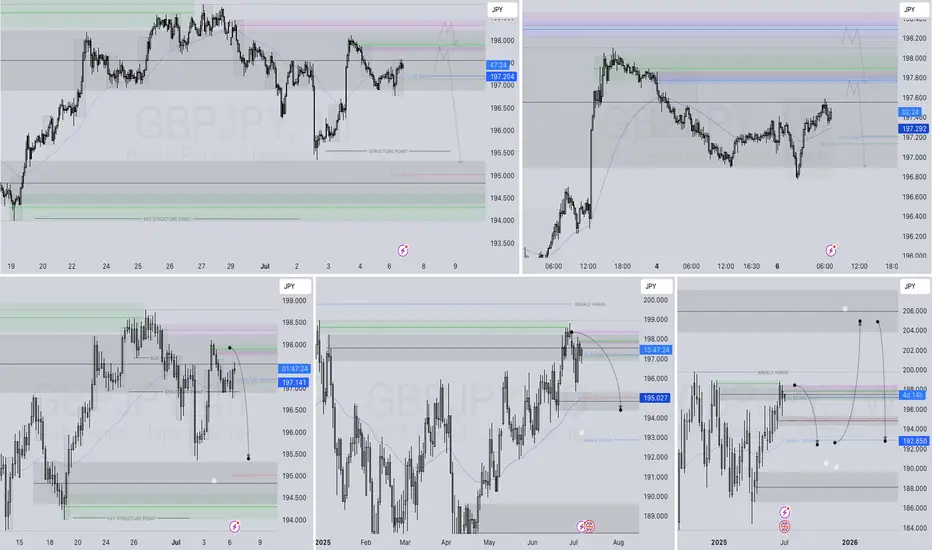
GJ-Tue-08/07/25 TDA-Trump's new tariff 25% on Japan, YEN weakAnalysis done directly on the chart
Follow for more, possible live trades update!
I often share my live trades in Tradingview public chat in London session, stay tuned!
Trump's new tariff 25% on Japan and South Korea has Yen weakening
further more significantly. Historically JXY is at minimum levels, where
BoJ can possibly intervene and buy back YEN and strengthening it.
Possibly causing massive dump on GJ like 100-200-300 pips move
within minutes. Always be careful and stay up to date to recent global
events and more.
Premise:
A simple idea plan (like Tradingview public posts) won't describe everything.
No one can predict how market will move, it's always good to react to how it moves.
It gives an idea of how price might move, but no one come from FUTURE.
So I always encourage people to openly and actively discuss in real time.
For example discussing on Tradingview public chat (and more).
I don't give signals blindly, people should learn
and understand the skill.
Following blindly signals you won't know how to
manage the trade, where precisely put sl and tp,
lot size and replicate the move over time.
That's why you need active real time discussions.
Trading is not get rich quick scheme!
Active in London session!
Not financial advice, DYOR.
Market Flow Strategy
Mister Y
GBPJPY trade ideas

gbpjpy long outlookif anyone see any different lmk what you see. whati am seeing based off weekly chart is price breaking ristance asreas and moving on up to another ristsance zone. what do you guys think
?

IDEA TRADE GBPJPY LONG POSITION Hi Traders
Pair: GBPJPY
📈 Position: LONG (BUY)
✅ Entry: 197.150
🔺 SL: 196.750 (-40 pips )
🎯 Take Profits:
• TP 1: 197.550
• TP 2: 197.950
• TP 3: 198.350 Trailing SL)

Possibility of uptrend It is expected that a trend change will take place within the green support area and we will witness the start of an upward trend. Otherwise, the correction trend will continue to the next support levels.

BUY GBPJPYWhile everyone sells, the chart prints signs of bullish movement. Buy this double bottom from 197,2 and take profit it 198. 80 pips trade

GBPJPY SHORT DAILY FORECAST Q3 D7 W28 Y25GBPJPY SHORT DAILY FORECAST Q3 D7 W28 Y25
Professional Risk Managers👋
Welcome back to another FRGNT chart update📈
Diving into some Forex setups using predominantly higher time frame order blocks alongside confirmation breaks of structure.
Let’s see what price action is telling us today! 👀
💡Here are some trade confluences📝
✅Daily Order block identified
✅4H Order Block identified
✅1H Order Block identified
🔑 Remember, to participate in trading comes always with a degree of risk, therefore as professional risk managers it remains vital that we stick to our risk management plan as well as our trading strategies.
📈The rest, we leave to the balance of probabilities.
💡Fail to plan. Plan to fail.
🏆It has always been that simple.
❤️Good luck with your trading journey, I shall see you at the very top.
🎯Trade consistent, FRGNT X
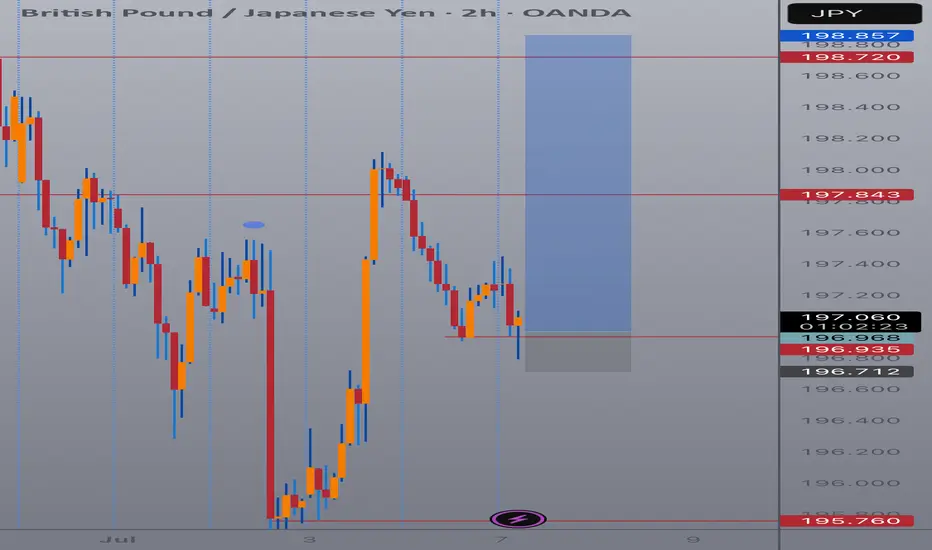
GBP 2HORS BULISH ANALYSISThe image shows a computer screen displaying a trading platform, specifically a chart for the British Pound/Japanese Yen (GBPJPY) currency pair. The chart is set to a 2-hour time frame and features a black background with red and blue bars indicating price movements.

GBPJPY Breakout and Potential RetraceHey Traders, in the coming week we are monitoring GBPJPY for a buying opportunity around 196.600 zone, GBPJPY was trading in a downtrend and successfully managed to break it out. Currently is in a correction phase in which it is approaching the retrace area at 196.600 support and resistance zone.
Trade safe, Joe.

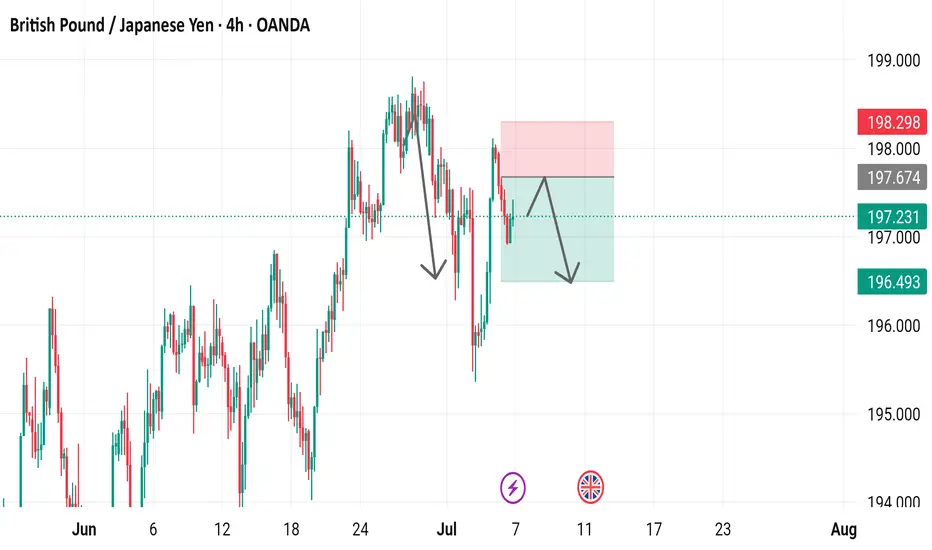
GBP/JPY 4-Hour Chart Analysis - OANDA4-hour chart of the British Pound (GBP) against the Japanese Yen (JPY) from OANDA shows a recent price of 197.231, with a decrease of 0.653 (-0.33%). The chart highlights a sell signal at 197.006 and a buy signal at 197.456, with a 45.0 pip difference. A downward trend is indicated with a shaded resistance zone between 198.298 and 197.674, suggesting potential selling pressure as the price approaches this level. The chart covers data from late June to early July 2025.
BUY GBPJPY now for a four hour time frame bullish trend continuBUY GBPJPY now for a four hour time frame bullish trend continuation ...............
STOP LOSS: 196.33
This buy trade setup is based on hidden bullish divergence trend continuation trading pattern
TAKE PROFIT : take profit will be when the trend comes to an end, feel from to send me a direct DM if you have any question about take profit or anything...
Remember to risk only what you are comfortable with... trading with the trend, patient and good risk management is the key to success here

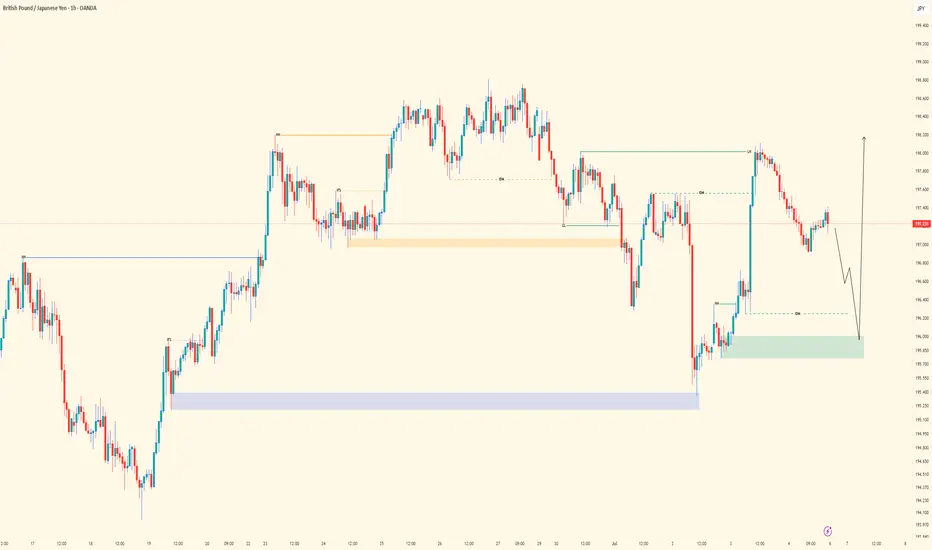
GJ| - Bullish Flow Maintained |Continuation into Next Week Pair: GBPJPY
Bias: Bullish
Timeframes: 4H, 1H, 30M
• 4H structure remains clean and bullish — no break in flow. Price is still respecting HTF order and momentum.
• 30M gave us that deeper SSL sweep, likely grabbing the early buyers and fast hands. But we stayed patient and followed the structure.
• 1H shows my view clearly — bullish pressure confirmed with reaction from OB and shift in momentum.
🔹 Entry: After sweep of SSL into demand (OB)
🔹 Entry Zone: Green zone marked — same level from earlier in the week
🔹 Target: Near structure highs — letting price flow up clean
Mindset: Week played out with precision. All levels still valid going into next week — no need to erase, just observe how price continues to respect our framework.
Bless Trading!
GBP 2 HOURS BEARISH ANALYSIS GBP JPY market may be going for sell side. the market which I have target will definitely achieve it.

GBPJPY Will Go Up! Buy!
Please, check our technical outlook for GBPJPY.
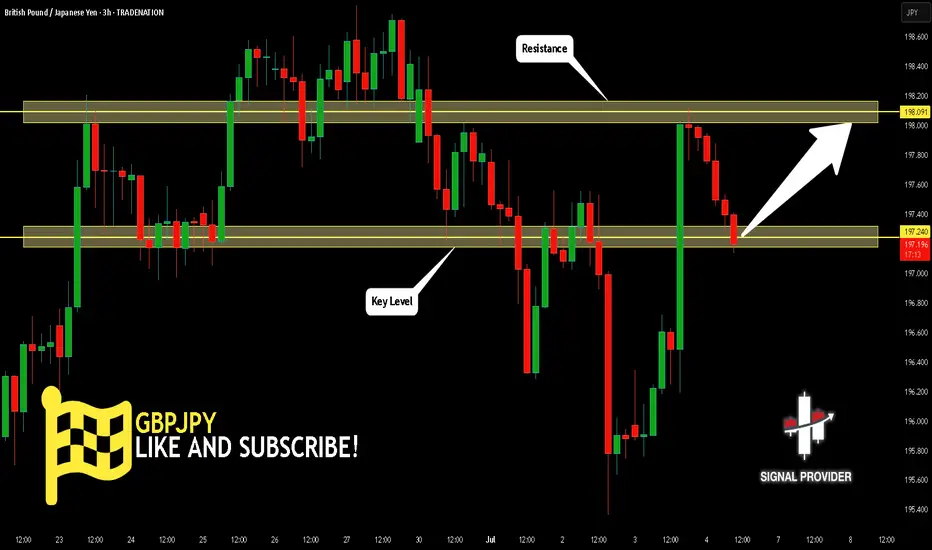
Time Frame: 3h
Current Trend: Bullish
Sentiment: Oversold (based on 7-period RSI)
Forecast: Bullish
The market is approaching a key horizontal level 197.240.
Considering the today's price action, probabilities will be high to see a movement to 198.091.
P.S
Please, note that an oversold/overbought condition can last for a long time, and therefore being oversold/overbought doesn't mean a price rally will come soon, or at all.
Disclosure: I am part of Trade Nation's Influencer program and receive a monthly fee for using their TradingView charts in my analysis.
Like and subscribe and comment my ideas if you enjoy them!
04.07.25 Morning ForecastPairs on Watch -
FX:GBPJPY
FX:USDJPY
OANDA:XPTUSD
FX:EURCAD
A short overview of the instruments I am looking at for today, multi-timeframe analysis down to what I will be looking at for an entry. Enjoy!

GBPJPY SHORT DAILY FORECAST Q3 D4 W27 Y25GBPJPY SHORT DAILY FORECAST Q3 D4 W27 Y25
Professional Risk Managers👋
Welcome back to another FRGNT chart update📈
Diving into some Forex setups using predominantly higher time frame order blocks alongside confirmation breaks of structure.
Let’s see what price action is telling us today! 👀
💡Here are some trade confluences📝
✅Daily Order block identified
✅4H Order Block identified
✅1H Order Block identified
🔑 Remember, to participate in trading comes always with a degree of risk, therefore as professional risk managers it remains vital that we stick to our risk management plan as well as our trading strategies.
📈The rest, we leave to the balance of probabilities.
💡Fail to plan. Plan to fail.
🏆It has always been that simple.
❤️Good luck with your trading journey, I shall see you at the very top.
🎯Trade consistent, FRGNT X

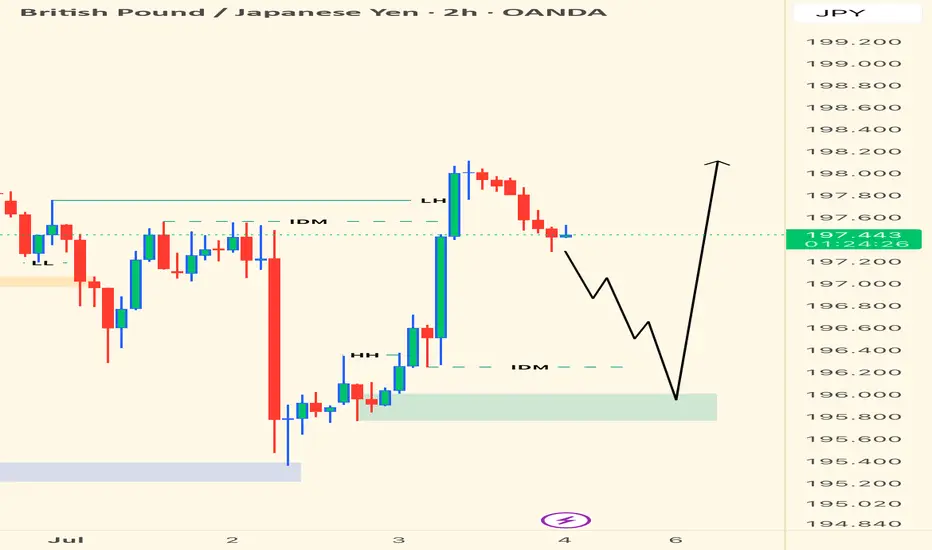
GBPJPY - Bullish Bias • Waiting to Execute from LTFPair: GBPJPY
Bias: Bullish
HTF Overview (2H): Price delivered the sweep I was patiently waiting for—textbook clean across multiple timeframes. The market has now tapped into the deeper range where real interest lies.
LTF Confirmation: All I need now is a structure shift + inducement on the 5M/1M to step in. I only move when the market shows its hand.
Entry Zone: Green zone marked on chart—expecting LTF sweep + shift before executing.
Targets: Short-term target is near the previous structure high around 198.200+.
Mindset Note: This setup has been cooking all week. Now the prep is done, I just need precision. Watching like a hawk. When it confirms—I strike.
Bless Trading!
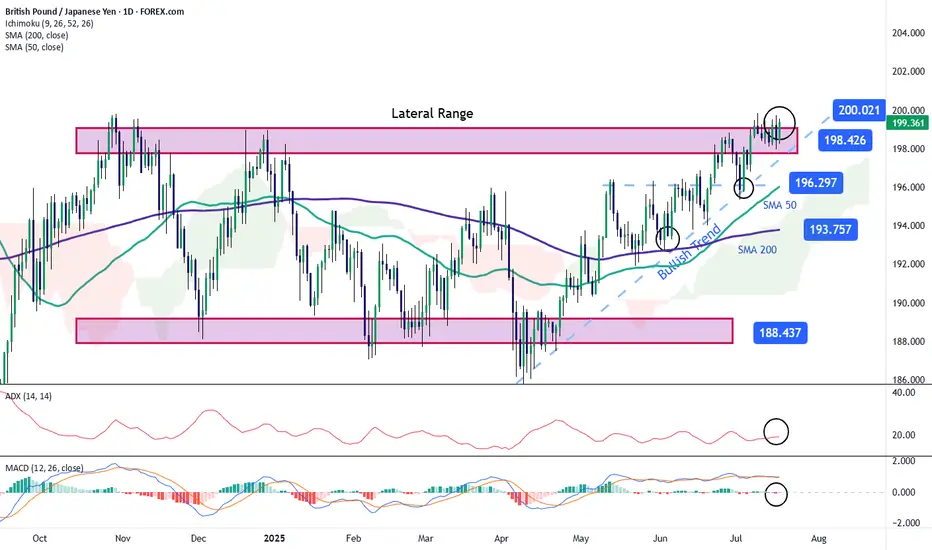
GBP/JPY: Pound Attempts to Break Out of a Broad Sideways RangeThe GBP/JPY pair has gained over 0.5% today in favor of the British pound, as the Japanese yen continues to weaken steadily. The recent escalation in the trade war, where potential 25% tariffs may begin to affect Japan in the short term, has contributed to the yen’s steady decline. For now, this remains one of the main catalysts behind the price movement, which is trending lower in the near term. As uncertainty surrounding the yen persists, buying pressure on GBP/JPY could become more significant.
Broad Sideways Range at Risk
Recent short-term bullish movements are beginning to test the upper boundary at 198.42, a key level within the broad sideways range that has dominated the chart in recent months. For now, the price could face a period of persistent neutrality as it tries to push through this upper barrier, which remains the most relevant resistance zone. If buying pressure holds steady over the coming sessions, the range could come under threat, potentially giving way to a more dominant and consistent bullish trend in the short term.
ADX
The ADX line is currently oscillating close to the 20 level, which typically indicates low average volatility over the past 14 sessions. This could be signaling a period of price consolidation, especially as the pair approaches current resistance zones.
MACD
The MACD histogram remains close to the zero line, suggesting a lack of clear direction in the short-term momentum of the moving averages. As long as this persists, it will likely reinforce the current neutral sentiment around resistance levels.
Key Levels:
200.00 – Tentative resistance zone, corresponding to the next psychological level to watch in the short term. Sustained price action above this level could confirm a breakout of the broad channel, paving the way for a dominant bullish trend.
198.42 – Nearby barrier, marking the upper boundary of the broad range. Sustained moves above this level could further reinforce the prevailing bullish bias.
196.297 – Key support level, marking the recent low. If selling pressure brings the price back to this area, the market could resume the broad sideways range seen in previous sessions.
Written by Julian Pineda, CFA – Market Analyst
GBPJPY ENTRY CHARTOn this Pair, we are still BEARISH, as its strength shifted yesterday, JPY is gaining STRENGTH, also we have a DAILY BEARISH CLOSE, we have a CHOCH on the HOURLY, ewith a LTF CONFIRMATION, with other confluences on this pair, you can add to your watch-list,if this matches with your idea, and don't forget to apply a good risk on this idea, and dont forget the rules of moving B.E after +1r

Breakout upPrice is in a right angle broadening descending triangle . Looking for breakout to the upside. 177 pips target should equal the last move down.

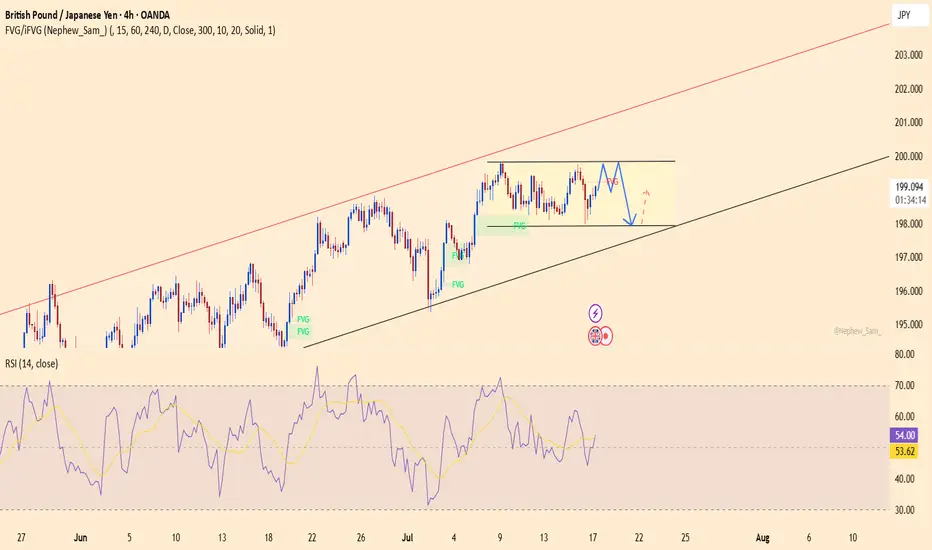
GBPJPY set for breakoutGBPJPY is currently trading in a sideways pattern within an ascending channel. The support zone around 197.900 has been respected multiple times, while price repeatedly fails to break above the 199.800 resistance – signaling that built-up pressure may soon erupt.
Recent data shows that UK inflation remains high, and the Bank of England may maintain its hawkish stance, supporting the GBP. Meanwhile, global risk-off sentiment continues to weaken the JPY.
If price breaks through the current resistance, it would confirm the continuation of the uptrend, with a target toward the upper boundary of the red channel. However, if rejection persists, buying from support remains a valid strategy.
GBPJPY SELLH&S pattern forming fibs also gives a clear sign of sell long tell with the market reversing.

GBPJPY in Premium Zones of 2008 Financial Crisis - {17/07/2025}Educational Analysis says that GBPJPY (FX pair) may give trend Trading opportunities from this range, according to my technical analysis.
Broker - FXCM
So, my analysis is based on a top-down approach from weekly to trend range to internal trend range.
So my analysis comprises of two structures: 1) Break of structure on weekly range and 2) Trading Range to fill the remaining fair value gap
Will Jpy start to lose value like it is doing since 2019 or it will do free fall same like 2008 crisis.
Let's see what this FX pair brings to the table for us in the future.
Please check the comment section to see how this turned out.
DISCLAIMER:-
This is not an entry signal. THIS IS FOR EDUCATIONAL PURPOSES ONLY.
I HAVE NO CONCERNS WITH YOUR PROFIT OR LOSS,
Happy Trading.
