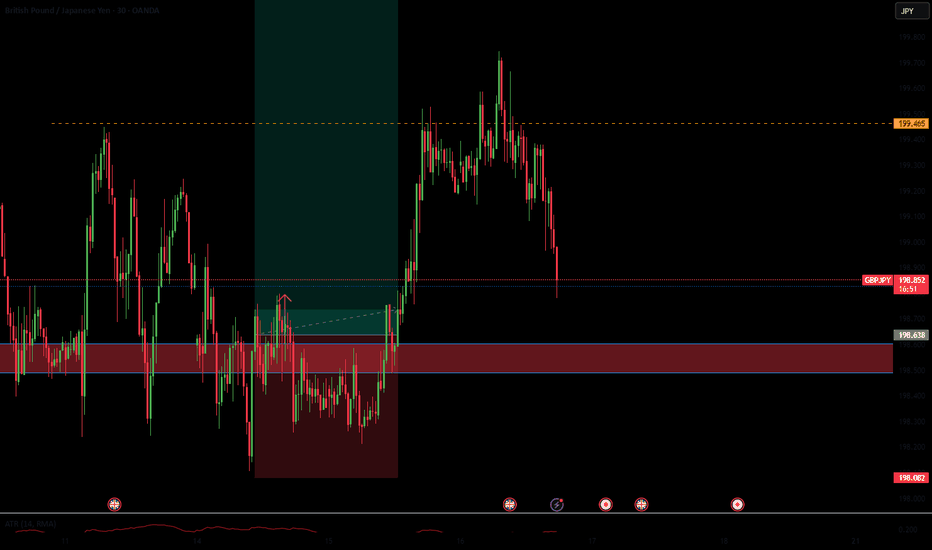
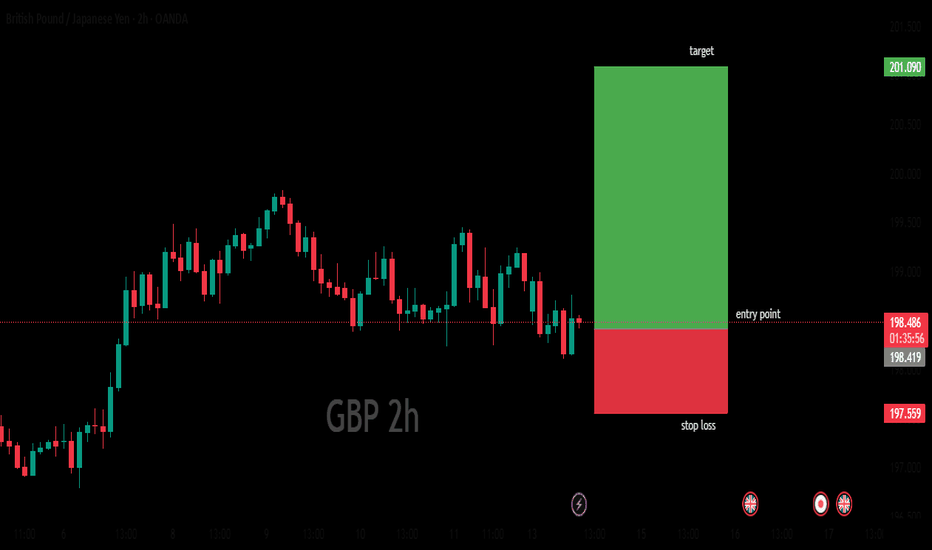
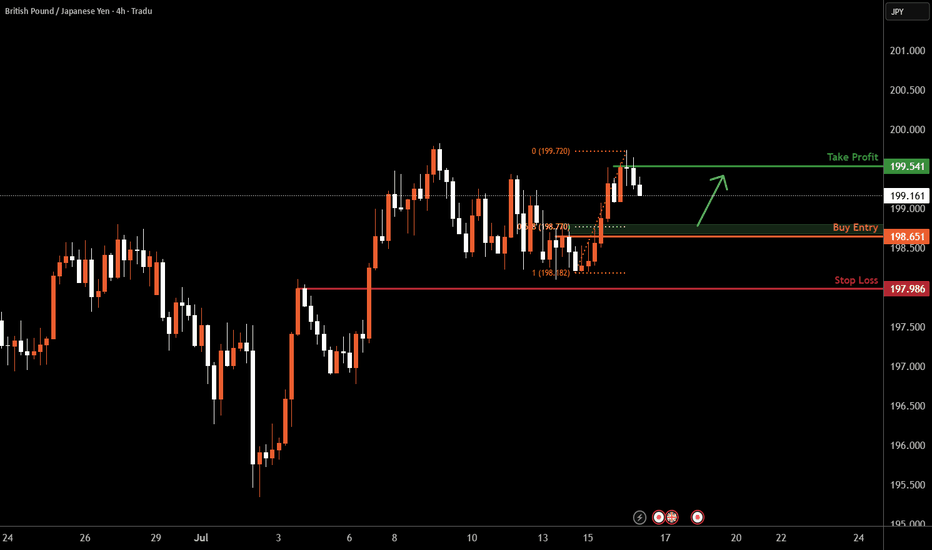
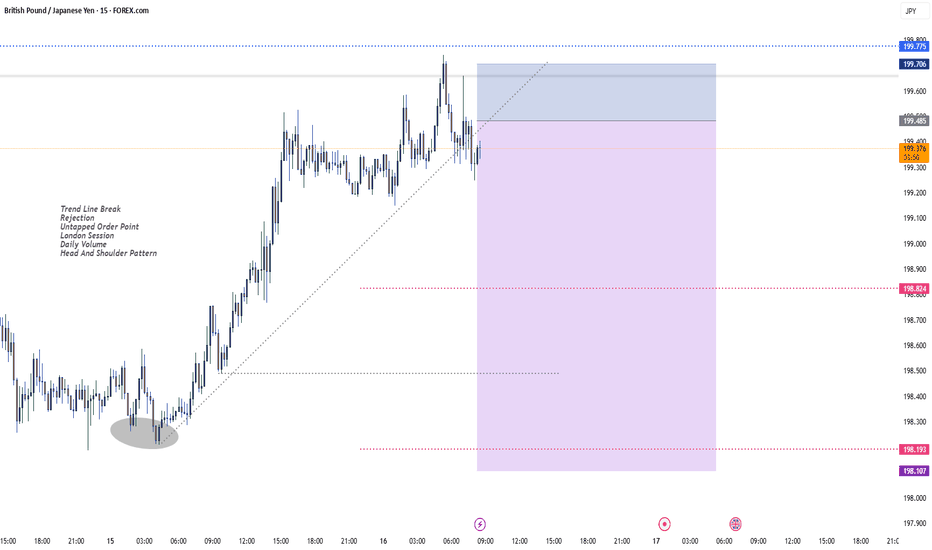
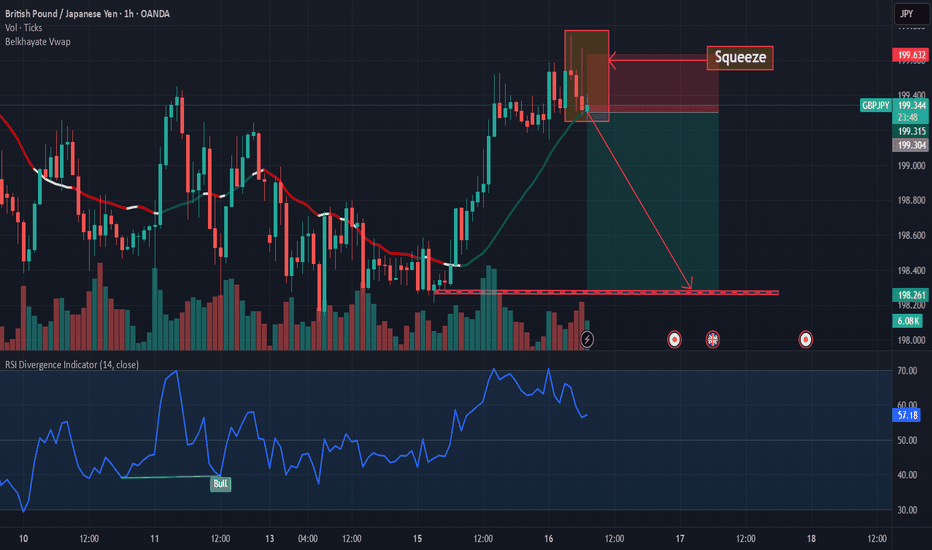
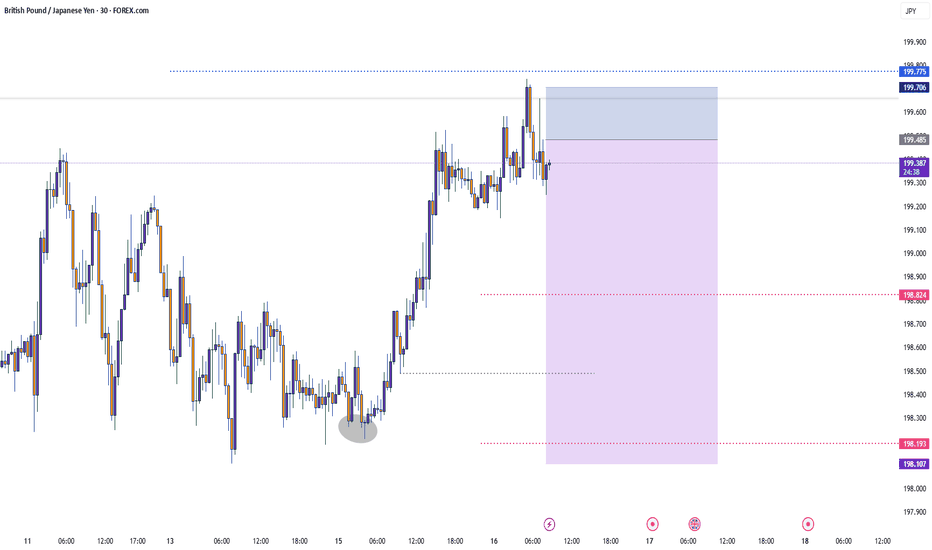
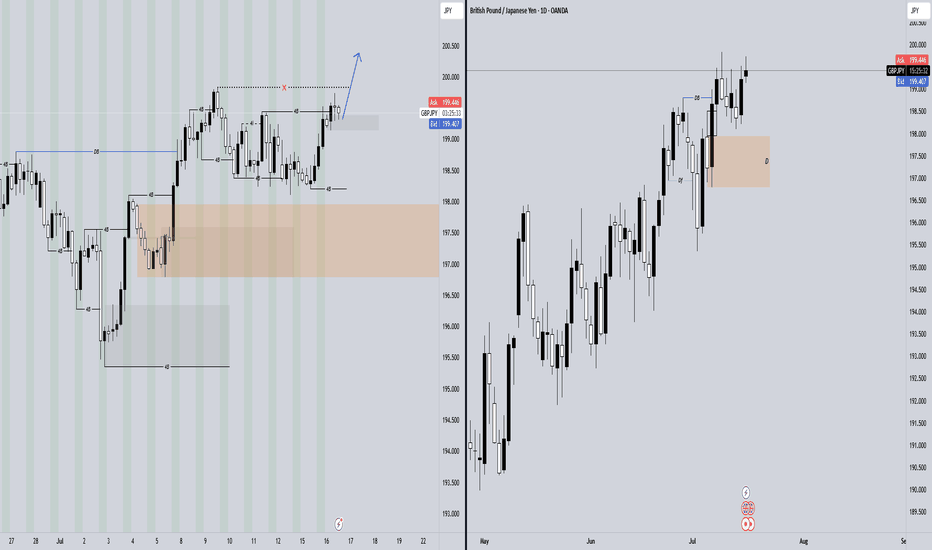
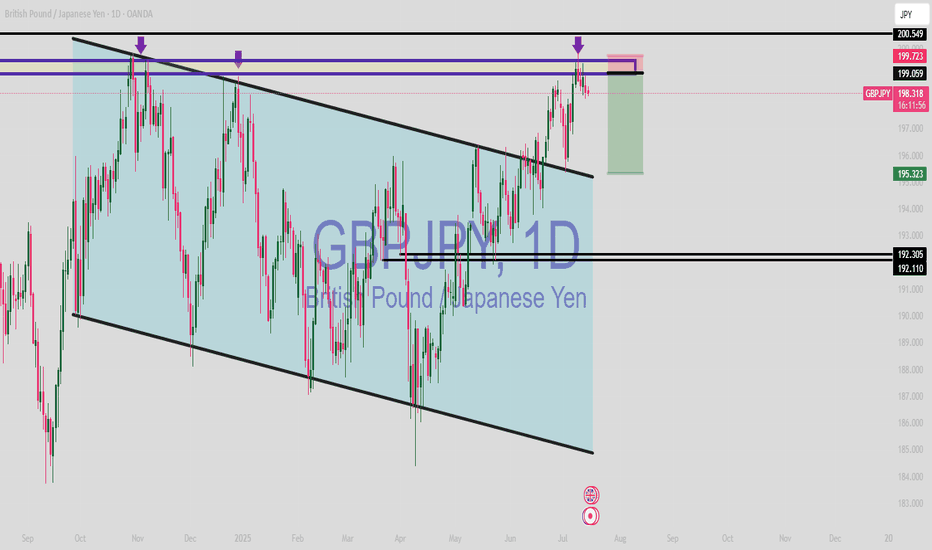
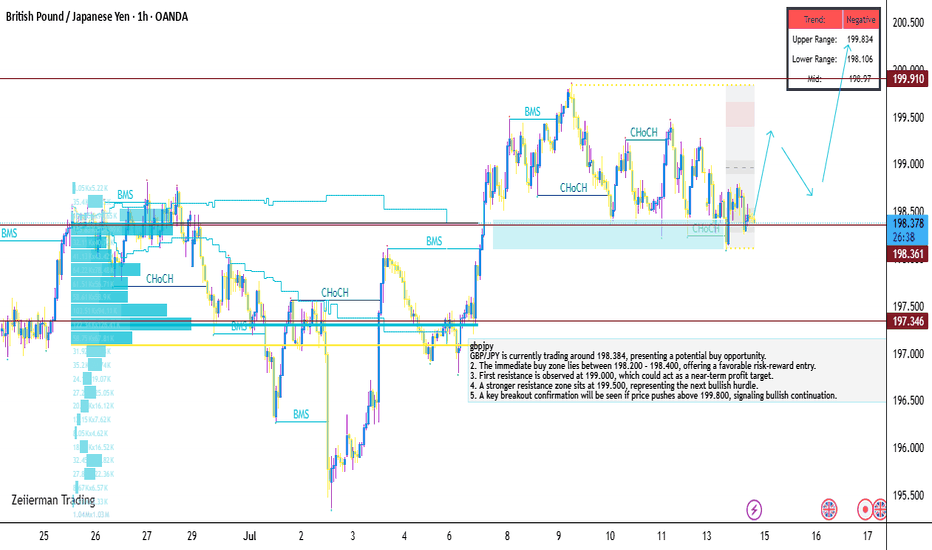
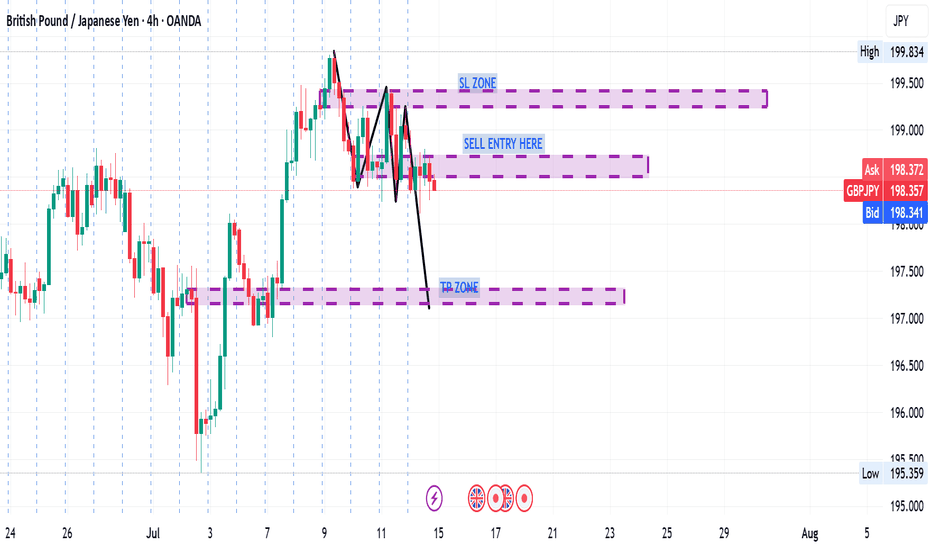
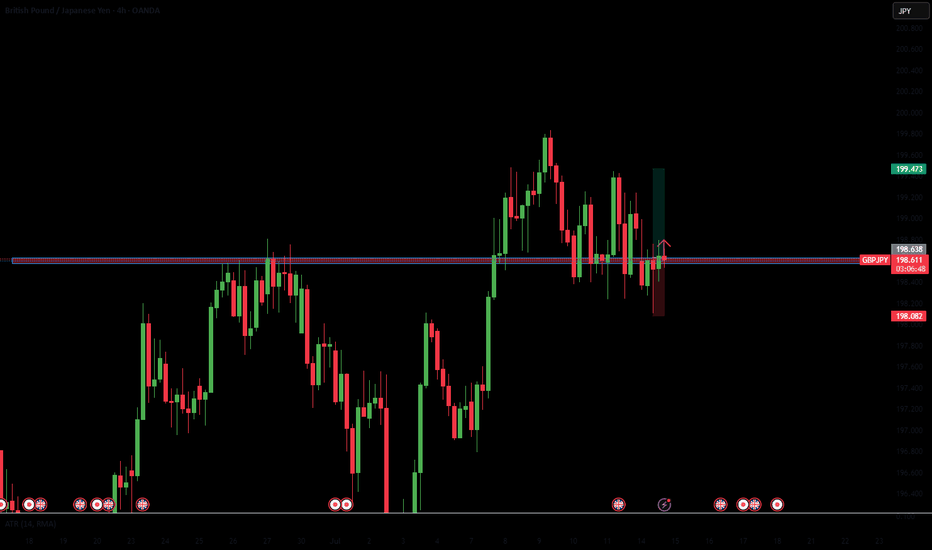
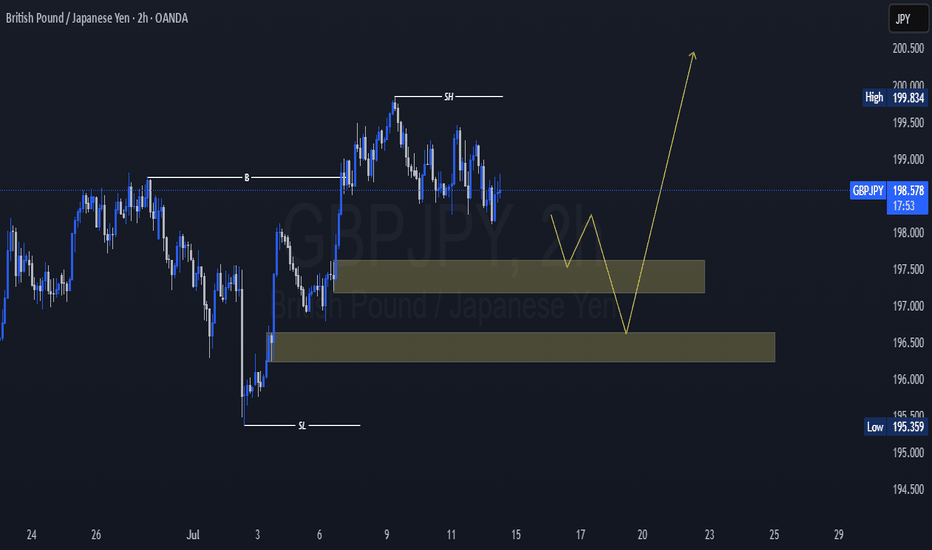
GBPJPY BUY!!!!GJ sentimental is bullish today, and early morning it just grabbed liquidity of the Asian session low. Now, let take a long position We first aim for 1:1 the 1:2 after securing some profitsLongby Master-Matt4
GBPJPY-BULL RUNGBPJPY is in bull run as it is making BULLISH continuation pattren AB=CD and broked strong resistence.Longby uasghar2801
GBPJPY H4 | Bullish Momentum?Based on the H4 chart analysis, we can see that the price is falling to our buy entry at 192.14, which is a pullback support. Our take profit will be at 193.90, a pullback resistance close to the 61.8% Fibo retracement and 78.6% Fibo projection, indicating a strong level of resistance. The stop loss will be placed at 190.18, which is a pullback support level. High Risk Investment Warning Trading Forex/CFDs on margin carries a high level of risk and may not be suitable for all investors. Leverage can work against you. Stratos Markets Limited (www.fxcm.com): CFDs are complex instruments and come with a high risk of losing money rapidly due to leverage. 64% of retail investor accounts lose money when trading CFDs with this provider. You should consider whether you understand how CFDs work and whether you can afford to take the high risk of losing your money. Stratos Europe Ltd, previously FXCM EU Ltd (www.fxcm.com): CFDs are complex instruments and come with a high risk of losing money rapidly due to leverage. 66% of retail investor accounts lose money when trading CFDs with this provider. You should consider whether you understand how CFDs work and whether you can afford to take the high risk of losing your money. Stratos Trading Pty. Limited (www.fxcm.com): Trading FX/CFDs carries significant risks. FXCM AU (AFSL 309763), please read the Financial Services Guide, Product Disclosure Statement, Target Market Determination and Terms of Business at www.fxcm.com Stratos Global LLC (www.fxcm.com): Losses can exceed deposits. Please be advised that the information presented on TradingView is provided to FXCM (‘Company’, ‘we’) by a third-party provider (‘TFA Global Pte Ltd’). Please be reminded that you are solely responsible for the trading decisions on your account. There is a very high degree of risk involved in trading. Any information and/or content is intended entirely for research, educational and informational purposes only and does not constitute investment or consultation advice or investment strategy. The information is not tailored to the investment needs of any specific person and therefore does not involve a consideration of any of the investment objectives, financial situation or needs of any viewer that may receive it. Kindly also note that past performance is not a reliable indicator of future results. Actual results may differ materially from those anticipated in forward-looking or past performance statements. We assume no liability as to the accuracy or completeness of any of the information and/or content provided herein and the Company cannot be held responsible for any omission, mistake nor for any loss or damage including without limitation to any loss of profit which may arise from reliance on any information supplied by TFA Global Pte Ltd. The speaker(s) is neither an employee, agent nor representative of FXCM and is therefore acting independently. The opinions given are their own, constitute general market commentary, and do not constitute the opinion or advice of FXCM or any form of personal or investment advice. FXCM neither endorses nor guarantees offerings of third party speakers, nor is FXCM responsible for the content, veracity or opinions of third-party speakers, presenters or participants. Longby FXCM6
#GBPJPY DAILYGBPJPY Daily Analysis The GBPJPY pair is approaching a significant resistance level on the daily chart, where selling pressure has historically emerged. This zone indicates a potential reversal area, providing an opportunity for a sell position if the price fails to break above the resistance. Technical Outlook: Pattern: Resistance Forecast: Bearish (Sell Opportunity) Entry Strategy: Enter a sell position if the price shows rejection at the resistance level. Traders should monitor for bearish signals such as reversal candlestick patterns (e.g., shooting star or bearish engulfing) or indicators like RSI reflecting overbought conditions. Proper risk management is essential, with stop-loss orders placed above the resistance level and targets set at nearby support zones.Shortby PIPSFIGHTER2213
Bearish Retracement For Bullish ContinuationPrice has recently made a bull run and is now in the retracement phase. I'm expecting price to react in my support zone for a rejection and continuation to the upside. If price doesn't react to my support zone, I will then pull out my fib and expect a reaction in the golden zone to continue its longs! Longby Rhoward29222
GBPJPY Probable Trade IdeaOne neglected and over looked skill in trading is OBJECTIVITY. GBPJPY is at a level where we have to objectively look at it because it could either break the resistance for a buy or respect the resistance for a sell. A break of Structure on the Lower TF will confirm our entries. by KAYCEEFX14
Buy ideaDescending wedge broke out last week and i expect price to continue to rise throughout this week to the resistance above. There was abit of consolidaiton at the now broken resistance level so hopefully it should be smooth sailing upwards frpm there! let me know what you think! Comments and/or suggestions highly appreciated :)Longby Bp_Tradezz2
Bullish Opportunity in GBP/JPY? Strategy Using Fibonacci and RSIHey traders! Today, I’m excited to share an interesting trading opportunity I spotted on the GBP/JPY pair in the 30-minute timeframe. The price is currently respecting the 50% Fibonacci retracement level at 190.752, which is aligning as a strong support zone. Additionally, the RSI is sitting at 43.80, suggesting there’s still room for an upward move before hitting overbought levels. On top of that, the ascending trendline is holding steady, giving further confluence for a potential bullish setup. Here’s my plan: - Stop Loss: Below 189.729, which is a key support zone in case the price breaks lower. - Take Profit: First target at 191.385, with a potential extension to 192.419 if momentum continues. The key here is to wait for confirmation! Ideally, we’ll see increased volume or a strong bullish candle to validate the entry. Remember, proper risk management is essential. What do you think of this setup? Drop your thoughts in the comments, and don’t forget to like and subscribe for more trading insights! See you in the next idea!" Disclaimer: This Idea is for educational and informational purposes only and does not constitute financial advice. Trading in financial markets carries significant risks, and it is important to conduct your own analysis before making any investment decisions. I am not responsible for any losses incurred from your trades. Always trade with proper risk management.Longby MetalsMineUpdated 1
GBP/JPY SELLERS WILL DOMINATE THE MARKET|SHORT Hello, Friends! The BB upper band is nearby so GBP-JPY is in the overbought territory. Thus, despite the uptrend on the 1W timeframe I think that we will see a bearish reaction from the resistance line above and a move down towards the target at around 188.358. ✅LIKE AND COMMENT MY IDEAS✅Shortby EliteTradingSignals339
GBPJPY H4 I Rising from 61.8?Based on the H4 chart analysis, we can see that the price is falling to our buy entry at 189.93, which is a pullback support close to 61.8% Fibo retracement. Our take profit will be at 192.85, a pullback resistance close to 50% Fibo retracement. The stop loss will be placed at 188.09, which is a swing low support level. High Risk Investment Warning Trading Forex/CFDs on margin carries a high level of risk and may not be suitable for all investors. Leverage can work against you. Stratos Markets Limited (www.fxcm.com): CFDs are complex instruments and come with a high risk of losing money rapidly due to leverage. 64% of retail investor accounts lose money when trading CFDs with this provider. You should consider whether you understand how CFDs work and whether you can afford to take the high risk of losing your money. Stratos Europe Ltd, previously FXCM EU Ltd (www.fxcm.com): CFDs are complex instruments and come with a high risk of losing money rapidly due to leverage. 66% of retail investor accounts lose money when trading CFDs with this provider. You should consider whether you understand how CFDs work and whether you can afford to take the high risk of losing your money. Stratos Trading Pty. Limited (www.fxcm.com): Trading FX/CFDs carries significant risks. FXCM AU (AFSL 309763), please read the Financial Services Guide, Product Disclosure Statement, Target Market Determination and Terms of Business at www.fxcm.com Stratos Global LLC (www.fxcm.com): Losses can exceed deposits. Please be advised that the information presented on TradingView is provided to FXCM (‘Company’, ‘we’) by a third-party provider (‘TFA Global Pte Ltd’). Please be reminded that you are solely responsible for the trading decisions on your account. There is a very high degree of risk involved in trading. Any information and/or content is intended entirely for research, educational and informational purposes only and does not constitute investment or consultation advice or investment strategy. The information is not tailored to the investment needs of any specific person and therefore does not involve a consideration of any of the investment objectives, financial situation or needs of any viewer that may receive it. Kindly also note that past performance is not a reliable indicator of future results. Actual results may differ materially from those anticipated in forward-looking or past performance statements. We assume no liability as to the accuracy or completeness of any of the information and/or content provided herein and the Company cannot be held responsible for any omission, mistake nor for any loss or damage including without limitation to any loss of profit which may arise from reliance on any information supplied by TFA Global Pte Ltd. The speaker(s) is neither an employee, agent nor representative of FXCM and is therefore acting independently. The opinions given are their own, constitute general market commentary, and do not constitute the opinion or advice of FXCM or any form of personal or investment advice. FXCM neither endorses nor guarantees offerings of third party speakers, nor is FXCM responsible for the content, veracity or opinions of third-party speakers, presenters or participants. Longby FXCM3
the over all bias foe the GJ is sell . price is currently heading up but i see this as a case of the little detours kids make on their way home from school , i believe price will still continue in it sell bias but at least it will get to the 191.44 price point before collapsing downShortby uzoma12255
GBPJPYFOR THE BULLSThe strength of the bulls are potentially overtaking the market new week openingLongby Ejike_Odeh2
GBPJPYbreak of major bottom my opinion pullback to resistant zone and move 186.68Shortby masoudghanizade2
GBPJPY Possible SELL The market is currently reacting at Daily structure. Based on 4HR TF, the market seems to be forming a possible reversal chart pattern well. We could see Sellers coming in strong should the current level hold. Disclaimer: Please be advised that the information presented on TradingView is solely intended for educational and informational purposes only.The analysis provided is based on my own view of the market. Please be reminded that you are solely responsible for the trading decisions on your account. High-Risk Warning Trading in foreign exchange on margin entails high risk and is not suitable for all investors. Past performance does not guarantee future results. In this case, the high degree of leverage can act both against you and in your favor.Shortby WiLLProsperForex221
GBPJPYGBPJPY close the week on ascending trendline. On fundamental footnote we have British GDP m/m forecast 0.1% ,GDP Construction Output m/m ,GBP Goods Trade Balance ,GBP Index of Services 3m/3m,GBP Industrial Production m/m ON FRIDAY.BOE(bank of England )monetary policy team will focus GDP m/m, the gross domestic product is the broadest measure of economic activity and the primary gauge of the economy's health. Actual greater than forecast will keep my daily bullish time analysis ontra15:28by Shavyfxhub114
GBPJPY SELL IDEAIn my hourly chart , i can see a possible formation of the Head and shoulders pattern , that is yet to be completed . i'm looking forward to sell on the formation of the right shoulderShortby Naf_fx119
GBPJPY set for bullish move in the 2nd half of the week.Based on the Ichimoku analysis, here’s a trade setup using the 4-hour and daily charts, incorporating Ichimoku Wave and Time Theory: 1. Observations on the Daily Chart: Trend: The price is within the Ichimoku cloud, indicating consolidation or indecision. However, the bullish attempt to break above the cloud suggests upward momentum might develop. Key Levels: Resistance: 197.50 (upper cloud boundary and recent highs). Support: 194.50 (Kijun-Sen and lower cloud boundary). Chikou Span (Lagging Line): Inside the price action, signaling no clear trend confirmation yet. Wave Theory: After a sharp rally in mid-December, the market shows signs of completing a corrective wave within the cloud. Time Theory: If the next bullish move aligns with the current time cycles (Kihon-Suchi intervals: 9, 17, 26), a breakout may occur around the next 2–3 trading days. 2. Observations on the 4-Hour Chart: Trend: The price is trading above the cloud, suggesting a short-term bullish bias. Key Levels: Resistance: 197.00 (recent highs). Support: 195.50 (Kijun-Sen on the 4-hour chart and near the cloud top). Chikou Span: Positioned above the price action, supporting bullish momentum. Wave Theory: The impulsive move to 198.00 was followed by a correction back into the cloud. Current price action suggests a potential new bullish wave starting. Time Theory: Time intervals suggest a minor pullback may complete soon, and the next bullish wave could initiate in the next 4–8 candles. 3. Trade Setup: Bullish Scenario (Preferred): Entry: Wait for a close above 197.00 on the 4-hour chart to confirm bullish momentum. Target 1: 198.50 (previous high on the 4-hour chart). Target 2: 200.00 (psychological level and wave projection). Stop Loss: Below 195.50, where the Kijun-Sen and cloud support converge. Bearish Scenario (If Daily Cloud Resistance Holds): Entry: If price rejects 197.00 and closes below 195.50 on the 4-hour chart. Target 1: 194.00 (daily cloud support). Target 2: 192.50 (next significant support on the daily chart). Stop Loss: Above 197.50. 4. Ichimoku Wave and Time Theory Insights: Wave Analysis: The market may form a new bullish N-wave if it breaks above 197.00. Targets for this wave could align with the 198.50–200.00 zone. Time Analysis: Watch for reversals or breakout confirmations within 2–3 trading days (daily chart) or 4–8 candles (4-hour chart), aligned with the Kihon-Suchi cycles. Longby Welburg_Trading0
GBPJPY long DXY longLast week was a big week for GBP with interest rate freezing at 4.75%, although 3 members voted to reduce the rate instead of the forecast 1, core inflation has slowed up but still remains too high for now. The labour market proved to be balanced. UK's major issue still lingering is the governments autumn budget which has a lot of data to collect before we see the measure of their changes. Japan is showing high interest rates relative to the norm, but also boasts high economic growth with the annoyance of high labour costs. The move last week after the interest rate announcement will be completely retraced before the next move up. Another factor is the DXY which relative to the JPY moves inversely. DXY since the US election has been bullish and I can see it continuing, last week we saw a correction due to PCE data and now we have a free rein. GBPJPY long with targets of 199, 201, 204 support right now is 196.6, a move direct from here would be extremely bullish and a quick move back to 198-199. If we move lower than 196 invalidates my thesis. Idea is based around DOL at 199, trend continuation with fib 1.618 and FVG at 201. Support was prior news resistance level. This is not financial advice for anyone, its solely my take on predicting the next move for GBPJPY. happy holidaysLongby PLaceUrBetsPlease1
GBPJPY - OutlookBUY GBPJPY at discounted price. 1- GBP Index Bullish & JPY Index Bearish 2- GBPJPY Price rejected from 68% Fib with Ascending Trendline support 3- Prominent support at 68% FibLongby adnanfx142
GBPJPYWe can attempt to buy GBPJPY from specified level as it make HL , also 0.618 FIB level intact indicate that it moves upward. SL , TP mention in chart.Longby SignalEdge2
GBP/JPY H1 Analysis – OB Bearish and Bullish Scenarios This chart outlines a potential price reaction for GBP/JPY on the H1 timeframe based on **Order Blocks (OB)** and possible market scenarios: ### Key Zones: 1. **OB Bearish Zone (196.750 - 197.000):** - This is a key **supply zone** where sellers may dominate. If price moves into this area, it could trigger bearish momentum, leading to a reversal. 2. **OB Bullish Zone (195.750 - 196.000):** - This is a **demand zone** where buyers are expected to step in. Price entering this zone could initiate a bullish push back toward higher levels. --- ### Possible Scenarios: 1. **Bullish Rejection from OB Bullish Zone:** - If the price reaches the OB Bullish Zone, we expect a possible **bounce upward** toward the OB Bearish Zone. - **Validation:** Price forms bullish rejection candles (e.g., pin bar or engulfing patterns). - **Target:** The OB Bearish Zone around 196.750-197.000. 2. **Bearish Continuation from OB Bearish Zone:** - If the price hits the OB Bearish Zone after a bullish retracement, we anticipate a **rejection** and downward continuation. - **Validation:** Price forms bearish reversal patterns in the OB Bearish Zone. - **Target:** Break below the OB Bullish Zone, extending to lower support levels. 3. **Direct Breakdown Below OB Bullish Zone:** - If the price fails to hold in the OB Bullish Zone, it could lead to a **bearish breakout** toward deeper support levels. - **Validation:** Price closes strongly below the OB Bullish Zone. - **Target:** Lower levels around 194.500 or further down. --- ### Notes: - Monitor candlestick patterns and volume near the key zones to confirm entries. - Be cautious of **false breakouts**; wait for clear confirmation before entering trades. - Use stop-loss levels just below/above the zones to manage risk effectively. by foureyescoder1
Falling towards overlap support?GBP/JPY is falling towards the support level which is an overlap support that lines up with the 38.2% Fibonacci retracement and could bounce from this level to our take profit. Entry: 194.73 Why we like it: There is an overlap support level which lines up with the 38.2% Fibonacci retracement. Stop loss: 193.14 Why we like it: There is a pullback support level that lines up with the 50% Fibonacci retracement. Take profit: 198.45 Why we like it: There is a pullback resistance level. Enjoying your TradingView experience? Review us! Please be advised that the information presented on TradingView is provided to Vantage (‘Vantage Global Limited’, ‘we’) by a third-party provider (‘Everest Fortune Group’). Please be reminded that you are solely responsible for the trading decisions on your account. There is a very high degree of risk involved in trading. Any information and/or content is intended entirely for research, educational and informational purposes only and does not constitute investment or consultation advice or investment strategy. The information is not tailored to the investment needs of any specific person and therefore does not involve a consideration of any of the investment objectives, financial situation or needs of any viewer that may receive it. Kindly also note that past performance is not a reliable indicator of future results. Actual results may differ materially from those anticipated in forward-looking or past performance statements. We assume no liability as to the accuracy or completeness of any of the information and/or content provided herein and the Company cannot be held responsible for any omission, mistake nor for any loss or damage including without limitation to any loss of profit which may arise from reliance on any information supplied by Everest Fortune Group.Longby VantageMarkets3
1218 GBPJPY is on a longways uptrendHello traders, GBPJPY is one of the pair that good for long-term buyers. On daily chart, it could drop down to test EMA soon. But this could be a great chance to open long to follow the long-term uptrend. I have marked out 3 targets on 4H chart for you. This only set when price hit daily EMA and send out reversal signal to open a new trade. GOOD LUCK! LESS IS MORE!Longby FUNTRADER-VeraUpdated 2