GBPNZD: Potential Bearish Wave AheadGBPNZD: Potential Bearish Wave Ahead
GBPNZD is forming a Head and Shoulders pattern at the top of its bullish trend, signaling a possible downward move.
Since this is a large pattern, the bearish wave may unfold gradually.
However, if the price consolidates in the current zone and shows sell signals, the downtrend could resume in the coming days or weeks.
Key Support Levels: 2.2000, 2.1870, 2.1730, and 2.1500.
You may find more details in the chart!
Thank you and Good Luck!
❤️PS: Please support with a like or comment if you find this analysis useful for your trading day❤️
Disclosure: I am part of Trade Nation's Influencer program and receive a monthly fee for using their TradingView charts in my analysis.
GBPNZD trade ideas

GBPNZD - Marco Trend Still Up!Hello TradingView Family / Fellow Traders. This is Richard, also known as theSignalyst.
📈GBPNZD has been overall bullish from a macro perspective trading within the rising channels in blue and orange.
Moreover, the green zone is a strong support, structure and demand.
🏹 Thus, the highlighted blue circle is a strong area to look for buy setups as it is the intersection of support and lower orange/blue trendlines acting non-horizontal support.
📚 As per my trading style:
As #GBPNZD approaches the blue circle zone, I will be looking for bullish reversal setups (like a double bottom pattern, trendline break , and so on...)
📚 Always follow your trading plan regarding entry, risk management, and trade management.
Good luck!
All Strategies Are Good; If Managed Properly!
~Rich
Disclosure: I am part of Trade Nation's Influencer program and receive a monthly fee for using their TradingView charts in my analysis.

GBPNZD Will Collapse! SELL!
My dear followers,
This is my opinion on the GBPNZD next move:
The asset is approaching an important pivot point 2.2536
Bias - Bearish
Safe Stop Loss - 2.2629
Technical Indicators: Supper Trend generates a clear short signal while Pivot Point HL is currently determining the overall Bearish trend of the market.
Goal - 2.2332
About Used Indicators:
For more efficient signals, super-trend is used in combination with other indicators like Pivot Points.
Disclosure: I am part of Trade Nation's Influencer program and receive a monthly fee for using their TradingView charts in my analysis.
———————————
WISH YOU ALL LUCK

GBPNZD Buy forcastGBPNZD New Forecast👨💻👨💻
This is my personal trade and not in anyway a mandatory setup.
Note:
Follow proper risk management rules. Never risk more then 2% of your total capital. Money management is the key of success in this business...... Set your own SL & TP.
Please support this idea with a Like and COMMENT if you find it useful click "follow" on our profile if you will like these type of trading ideas delivered straight to your email in the future.
Thanks for your continued support!! lemme know your thoughts in the comment sec..

GBPNZD Long 4H Timeframe AnalysisHEre is the potential long oppurtunity in GBPNZD, WE can Put the Long Entry Here....

A bullish buyerCan we see a bullish move to retest that M neck line???
Targets
TP1 - 2.23584
TP2 - 2.25224
TP3 - 2.27684
SL - 2.21530

GBP/NZD "Sterling vs Kiwi" Forex Bank Money Heist (Bullish)🌟Hi! Hola! Ola! Bonjour! Hallo! Marhaba!🌟
Dear Money Makers & Robbers, 🤑 💰💸✈️
Based on 🔥Thief Trading style technical and fundamental analysis🔥, here is our master plan to heist the GBP/NZD "Sterling vs Kiwi" Forex Bank Heist. Please adhere to the strategy I've outlined in the chart, which emphasizes long entry. Our aim is to escape near the high-risk ATR Line Zone. It's a Risky level, overbought market, consolidation, trend reversal, trap at the level where traders and bearish robbers are stronger. 🏆💸"Take profit and treat yourself, traders. You deserve it!💪🏆🎉
Entry 📈 : "The heist is on! Wait for the Crossing previous high (2.25500) then make your move - Bullish profits await!"
however I advise to Place Buy stop orders above the Moving average (or) Place buy limit orders within a 15 or 30 minute timeframe most recent or swing, low or high level for Pullback entries.
📌I strongly advise you to set an "alert (Alarm)" on your chart so you can see when the breakout entry occurs.
Stop Loss 🛑: "🔊 Yo, listen up! 🗣️ If you're lookin' to get in on a buy stop order, don't even think about settin' that stop loss till after the breakout 🚀. You feel me? Now, if you're smart, you'll place that stop loss where I told you to 📍, but if you're a rebel, you can put it wherever you like 🤪 - just don't say I didn't warn you ⚠️. You're playin' with fire 🔥, and it's your risk, not mine 👊."
📍 Thief SL placed at the nearest/swing low level Using the 1H timeframe (2.24000) Day trade basis.
📍 SL is based on your risk of the trade, lot size and how many multiple orders you have to take.
🏴☠️Target 🎯: 2.28500
🧲Scalpers, take note 👀 : only scalp on the Long side. If you have a lot of money, you can go straight away; if not, you can join swing traders and carry out the robbery plan. Use trailing SL to safeguard your money 💰.
💰💵💸GBP/NZD "Sterling vs Kiwi" Forex Bank Money Heist is currently experiencing a bullishness,., driven by several key factors. .☝☝☝
📰🗞️Get & Read the Fundamental, Macro Economics, COT Report, Quantitative Analysis, Sentimental Outlook, Intermarket Analysis, Future trend targets with overall score... go ahead to check 👉👉👉🔗🔗🔗
⚠️Trading Alert : News Releases and Position Management 📰🗞️🚫🚏
As a reminder, news releases can have a significant impact on market prices and volatility. To minimize potential losses and protect your running positions,
we recommend the following:
Avoid taking new trades during news releases
Use trailing stop-loss orders to protect your running positions and lock in profits
💖Supporting our robbery plan 💥Hit the Boost Button💥 will enable us to effortlessly make and steal money 💰💵. Boost the strength of our robbery team. Every day in this market make money with ease by using the Thief Trading Style.🏆💪🤝❤️🎉🚀
I'll see you soon with another heist plan, so stay tuned 🤑🐱👤🤗🤩

GBP_NZD LONG SIGNAL|
✅GBP_NZD is going down
To retest a horizontal support
Level of 2.2200 so after the
Retest we can enter a long
Trade with the TP of 2.2459
And the SL of 2.2132
LONG🚀
✅Like and subscribe to never miss a new idea!✅
Disclosure: I am part of Trade Nation's Influencer program and receive a monthly fee for using their TradingView charts in my analysis.

GBPNZD Daily Analysis – Bearish Setup in PlayGBPNZD pair is setting up for a potential bearish continuation as technical patterns and macroeconomic context align. With key central bank events on the horizon this week—including the Bank of England rate decision and New Zealand's employment data—volatility is expected. Traders should be cautious yet prepared, as current price action suggests a possible breakdown in the days ahead.
🔍 Chart Structure & Key Observations
Rising Wedge Breakdowns (Bearish Patterns):
Multiple rising wedges broke to the downside, which is a bearish signal.
These breakdowns were followed by lower highs — indicating bearish momentum is strengthening.
Current Price Action:
Price is currently sitting at 2.2245, just above the 78.6% Fibonacci retracement level (2.2039).
A support test is occurring here. If it breaks, expect acceleration in downside momentum.
Bearish Flag/Pennant Setup:
Recent price action appears to be forming a bearish continuation pattern (flag or descending channel).
The blue arrow indicates a potential bearish breakout continuation after a short-term pullback (retest).
Fibonacci Retracement & Key Support Zones:
Fib levels and horizontal support coincide at multiple critical zones:
2.2039–2.2002: Minor support.
2.1818–2.1685: Strong confluence of 100% Fib level and horizontal demand zone.
2.1515–2.1509: Next major support (prior structure level).
2.0981: Projected extension target (141.4% Fib), a potential final target if the breakdown continues.
Trade Plan (as per the chart):
Entry: Bearish confirmation after a retest around 2.23–2.24 zone.
Stop: Just above the recent highs or above 2.25.
Targets:
TP1: 2.2002
TP2: 2.1810
TP3: 2.1510
Final TP: 2.0980
🧠 Fundamental Context to Watch
Considering the NZD and GBP sensitivity to central bank policy:
NZD: Watch RBNZ’s Financial Stability Report and employment data (due this week)
GBP: Bank of England rate decision and inflation letter also due this week
USD & global risk appetite could influence sentiment, as Powell and Trump tensions gro

GBP/NZD BEARS ARE STRONG HERE|SHORT
Hello, Friends!
Bearish trend on GBP/NZD, defined by the red colour of the last week candle combined with the fact the pair is overbought based on the BB upper band proximity, makes me expect a bearish rebound from the resistance line above and a retest of the local target below at 2.209.
Disclosure: I am part of Trade Nation's Influencer program and receive a monthly fee for using their TradingView charts in my analysis.
✅LIKE AND COMMENT MY IDEAS✅

LONG ON GBP/NZDGBP/NZD is respecting a major support zone and is currently ready to rise.
I will be buying GBP/NZD to the previous swing high looking to catch 200-300 pips throughout the rest of the week.

GBPNZD Bias: Bullish on support confirmationPrice has now completed the deeper pullback to 2.22091, which was our lower-level support target. On the 4H chart, price is beginning to form support here, suggesting potential upside continuation.
If this level holds, I’ll be looking for staged buys from:
2.22091 (current support area)
2.23958 (previous key support/structure break)
2.24775 (resistance flip and clean structure)
Intraday target:
2.26228 — around 400 pips from the 2.22091 support area
Next steps: Wait for confirmation from current 4H candle. If support holds and bullish structure confirms, execute in layers toward 2.26228. If 2.22091 breaks, we reassess.

BULLISH BIAS ON GBPNZD USING TOP DOWN ANALYSIS!!On the 4hr timeframe, price former a wider divergence + a falling wedge right at the key zone all signaling bullish bias and you can see as price broke out from the falling wedge and trendline and continued to push higher!!

GBP/NZD Long Setup🔹 GBP/NZD Long Setup
Price tapped into a clear demand zone and showed signs of rejection and potential reversal. I'm anticipating a bullish move toward the next resistance level.
📍 Entry Zone: Around 2.2440
🛑 Stop Loss: 2.2396
🎯 Target (TP): 2.2619
💡 Risk-Reward Ratio: Over 1:4

BULLISH BIAS ON GBPNZD USING TOP DOWN ANALYSIS!!On the Daily time frame: We established the key weekly zone + momentum loss + tight daily divergence + daily price action candle formation right at the key weekly son all signaling bullish!!
Potential GBP/NZD long trade setupOkay, let's delve into each of those aspects for this potential GBP/NZD long trade setup:
Probability of This Setup Playing Out
While bullish divergence within a descending wedge can be a strong indication of a potential reversal, it's crucial to remember that no trading setup has a 100% success rate. Here's a breakdown of factors that could influence the probability:
Strength of the Divergence: The clearer and more pronounced the bullish divergence, the higher the potential probability. In your chart, the divergence looks reasonably clear, with the MACD making higher lows while the price makes lower lows.
Breakout Confirmation: The probability increases significantly upon a confirmed breakout above the upper trendline of the descending wedge. A strong bullish candle closing above this line, ideally with increasing volume, would add confidence.
Market Context: Consider the broader market environment. Are there any significant fundamental events (e.g., central bank announcements, economic data releases) related to either the British Pound or the New Zealand Dollar that could disrupt this technical pattern? Strong unexpected news could invalidate the setup.
Timeframe Congruence: While you're looking at the 4-hour chart, checking higher timeframes (daily, weekly) can provide context on the overall trend. If the longer-term trend aligns with your bullish bias, it can increase the probability of success.
Risk Sentiment: Overall market risk sentiment can also play a role. GBP/NZD can be sensitive to risk appetite.
In summary: The setup has a decent probability due to the bullish divergence and the potential for a wedge breakout, but it's essential to wait for confirmation and be aware of the broader market context.
Potential Entry Points
There are a few potential entry points you could consider, each with its own risk and reward profile:
Aggressive Entry: Entering immediately upon a strong bullish candle breaking and closing above the upper trendline of the descending wedge. This offers the potential for the best entry price but also carries a higher risk of a false breakout.
Conservative Entry: Waiting for a breakout and then a successful retest of the broken upper trendline as support before entering. This can offer a lower-risk entry as it confirms that the previous resistance has now become support. However, the price might not always retest.
Entry on Confirmation Signals: Looking for additional bullish confirmation signals on lower timeframes (e.g., 1-hour chart) after the initial breakout. This could include bullish candlestick patterns or further positive momentum on indicators.
Recommendation: For a balance of potential reward and risk management, waiting for a confirmed breakout followed by potential confirmation on a lower timeframe might be a prudent approach.
Risk Management Strategies
Effective risk management is paramount for any trade. Here are some strategies you could employ:
Stop-Loss Placement: already marked a potential stop-loss level below the recent swing low within the wedge. This is a logical placement as a break below this level could invalidate the bullish setup. Ensure your stop-loss is at a level that, if hit, would indicate the analysis was likely incorrect.
Position Sizing: Only risk a small percentage of your trading capital on this trade (e.g., 1-2%). This will protect you from significant losses even if the trade goes against you. Calculate your position size based on the distance between your entry point and your stop-loss.
Reward-to-Risk Ratio: Aim for a favorable reward-to-risk ratio. Your target levels (TRG 1, TRG 2, TRG 3) allow you to visualize potential profits. Ensure that the potential profit outweighs the potential loss before taking the trade. For example, if your stop-loss represents 20 pips of risk, aim for at least 40-60 pips of potential profit at your initial target (1:2 or 1:3 reward-to-risk).
Trailing Stop-Loss: Once the trade moves into profit, consider using a trailing stop-loss to lock in gains and protect against a sudden reversal.
Confirmation Signals You Might Look For
Beyond the initial breakout, here are some additional signals that could strengthen your bullish conviction:
Increased Volume: Higher trading volume during the breakout suggests strong buying pressure and increases the likelihood of the move being genuine.
Bullish Candlestick Patterns: Formation of bullish candlestick patterns (e.g., bullish engulfing, morning star) after the breakout or during a potential retest can signal further buying interest.
Moving Average Crossovers: If you use moving averages, look for bullish crossovers (e.g., the shorter-term moving average crossing above the longer-term moving average) after the breakout.
MACD Crossover Above Zero: The MACD line crossing above the signal line and then moving above the zero line would indicate increasing bullish momentum.
RSI Above 50: The Relative Strength Index (RSI) moving above the 50 level can confirm increasing bullish strength.
How Fundamentals Might Impact This Technical Analysis
While your analysis is primarily technical, it's crucial to be aware of how fundamental factors could influence GBP/NZD:
Central Bank Policies: Monetary policy decisions and statements from the Bank of England (BoE) and the Reserve Bank of New Zealand (RBNZ) are major drivers for these currencies. Any unexpected hawkish or dovish signals could significantly impact the exchange rate.
Economic Data: Key economic data releases from the UK (e.g., inflation, employment, GDP) and New Zealand (e.g., inflation, employment, trade balance) can lead to volatility and potentially override technical patterns.
Global Risk Sentiment: As mentioned earlier, GBP/NZD can be influenced by global risk appetite. During times of risk aversion, safe-haven currencies might strengthen, potentially impacting this pair.
Geopolitical Events: Unexpected geopolitical events can also introduce volatility and affect currency valuations.
Recommendation: Before taking the trade, it's wise to check the economic calendar for any high-impact news releases scheduled for the British Pound and the New Zealand Dollar in the coming days. Be prepared for potential volatility around these events.
Let me know if you have any more questions or would like to explore any of these points in more detail!
i would love to hear back from you your thoughts on this pair

GBPNZD | 05.05.2025BUY 2.22500 | STOP 2.21000 | TAKE 2.24400 | Technical view: the pair is trading in a wide mid-month range. The New Zealand Dollar is likely to be under pressure this week. We expect the price to rise again to the area of 2.25000.

GBPNZD Possible Swing Hello Traders!
I am currently watching GBPNZD for possible longs.
Price is in a Bullish trend. Using the last swing low and high i can identify discounted prices where i can potentially look to take longs.
Price has tapped into my 71% fib level and had a fractal shift in market structure, we are currently visiting the OB the resulted into MSS, hoping to see a bit of a revisit on market open and possible take longs from there.
SL and take profit (as per the chart layout)

GBPNZD BULLISH BIAS USING TOP DOWN ANALYSIS ON THE WEEKLY TIMEFRAME, Price was is currently in a clear uptrend making higher highs and higher lows. Price created a major weekly resistance turned support + a clear weekly trendline which also lines perfectly with the key zone + clear weekly price action candle that significantly rejected the zone and the trend line all signaling bullish!!

GBPNZD BULLISH BIAS USING TOP DOWN ANALYSIS ON THE MONTHLY TIMEFRAME, It's obvious that price has been very bullish making higher highs and higher lows and forming strong monthly bullish candles.

Potentially bullish rise?GBP/NZD has reacted off the support level which is a pullback support and could rise from this level to our take profit.
Entry: 2.2393
Why we like it:
There is a pullback support level.
Stop loss: 2.2190
Why we like it:
There is a pullback support level.
Take profit: 2.2722
Why we like it:
There is a pullback resistance level that aligns with the 50% Fibonacci retracement.
Enjoying your TradingView experience? Review us!
Please be advised that the information presented on TradingView is provided to Vantage (‘Vantage Global Limited’, ‘we’) by a third-party provider (‘Everest Fortune Group’). Please be reminded that you are solely responsible for the trading decisions on your account. There is a very high degree of risk involved in trading. Any information and/or content is intended entirely for research, educational and informational purposes only and does not constitute investment or consultation advice or investment strategy. The information is not tailored to the investment needs of any specific person and therefore does not involve a consideration of any of the investment objectives, financial situation or needs of any viewer that may receive it. Kindly also note that past performance is not a reliable indicator of future results. Actual results may differ materially from those anticipated in forward-looking or past performance statements. We assume no liability as to the accuracy or completeness of any of the information and/or content provided herein and the Company cannot be held responsible for any omission, mistake nor for any loss or damage including without limitation to any loss of profit which may arise from reliance on any information supplied by Everest Fortune Group.

GBPNZD | 4H | SWING TRADEHey there my dear friends;
SIGNAL ALERT
BUY GBPNZD / 2,23220
🟢TP1: 2,23952
🟢TP2: 2,24909
🟢TP3: 2,27946
🔴SL: 2,20905
Enter low lot because it is high risk 🔽
RR / 2,00
Dear friends, your likes are always my biggest source of motivation for me to share analysis. For this reason, I would like to ask each and every one of my followers; please do not miss your likes.
I sincerely thank everyone who supports me with their likes.

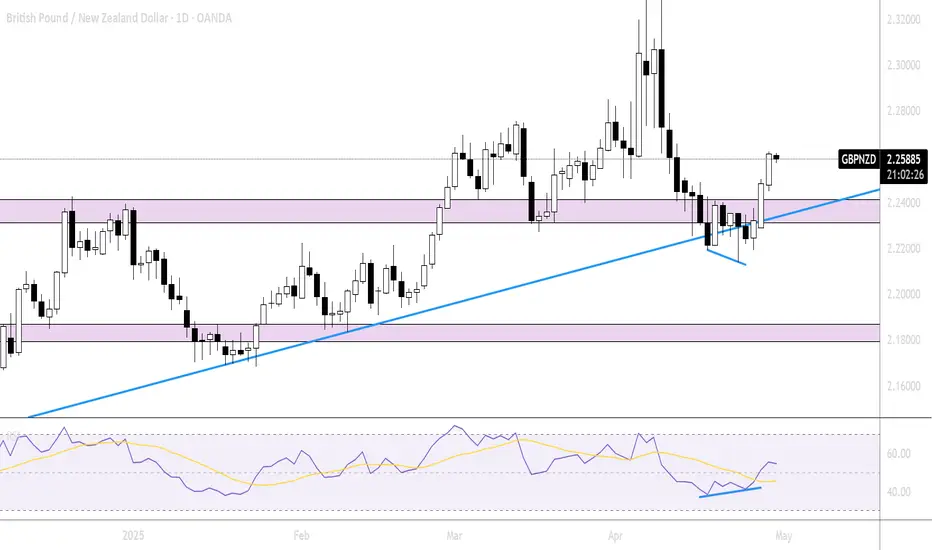
GBP/NZD Testing Channel Support Within UptrendIn the displayed daily chart of GBP/NZD, the price is forming a well-structured and clearly defined ascending channel. This channel is bounded by two thick lines, an upper resistance line and a lower support line, both of which have been tested multiple times by price movements. At the upper boundary, there have been three valid touches, each resulting in a significant downward reaction. Meanwhile, at the lower boundary, there have also been three strong touches, confirming the channel’s validity as the main path of the ongoing uptrend.
In addition to the major channel, there is also a minor internal channel, indicated by dashed lines, showing price movement within a phase of consolidation or minor retracement inside the larger trend. The minor support line is currently being tested, signaling a critical area to determine the next directional move.
At the moment, the price is hovering near the minor support and presents two possible scenarios moving forward.
In the first scenario, the price could bounce from this minor support, continue strengthening toward the minor resistance, and potentially extend further toward the major resistance area around 2.36–2.38.
In the second scenario, if selling pressure persists, the price may break below the minor support and continue falling toward the major support of the larger channel, located around 2.17–2.18, before eventually bouncing back upward.
Overall, this price structure indicates that the primary trend remains bullish as long as the major support within the channel holds. However, in the short term, the market is in a consolidation phase with the risk of a deeper retracement. A confirmed bounce from support or a breakdown through the minor support will be key in determining the next move. The suggested approach is to wait for clear confirmation from price action before making any trading decisions.
